


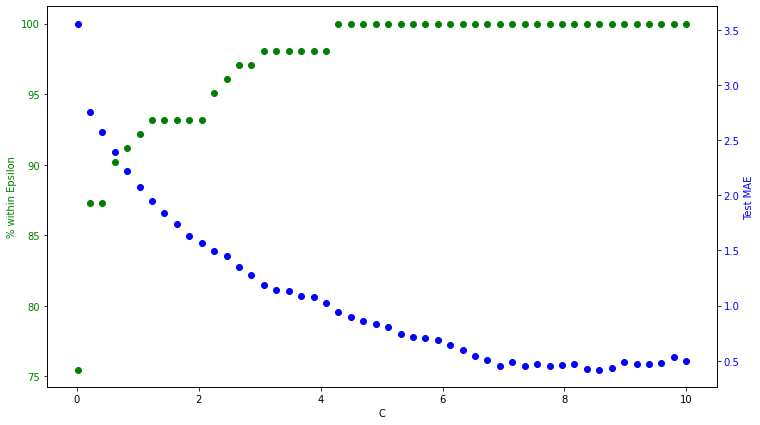
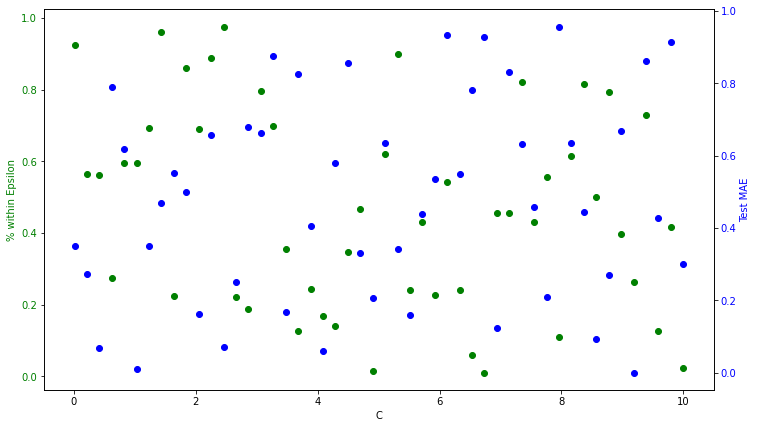
就是绘制如下图像:
import numpy as np
import matplotlib.pyplot as plt

c_space = np.linspace(0.01, 10)
perc_within_eps_list = np.random.random(*c_space.shape)
test_mae_list = np.random.random(*c_space.shape)

fig, ax1 = plt.subplots(figsize=(12,7))

color='green'
ax1.set_xlabel('C')
ax1.set_ylabel('% within Epsilon', color=color)
ax1.scatter(c_space, perc_within_eps_list, color=color)
ax1.tick_params(axis='y', labelcolor=color)

color='blue'
ax2 = ax1.twinx()  # instantiate a second axes that shares the same x-axis
ax2.set_ylabel('Test MAE', color=color)  # we already handled the x-label with ax1
ax2.scatter(c_space, test_mae_list, color=color)
ax2.tick_params(axis='y', labelcolor=color)

plt.show()


 1万+
1万+


 被折叠的 条评论
为什么被折叠?
被折叠的 条评论
为什么被折叠?
 到【灌水乐园】发言


