


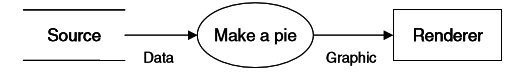
Under the grammar of graphics, the internal processes of “Make a pie” are shown in more detail. These internal processes constitute the syntax of the grammar of graphics.

As a data flow diagram, it simply shows what the stages are, how they must be ordered,and what data are required along the way. This figure gives us the ingredients and the dependencies among the series of “orthogonal” object diagrams abstracted from the OO system. But it does not tell us how to assemble the ingredients.
Then we provide some elementary definitions of terms so that we can assemble ingredients.
2.1 Definitions
2.1.1 Sets
A set is a collection of unique objects. An object in a set is called an element or a member of the set.
2.1.2 Relations
Binary relations
2.1.3 functions
Function or mapping from set A to set B.
2.1.4 Graphs
2.1.5 Compositions
2.1.6 Transformations
2.1.7 Algebras
2.1.8 Variables
2.1.9 Varset
2.1.10 Frames
2.2 Recipe
data:

2.2.1 Create Variables
Extract data into variables. There are many ways of doing that, like creating from relational database, indexing a stream of data… for the example pie, we simply load the data from the database whose form is organized as:
![]()
Extracting data with the following query:
Which equals to:
Response = SELECT bias_toward_males, case FROM ACLS;
Gender = SELECT Gender, case FROM ACLS;
For our pie, we get variables below:

2.2.2 Apply Algebra
A general definition of an algebra is given in Section 2.1.7. Chapter 5 defines a graphics algebra consisting of three operators — cross, blend and nest—applied to a set of variables, together with a set of associated rules. The output of the algebra is a varset.
Last step made two separate variables, we need to combine them into one variable so that the rows are associated with each other:

2.2.3 Apply Scales
The categorical variables Response and Gender must have a defined order. A categorical scale transformation associates the values of a categorical variable with the set of integers.

2.2.4 Compute Statistics
Our system will ultimately make one graphical element per row of a varset. For the pie example, we need to reduce the number of cases by doing some statistics.
In the pie example, each Gender is a whole, and the aggregated variable is Response:

2.2.5 Construct Geometry

2.2.6 Apply Coordinates
To make pie wedges, we apply a polar transformation to the shapes that were
produced from the geometry. We send (x, y) to (r, theta) for the shapes.
2.2.7 Compute Aesthetics
Aesthetic functions translate a graph into a graphic. (like position, color and label)
2.3 Notation
2.3.1 Specifications
For any graphic, the expression, attributes, and graphs will be represented
in a multi-line notation that comprises the specification.
the first line(s) contain the DATA functions that create variables from data.
the second line(s) give the TRANS specifications that define the transformation to be applied to the variables.
the third line(s) are the SCALE specifications that specify dimensions on which the graphs will orient themselves.
the forth line(s) is the COORD specification that defines the coordinate system in which
the graphs are to be embedded.
the remaining lines contain the geometric graphing functions for the graphs appearing in the frame. (ELEMENT)
example: a 2-D scatterplot :
DATA: x = x
DATA: y = y
TRANS: x = x
TRANS: y = y
SCALE: linear(dim(1))
SCALE: linear(dim(2))
COORD: rect(dim(1, 2))
GUIDE: axis(dim(1))
GUIDE: axis(dim(2))
ELEMENT: point(position(x*y))


 1120
1120

 被折叠的 条评论
为什么被折叠?
被折叠的 条评论
为什么被折叠?
 到【灌水乐园】发言


