


一、实验目的与要求
1.了解图像分割的意义和常用方法
2.掌握常用的图像分割方法
二、实验相关知识
图像分割就是把图像分成互不重叠的区域并提取出感兴趣目标的技术,是由图像处理到图像分析的关键步骤。
和本实验有关的常用Matlab函数:
edge:检测灰度或二值图像的边缘,返回一个二值图像,1像素是检测到的边缘,0像素是非边缘
用法:BW=edge(I,‘sobel’,thresh,direction); %I为检测对象;
边缘检测算子可用sobel、roberts、prewitt、zerocross、log、canny;
thresh指定阈值,检测时忽略所有小于阈值的边缘,默认自动选择阈值;
direction指定方向,可选项有horizontal、vertical或both,在指定的方向上用算子进行边缘检测
三、实验内容
1、分别用Roberts、Prewitt、Sobel三种边缘检测算子,对图像wire.bmp进行水平、垂直及各个方向的边界检测,并将检测结果转化为白底黑线条的方式显示出来;
(1)源代码
I=imread('C:\Users\Administrator\Pictures\wire.bmp');
I=rgb2gray(I);%将RGB图像或彩色图转换为灰度图像
BW1=edge(I,'roberts',0,'both');%Roberts算子
BW2=edge(I,'roberts',0,'horizontal');%Roberts算子水平方向
BW3=edge(I,'roberts',0,'vertical');%Roberts算子水平方向
subplot(2,3,1);imshow(I);title('原图像');
subplot(2,3,4);imshow(BW1);title('Roberts算子');
subplot(2,3,5);imshow(BW2);title('Roberts算子水平方向');
subplot(2,3,6);imshow(BW3);title('Roberts算子垂直方向');

BW4=edge(I,'prewitt',0,'both');%Prewitt算子
BW5=edge(I,'prewitt',0,'horizontal');%Prewitt算子水平方向
BW6=edge(I,'prewitt',0,'vertical');%Prewitt算子垂直方向
figure;
subplot(2,3,1);imshow(BW4);title('Prewitt算子');
subplot(2,3,2);imshow(BW5);title('Prewitt算子水平方向');
subplot(2,3,3);imshow(BW6);title('Prewitt算子垂直方向');

BW7=edge(I,'sobel',0,'both');%Sobel算子
BW8=edge(I,'sobel',0,'horizontal');%Sobel算子水平方向
BW9=edge(I,'sobel',0,'vertical');%Sobel算子垂直方向
subplot(2,3,4);imshow(BW7);title('Sobel算子');
subplot(2,3,5);imshow(BW8);title('Sobel算子水平方向');
subplot(2,3,6);imshow(BW9);title('Sobel算子垂直方向');

%转化为白底黑线条
figure;
subplot(1,3,1);imshow(reverse_color(BW1));title('Roberts算子');
subplot(1,3,2);imshow(reverse_color(BW4));title('Prewitt算子');
subplot(1,3,3);imshow(reverse_color(BW7));title('Sobel算子');

function [ BW_new ] = reverse_color( BW )
[m,n]=size(BW);
BW_new=zeros(m,n);
for i=1:m
    for j=1:n
        if BW(i,j)==0
            BW_new(i,j)=1;
         end
     end
end
end
(2)实验结果


2、使用手动阈值分割法对bottle图像进行分割,显示分割结果,并分析其优缺点。
(1)源代码
I=imread('C:\Users\Administrator\Pictures\bottle.tif');
subplot(1,2,1);imshow(I);title('原图像');
subplot(1,2,2);imhist(I);title('直方图');

[m,n]=size(I);
J=zeros(m,n);
for i=1:1:m
    for j=1:1:n
        if I(i,j)>130
            J(i,j)=1;
        else
            J(i,j)=0;
        end
     end
end
figure;
imshow(J);
(2)实验结果


(3)实验分析
优点:直接利用图像的灰度特性,所以计算简单、运算效率较高、速度快。
缺点:对噪声敏感,对灰度差异不明显以及不同目标灰度值有重叠分割不明显,所以需要与其他方法进行结合。合适的阈值查找。
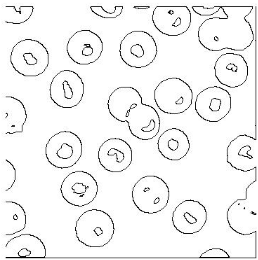
3、对下图A进行处理,得到类似图B的样子;
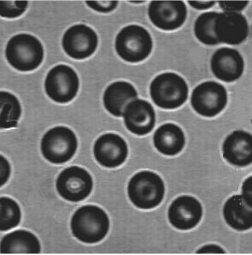
(1)源代码
I=imread('C:\Users\Administrator\Pictures\test53.png');
I=rgb2gray(I);%将RGB图像或彩色图转换为灰度图像
subplot(1,3,1);imshow(I);title('原图像');
subplot(1,3,2);imhist(I);title('直方图');

[m,n]=size(I);
J=zeros(m,n);
for i=1:m
    for j=1:n
        if I(i,j)>110
            J(i,j)=1;
        else
            J(i,j)=0;
        end
     end
end
subplot(1,3,3);imshow(J);title('直方图分割');
BW=edge(J,'roberts',0,'both');%Roberts算子
figure;
subplot(1,2,1);imshow(BW);title('Roberts算子');
subplot(1,2,2);imshow(reverse_color(BW));title('黑白转化');

function [ BW_new ] = reverse_color( BW )
[m,n]=size(BW);
BW_new=zeros(m,n);
for i=1:m
    for j=1:n
        if BW(i,j)==0
            BW_new(i,j)=1;
         end
     end
end
end
(2)实验结果


(3)实验分析
先用直方图阈值分割法对图像进行分割,然后利用Roberts算子进行边缘检测,最后将图像转化为白底黑线。


 1318
1318


 被折叠的 条评论
为什么被折叠?
被折叠的 条评论
为什么被折叠?
 到【灌水乐园】发言


