


写在前面
-
博文内容整理自
Brendan Gregg博客Linux Crisis Tools -
博文地址:https://www.brendangregg.com/blog/2024-03-24/linux-crisis-tools.html
-
对作者谈到的危机工作做简单说明
-
理解不足小伙伴帮忙指正 😃,生活加油
99%的焦虑都来自于虚度时间和没有好好做事,所以唯一的解决办法就是行动起来,认真做完事情,战胜焦虑,战胜那些心里空荡荡的时刻,而不是选择逃避。不要站在原地想象困难,行动永远是改变现状的最佳方式
危机工具列表
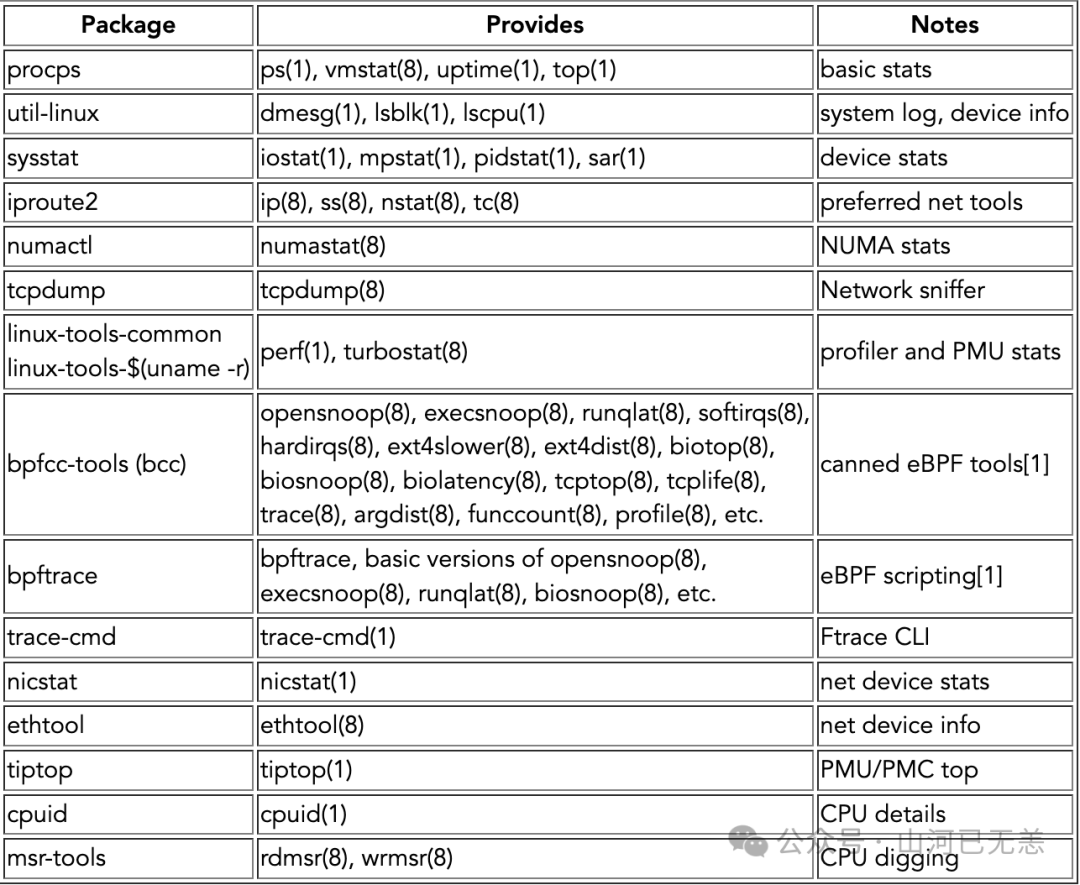
apt install procps -y apt install util-linux -y apt install sysstat -y apt install iproute2 -y apt install numactl -y apt install tcpdump -y apt install linux-tools-common -y apt install linux-tools-$(uname -r) apt install bpfcc-tools -y apt install bpftrace -y apt install -y trace-cmd apt install nicstat -y apt install ethtool -y apt install tiptop -y apt install cpuid -y apt install msr-tools -y
procps
procps 用于查看系统的基本统计信息,提供了多种常用的系统监控和管理命令
-
ps (Process Status):用于显示当前进程的信息。
-
top:实时显示系统中各个进程的资源占用情况。
-
free:显示系统内存的使用情况。
-
vmstat:报告关于虚拟内存、进程、CPU 活动等系统级别的统计信息。
-
uptime:显示系统启动时间和平均负载。
-
w:显示当前登录用户的信息。
-
kill:向进程发送信号,通常用于终止进程。
-
pgrep/pkill:根据名称或其他属性查找和管理进程。
-
pmap:报告进程的内存映射情况。
-
slabtop:显示内核slab缓存的使用情况。
上面的命令应该都熟悉,即使是容器化最小安装,一般也会安装这个工具包
ps(1), vmstat(8), uptime(1), top(1)
util-linux
util-linux 主要用于系统管理和文件操作,包括磁盘分区,文件系统管理,进程管理,系统日志信息以及用户管理
┌──[root@liruilongs.github.io]-[~] └─$dpkg -L util-linux | grep "/bin" /bin/dmesg /bin/findmnt /bin/lsblk /bin/more /bin/mountpoint /bin/su ...... /usr/bin/choom /usr/bin/chrt /usr/bin/delpart /usr/bin/fallocate /usr/bin/fincore /usr/bin/flock .............. /usr/bin/lscpu /usr/bin/lsipc /usr/bin/lslocks /usr/bin/lslogins ....................
用的比较多的 dmesg(1), lsblk(1), lscpu(1), su(1)
dmeseg 用于内核态的一些日志记录,包括内核启动,以及一些驱动日志
lablk 用于统计磁盘的使用情况。
lscpu 用于统计CPU 的性能指标架构信息。
su 命令用于用户切换
sysstat
sysstat 是一个 Linux 系统性能分析工具集,主要包含以下一些常用工具:
-
sar(System Activity Reporter): 收集、报告和保存关于 CPU 利用率、内存使用、磁盘 I/O、网络活动等各种系统活动信息。 -
sadc(System Activity Data Collector): 收集系统活动数据的后台进程。由 sar 命令调用。 -
mpstat: 报告每个可用 CPU 的 MPU 活动。 -
iostat: 报告 CPU 统计信息以及磁盘 I/O 子系统的活动。 -
pidstat: 报告选定任务的 CPU、内存、I/O 等统计信息。 -
cifsiostat: 报告 CIFS/SMB 客户端的 I/O 统计信息。 -
nfsiostat: 报告 NFS 客户端的 I/O 统计信息。 -
tapestat: 报告磁带设备的 I/O 统计信息。
需要启动一下对应的服务
┌──[root@liruilongs.github.io]-[~] └─$systemctl --now enable sysstat.service Synchronizing state of sysstat.service with SysV service script with /lib/systemd/systemd-sysv-install. Executing: /lib/systemd/systemd-sysv-install enable sysstat Created symlink /etc/systemd/system/multi-user.target.wants/sysstat.service → /lib/systemd/system/sysstat.service. Created symlink /etc/systemd/system/sysstat.service.wants/sysstat-collect.timer → /lib/systemd/system/sysstat-collect.timer. Created symlink /etc/systemd/system/sysstat.service.wants/sysstat-summary.timer → /lib/systemd/system/sysstat-summary.timer. ┌──[root@liruilongs.github.io]-[~] └─$
┌──[root@liruilongs.github.io]-[~] └─$sar Linux 5.15.0-112-generic (liruilongs.github.io) 2024年08月13日 _x86_64_ (4 CPU) 16时45分11秒 LINUX RESTART (4 CPU) 16时50分04秒 CPU %user %nice %system %iowait %steal %idle 17时00分09秒 all 0.14 0.00 0.12 0.01 0.00 99.73 平均时间: all 0.14 0.00 0.12 0.01 0.00 99.73 ┌──[root@liruilongs.github.io]-[~] └─$
用的比较多的:iostat(1), mpstat(1), pidstat(1), sar(1)
sar 用于查看系统历史性能信息,iostat,mpstat,pidstat 用于查看 IO,CPU 和进程的实时性能信息。
iproute2
iproute2 是一个 Linux 系统的网络配置工具集合,它取代了早期被广泛使用的 net-tools 套件。iproute2 提供了一系列命令行工具,用于管理和配置各种网络设备和功能
iproute2 中一些常用的工具:
ip: 这是 iproute2 的核心工具,可用于管理网络接口、路由表、ARP 表、隧道等。
tc (Traffic Control): 用于配置网络流量控制和整形。
ss (Socket Statistics): 显示套接字统计信息。
nstat: 显示网络统计信息。
ctstat (Connection Tracking): 显示连接跟踪信息。
常用工具:ip(8), ss(8), nstat(8), tc(8)
numactl
numactl 是一个 Linux 命令行工具,用于在 NUMA (Non-Uniform Memory Access) 架构的系统上控制程序的内存分配和处理器亲和性。
NUMA 是一种内存访问模型,在多处理器系统中,每个处理器都有自己的本地内存,访问自己本地内存的速度比访问远程内存的速度快。numactl 可以帮助程序充分利用 NUMA 架构的优势。
多处理器系统使用,numastat(8) ,当前输出信息为单处理器数据
root@liruilonger:~# numastat node0 numa_hit 1880454 numa_miss 0 numa_foreign 0 interleave_hit 3160 local_node 1880454 other_node 0
tcpdump
tcpdump(8) TCP抓包工具
抓包命令 tcpdump -i ens32 -A -nn -w /root/web.cap host 192.168.29.152 and port 8080
抓取 ens32网卡,主机为 192.168.29.152 端口为 8080 的所有出站入站的包。抓包写入 /root/web.cap
┌──[root@vms152.liruilongs.github.io]-[~] └─$tcpdump -i ens32 -A -nn -w /root/web.cap host 192.168.29.152 and port 8080 tcpdump: listening on ens32, link-type EN10MB (Ethernet), capture size 262144 bytes ^C11 packets captured 11 packets received by filter 0 packets dropped by kernel
linux-tools-common
同时需要安装 linux-tools-$(uname -r)
常用工具;perf(1), turbostat(8),
perf 用于系统性能分析
使用了 Linux 的 perf 命令来收集关于 sleep 2 命令执行期间的性能计数器统计信息
┌──[root@liruilongs.github.io]-[~] └─$perf stat sleep 2 Performance counter stats for 'sleep 2': 12.04 msec task-clock # 0.006 CPUs utilized 1 context-switches # 0.083 K/sec 1 cpu-migrations # 0.083 K/sec 74 page-faults # 0.006 M/sec 3,328,860 cycles # 0.276 GHz 0 instructions # 0.00 insn per cycle 289,196 branches # 24.020 M/sec 12,686 branch-misses # 4.39% of all branches 2.034208658 seconds time elapsed 0.000000000 seconds user 0.032226000 seconds sys ┌──[root@liruilongs.github.io]-[~] └─$
turbostat 为 Intel 处理器的一个性能监测工具
bpfcc-tools (bcc)
bpfcc-tools 是基于 BPF (Berkeley Packet Filter) 技术的一套高级性能分析工具集。同时是清单作者开发的 BCC (BPF Compiler Collection) 项目的一部分
常用的工具:
-
opensnoop(8): 跟踪文件打开系统调用,可以观察哪些进程在访问哪些文件。 -
execsnoop(8): 跟踪新进程的创建,可以观察程序的启动过程。 -
runqlat(8): 分析进程的调度延迟,可以观察系统的调度情况。 -
softirqs(8),hardirqs(8): 分析软中断和硬中断的情况,可以发现中断负载问题。 -
ext4slower(8),ext4dist(8): 分析ext4文件系统的I/O性能。 -
biotop(8),biosnoop(8),biolatency(8): 分析块设备I/O的性能。 -
tcptop(8),tcplife(8): 分析TCP连接的情况,包括吞吐量、连接生命周期等。 -
trace(8): 提供通用的动态追踪功能,可以自定义追踪点。 -
argdist(8): 分析函数参数的分布情况。 -
funccount(8): 统计函数的调用次数。 -
profile(8): 基于CPU性能计数器进行采样分析。
tcptop 工具以 KB 为单位显示主机发送并接收的 TCP 流量。这个报告会自动刷新并只包含活跃的 TCP 连接。该工具使用 eBPF 功能,因此开销非常低。
┌──[root@liruilongs.github.io]-[~] └─$/usr/share/bcc/tools/tcptop 13:46:29 loadavg: 0.10 0.03 0.01 1/215 3875 PID COMM LADDR RADDR RX_KB TX_KB 3853 3853 192.0.2.1:22 192.0.2.165:41838 32 102626 1285 sshd 192.0.2.1:22 192.0.2.45:39240 0 0 ...
bpftrace
bpftrace 是一个基于 eBPF 的高级动态跟踪工具,它提供了一种类似于 awk 的领域特定语言(DSL)来编写强大的跟踪脚本。与 bpfcc-tools 相比,bpftrace 提供了更底层和灵活的 eBPF 编程能力。
┌──[root@liruilongs.github.io]-[~] └─$bpftrace -e 'tracepoint:syscalls:sys_enter_open* { @[probe] = count(); }' Attaching 5 probes... ^C @[tracepoint:syscalls:sys_enter_openat]: 2321 ┌──[root@liruilongs.github.io]-[~] └─$
bpftrace 内置了许多常用的探针和函数,如opensnoop、execsnoop、runqlat、biosnoop等,可以快速实现基本的性能分析任务。
简单使用,同时对每个系统调用的开始和结束位置进行跟踪,然后将结果分列输出:
┌──[root@vms100.liruilongs.github.io]-[~] └─$/usr/share/bpftrace/tools/opensnoop.bt Attaching 6 probes... Tracing open syscalls... Hit Ctrl-C to end. PID COMM FD ERR PATH 970 tuned 16 0 /proc/9218/cmdline 9218 curl 4 0 /dev/null 961 updatedb 19 0 . 970 tuned 16 0 /proc/9218/stat 6826 event_loop 88 0 /etc/hosts 961 updatedb 20 0 . 961 updatedb 21 0 . 961 updatedb 22 0 . 1072 dockerd 173 0 /var/lib/docker/containers/bf92d0426c354f8c378d27e51716d3df9781 1072 dockerd 174 0 /var/lib/docker/containers/bf92d0426c354f8c378d27e51716d3df9781 3403 9_dirty_io_sche -1 2 /usr/lib/rabbitmq/lib/rabbitmq_server-3.9.29/plugins/rabbitmq_r 3403 9_dirty_io_sche -1 2 /usr/lib/rabbitmq/lib/rabbitmq_server-3.9.29/plugins/rabbitmq_p 961 updatedb 22 0 . 3403 9_dirty_io_sche -1 2 /usr/lib/rabbitmq/lib/rabbitmq_server-3.9.29/plugins/rabbitmq_p 3403 9_dirty_io_sche -1 2 /usr/lib/rabbitmq/lib/rabbitmq_server-3.9.29/plugins/rabbitmq_p 3403 9_dirty_io_sche -1 2 /usr/lib/rabbitmq/lib/rabbitmq_server-3.9.29/plugins/rabbitmq_p 3403 9_dirty_io_sche -1 2 /usr/lib/rabbitmq/lib/rabbitmq_server-3.9.29/plugins/rabbitmq_p 3403 9_dirty_io_sche -1 2 /usr/lib/rabbitmq/lib/rabbitmq_server-3.9.29/plugins/rabbitmq_p 9219 sshd 9 0 /proc/self/oom_score_adj
trace-cmd
trace-cmd 是一个基于 Ftrace 的命令行工具,它提供了一种更加简单易用的方式来使用 Ftrace 进行系统跟踪和性能分析。
root@liruilonger:~# trace-cmd -h trace-cmd version 2.9.6 (not-a-git-repo) usage: trace-cmd [COMMAND] ... commands: record - record a trace into a trace.dat file set - set a ftrace configuration parameter start - start tracing without recording into a file extract - extract a trace from the kernel stop - stop the kernel from recording trace data restart - restart the kernel trace data recording show - show the contents of the kernel tracing buffer reset - disable all kernel tracing and clear the trace buffers clear - clear the trace buffers report - read out the trace stored in a trace.dat file stream - Start tracing and read the output directly profile - Start profiling and read the output directly
Ftrace 是 Linux 内核提供的一个强大的动态追踪框架,它内置了各种追踪点,可以深入内核并观察系统行为。但是直接使用 Ftrace 的命令行接口比较复杂,trace-cmd 就是为了简化 Ftrace 的使用而诞生的。
nicstat
nicstat(1): 这是一个用于监控网络设备性能的命令行工具。它可以实时显示网卡的吞吐量、错误数、丢包率等指标,帮助我们诊断网络性能问题。
root@liruilonger:~# nicstat Time Int rKB/s wKB/s rPk/s wPk/s rAvs wAvs %Util Sat 15:36:13 lo 0.05 0.05 0.44 0.44 111.4 111.4 0.00 0.00 15:36:13 eth0 15.45 44.95 19.05 11.02 830.8 4175.2 0.00 0.00
ethtool
ethtool(8): 这是一个用于查询和配置网络设备的工具。它可以获取网卡的型号、驱动版本、收发包统计等信息,也可以设置网卡的某些参数以优化性能。
┌──[root@vms81.liruilongs.github.io]-[~/ansible] └─$ethtool ens32 Settings for ens32: Supported ports: [ TP ] Supported link modes: 10baseT/Half 10baseT/Full 100baseT/Half 100baseT/Full 1000baseT/Full Supported pause frame use: No Supports auto-negotiation: Yes Advertised link modes: 10baseT/Half 10baseT/Full 100baseT/Half 100baseT/Full 1000baseT/Full Advertised pause frame use: No Advertised auto-negotiation: Yes Speed: 1000Mb/s Duplex: Full Port: Twisted Pair PHYAD: 0 Transceiver: internal Auto-negotiation: on MDI-X: off (auto) Supports Wake-on: d Wake-on: d Current message level: 0x00000007 (7) drv probe link Link detected: yes
Speed: 1000Mb/s
tiptop
tiptop(1): 这是一个基于 CPU 性能计数器的性能监控工具,类似于 top 命令。它可以显示 CPU 的各种性能指标,如 IPC、缓存命中率、CPU 周期等,帮助我们分析应用程序的性能瓶颈。
cpuid
cpuid(1): 这个工具可以查询 CPU 的详细信息,包括型号、缓存大小、指令集支持等。这些信息对于分析应用程序的性能特性很有帮助。
root@liruilonger:~# cpuid CPU 0: vendor_id = "GenuineIntel" version information (1/eax): processor type = primary processor (0) family = 0x6 (6) model = 0x5 (5) stepping id = 0x7 (7) extended family = 0x0 (0) extended model = 0x5 (5) (family synth) = 0x6 (6) (model synth) = 0x55 (85) (simple synth) = Intel Core (unknown type) (Skylake / Skylake-X / Cascade Lake / Cascade Lake-X) {Skylake}, 14nm++ miscellaneous (1/ebx): process local APIC physical ID = 0x0 (0) maximum IDs for CPUs in pkg = 0x2 (2) CLFLUSH line size = 0x8 (8) brand index = 0x0 (0) brand id = 0x00 (0): unknown ......
msr-tools
msr-tools: 这是一套用于读写 x86 CPU 的 Model-Specific Registers (MSR) 的工具,包括 rdmsr(8) 和 wrmsr(8) 等命令。
MSR 包含了 CPU 的很多低级配置和性能指标,可以用于深入分析 CPU 的行为。
`root@liruilonger:~# rdmsr --help Usage: rdmsr [options] regno --help -h Print this help --version -V Print current version --hexadecimal -x Hexadecimal output (lower case) --capital-hex -X Hexadecimal output (upper case) --decimal -d Signed decimal output --unsigned -u Unsigned decimal output --octal -o Octal output --c-language -c Format output as a C language constant --zero-pad -0 Output leading zeroes --raw -r Raw binary output --all -a all processors --processor # -p Select processor number (default 0) --bitfield h:l -f Output bits [h:l] only root@liruilonger:~#`
黑客&网络安全如何学习
今天只要你给我的文章点赞,我私藏的网安学习资料一样免费共享给你们,来看看有哪些东西。
1.学习路线图
攻击和防守要学的东西也不少,具体要学的东西我都写在了上面的路线图,如果你能学完它们,你去就业和接私活完全没有问题。
2.视频教程
网上虽然也有很多的学习资源,但基本上都残缺不全的,这是我自己录的网安视频教程,上面路线图的每一个知识点,我都有配套的视频讲解。
内容涵盖了网络安全法学习、网络安全运营等保测评、渗透测试基础、漏洞详解、计算机基础知识等,都是网络安全入门必知必会的学习内容。

(都打包成一块的了,不能一一展开,总共300多集)
因篇幅有限,仅展示部分资料,需要点击下方链接即可前往获取
CSDN大礼包:《黑客&网络安全入门&进阶学习资源包》免费分享
3.技术文档和电子书
技术文档也是我自己整理的,包括我参加大型网安行动、CTF和挖SRC漏洞的经验和技术要点,电子书也有200多本,由于内容的敏感性,我就不一一展示了。

因篇幅有限,仅展示部分资料,需要点击下方链接即可前往获取
CSDN大礼包:《黑客&网络安全入门&进阶学习资源包》免费分享
4.工具包、面试题和源码
“工欲善其事必先利其器”我为大家总结出了最受欢迎的几十款款黑客工具。涉及范围主要集中在 信息收集、Android黑客工具、自动化工具、网络钓鱼等,感兴趣的同学不容错过。
还有我视频里讲的案例源码和对应的工具包,需要的话也可以拿走。

因篇幅有限,仅展示部分资料,需要点击下方链接即可前往获取
CSDN大礼包:《黑客&网络安全入门&进阶学习资源包》免费分享
最后就是我这几年整理的网安方面的面试题,如果你是要找网安方面的工作,它们绝对能帮你大忙。
这些题目都是大家在面试深信服、奇安信、腾讯或者其它大厂面试时经常遇到的,如果大家有好的题目或者好的见解欢迎分享。
参考解析:深信服官网、奇安信官网、Freebuf、csdn等
内容特点:条理清晰,含图像化表示更加易懂。
内容概要:包括 内网、操作系统、协议、渗透测试、安服、漏洞、注入、XSS、CSRF、SSRF、文件上传、文件下载、文件包含、XXE、逻辑漏洞、工具、SQLmap、NMAP、BP、MSF…

因篇幅有限,仅展示部分资料,需要点击下方链接即可前往获取


 1014
1014

 被折叠的 条评论
为什么被折叠?
被折叠的 条评论
为什么被折叠?
 到【灌水乐园】发言


