


作者 | JiekeXu
来源 |公众号 JiekeXu DBA之路(ID: JiekeXu_IT)
如需转载请联系授权 | (个人微信 ID:JiekeXu_DBA)
大家好,我是 JiekeXu,江湖人称“强哥”,很高兴又和大家见面了,今天和大家一起来看看 TiDB 8.0 新特性尝鲜,欢迎点击上方蓝字“JiekeXu DBA之路”关注我的公众号,标星或置顶,更多干货第一时间到达!
前 言
TiDB 是平凯星辰 PingCAP 公司自主设计、研发的开源分布式关系型数据库,是一款同时支持在线事务处理与在线分析处理 (Hybrid Transactional and Analytical Processing, HTAP) 的融合型分布式数据库产品,具备水平扩容或者缩容、金融级高可用、实时 HTAP、云原生的分布式数据库、兼容 MySQL 协议和 MySQL 生态等重要特性。
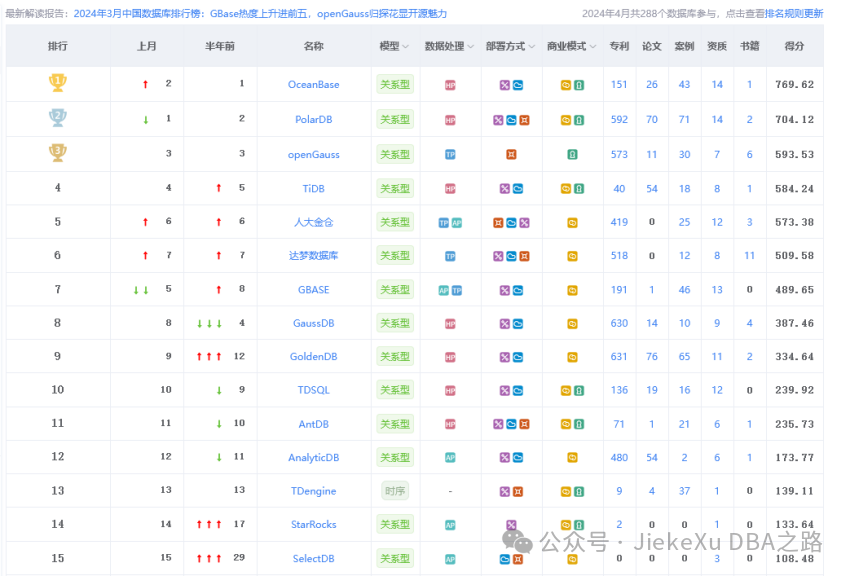
PingCAP 成立于 2015 年,是一家企业级开源分布式数据库厂商,提供包括开源分布式数据库产品、解决方案与咨询、技术支持与培训认证服务,致力于为全球行业用户提供稳定高效、安全可靠、开放兼容的新型数据服务平台,解放企业生产力,加速企业数字化转型升级。目标是为用户提供一站式 OLTP (Online Transactional Processing)、OLAP (Online Analytical Processing)、HTAP 解决方案。TiDB 适合高可用、强一致要求较高、数据规模较大等各种应用场景。本月在墨天轮排行榜上继续保持第四名,上个月末 29 号 TiDB 也发布了一个最新的版本 8.0.0 版本,当然这个版本是 DMR(Development Milestone Releases) 版本。
————————————————————————————
微信公众号:JiekeXu DBA之路
墨天轮:https://www.modb.pro/u/4347
CSDN :https://blog.csdn.net/JiekeXu
ITPUB:https://blog.itpub.net/69968215
腾讯云:https://cloud.tencent.com/developer/user/5645107
————————————————————————————

目 录
一、版本规则介绍
二、版本支持时间表
三、8.0 新特性简介
四、快速上手体验 8.0
1)最小规模拓扑结构
2)下载并安装 TiUP
3)安装 TiUP 的 cluster 组件
4)如果机器已经安装 TiUP cluster,需要更新软件版本
5)调大 MaxSessions
6)创建并启动集群
7)执行集群部署命令
8)启动集群
9) 查看集群状态
10)访问 TiDB 集群
五、清除集群数据
六、销毁集群
七、附:2380端口占用处理办法
一、版本规则介绍
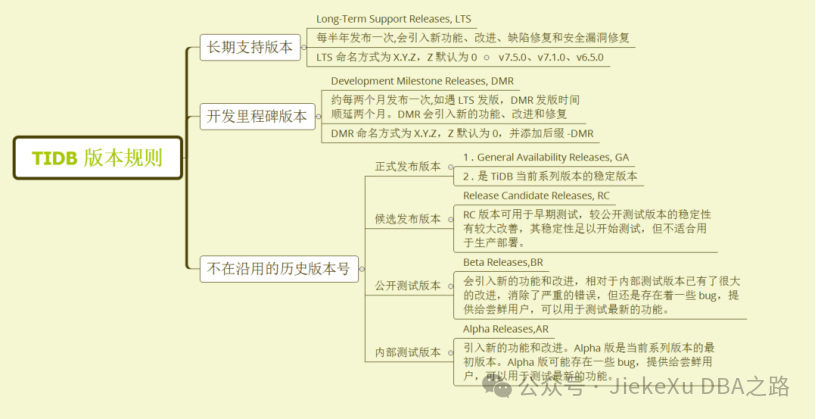
TiDB 版本的命名方式为 X.Y.Z。X.Y 代表一个版本系列。
· 从 TiDB 1.0 起,X 每年依次递增,X 的递增代表引入新的功能和改进。
· Y 从 0 开始依次递增,Y 的递增代表引入新的功能和改进。
· 一个版本系列首次发版时 Z 默认为 0,后续发补丁版本时 Z 从 1 开始依次递增。
二、版本支持时间表
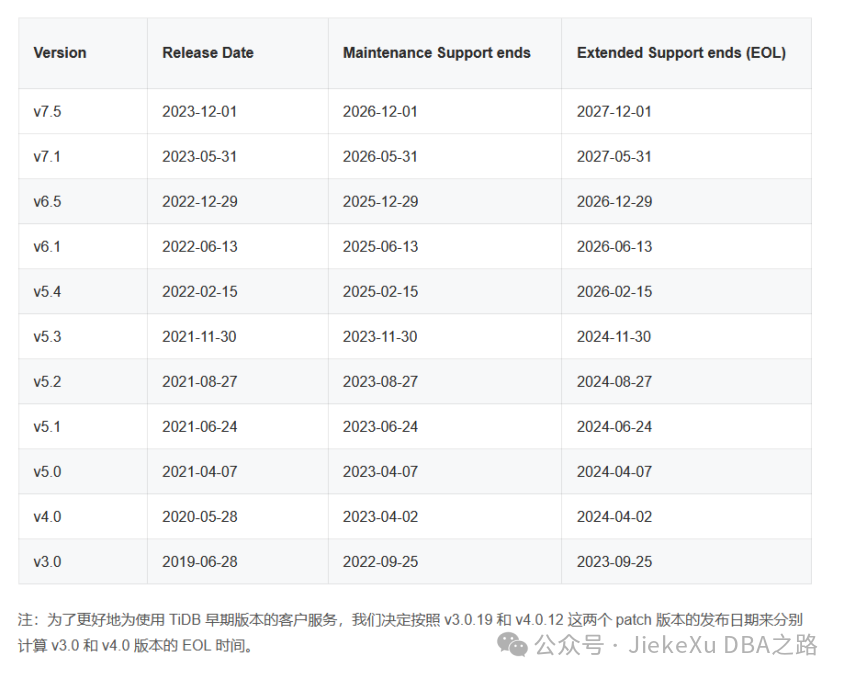
TiDB LTS 版本的生命维护周期定义如下:
· Maintenance Support:针对 LTS 版本,自第一个 Release 版本发版日期开始计算,PingCAP 会提供最多至 3 年时间的常规版本更新,以解决版本运行过程中遇到的问题,以及安全相关的漏洞修复。
· Extended Support:在常规版本维护周期结束之后,PingCAP 会提供 1 年的额外支持服务,具体服务内容包括:
o PingCAP 仅提供严重级别的安全漏洞修复。
o PingCAP 不保证会将所有的补丁合并回当前的主干版本。
o PingCAP 官方技术支持团队会向客户提供已有的补丁或解决方案。如果没有相关方案,那么会指导并协助客户升级到已经解决该问题的主干版本。
· End of Life (EOL): 在 Extended 周期结束之后,PingCAP 就不对该版本提供修复及技术支持服务。
在 EOL 之后,针对有战略合作关系客户的关键应用,PingCAP 可视情况提供额外延长的支持服务,具体请联系对应的客户经理。在该阶段,仅提供标准的技术服务接口,不会有任何的代码级的修复。
注:TiDB DMR 版本仅供开发或测试使用,PingCAP 不提供相关技术支持。
三、8.0 新特性简介
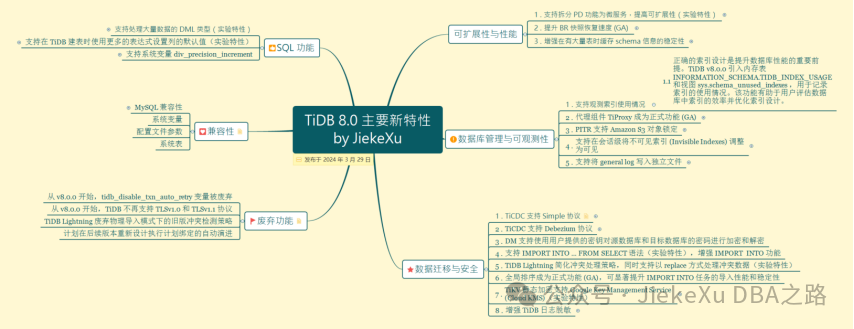
2024 年 3 月 29 日,TiDB 发布 8.0.0 DMR 版本,你可以获得以下关键特性,这里我将新特性分为六大板块,进行简单描述,不在一一展开说明,如果你感兴趣,可去官网查看相关内容:https://docs.pingcap.com/zh/tidb/v8.0/release-8.0.0
TiDB 这里也不是第一次介绍了,最开始接触 3.0 版本,到后面的 4.0 版本,以及21 年4月发布的TiDB 5.0 提供了一个 playground 的命令可以在个人笔记本上使用一台 Linux 机器模拟搭建一个集群环境,才算真真正正用起来了 TiDB。对于这种分布式架构和组件前面也已经介绍过了,今天这里就不介绍了,感兴趣的可查看下面相关文章,今天我们快速部署一个 8.0 的单机分布式的体验环境,体验一下部分新特性即可。
快速上手体验 TiDB 5.0 https://www.modb.pro/db/75269
TiDB 5.4 单机快速安装初体验 https://www.modb.pro/db/336159
分布式数据库 TiDB 6.0 集群保姆级安装手册 https://www.modb.pro/db/420603
TiDB 之 TiCDC6.0 初体验 https://www.modb.pro/db/427262
四、快速上手体验 8.0
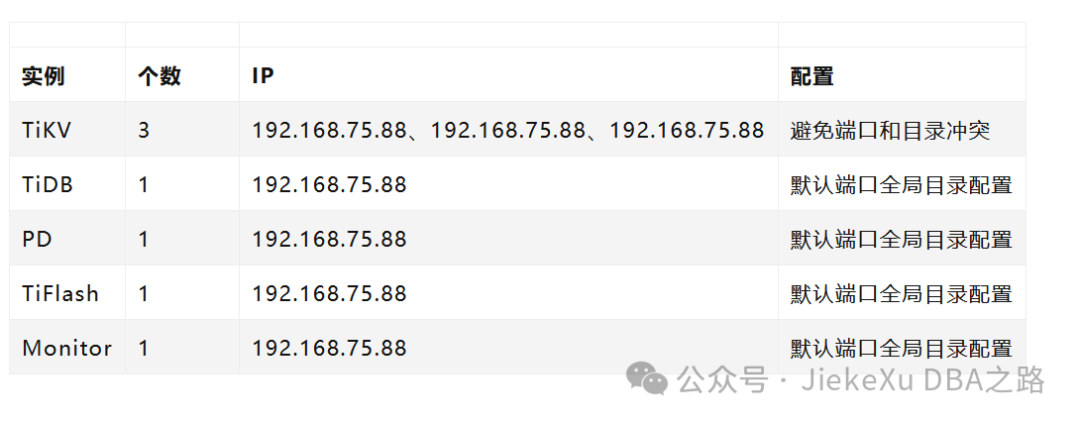
TiDB 是一个分布式系统。最基础的 TiDB 测试集群通常由 2 个 TiDB 实例、3 个 TiKV 实例、3 个 PD 实例和可选的 TiFlash 实例构成。只要你的主机可以联网,便可通过单台 Linux 服务器,体验 TiDB 最小的完整拓扑的集群,并模拟生产环境下的部署步骤,可以快速搭建出一套基础测试集群,步骤如下:
1)最小规模拓扑结构
 2)下载并安装 TiUP
虚拟机使用 NAT 模式能访问互联网即可。
[root@JiekeXu ~]# ping www.baidu.com
PING www.a.shifen.com (220.181.38.149) 56(84) bytes of data.
64 bytes from 220.181.38.149 (220.181.38.149): icmp_seq=1 ttl=128 time=7.26 ms
64 bytes from 220.181.38.149 (220.181.38.149): icmp_seq=2 ttl=128 time=7.35 ms
64 bytes from 220.181.38.149 (220.181.38.149): icmp_seq=3 ttl=128 time=9.07 ms
64 bytes from 220.181.38.149 (220.181.38.149): icmp_seq=4 ttl=128 time=5.94 ms
64 bytes from 220.181.38.149 (220.181.38.149): icmp_seq=5 ttl=128 time=6.99 ms
^C
--- www.a.shifen.com ping statistics ---
5 packets transmitted, 5 received, 0% packet loss, time 4001ms
rtt min/avg/max/mdev = 5.948/7.329/9.078/1.009 ms


curl --proto '=https' --tlsv1.2 -sSf https://tiup-mirrors.pingcap.com/install.sh | sh
[root@JiekeXu ~]#  curl --proto '=https' --tlsv1.2 -sSf https://tiup-mirrors.pingcap.com/install.sh | sh
  % Total    % Received % Xferd  Average Speed   Time    Time     Time  Current
                                 Dload  Upload   Total   Spent    Left  Speed
100 5095k  100 5095k    0     0  7306k      0 --:--:-- --:--:-- --:--:-- 7310k
WARN: adding root certificate via internet: https://tiup-mirrors.pingcap.com/root.json
You can revoke this by remove /root/.tiup/bin/7b8e153f2e2d0928.root.json
Successfully set mirror to https://tiup-mirrors.pingcap.com
Detected shell: bash
Shell profile:  /root/.bash_profile
Installed path: /root/.tiup/bin/tiup
===============================================
Have a try:     tiup playground
===============================================


[root@JiekeXu ~]# source /root/.bash_profile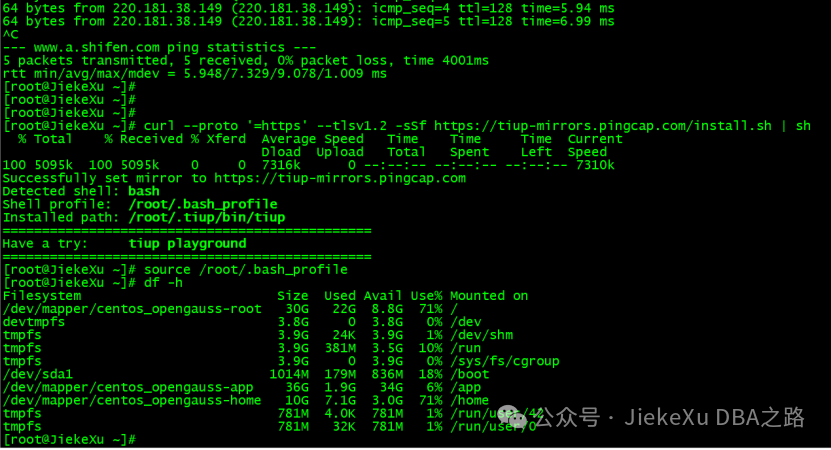
3)安装 TiUP 的 cluster 组件
tiup cluster运行结果如下图:
[root@JiekeXu ~]# tiup cluster
Checking updates for component cluster...
A new version of cluster is available:  -> v1.15.0


    To update this component:   tiup update cluster
    To update all components:   tiup update --all


The component `cluster` version  is not installed; downloading from repository.
download https://tiup-mirrors.pingcap.com/cluster-v1.15.0-linux-amd64.tar.gz 8.76 MiB / 8.76 MiB 100.00% 41.14 MiB/s
Deploy a TiDB cluster for production


Usage:
  tiup cluster [command]


Available Commands:
  check       Perform preflight checks for the cluster.
  deploy      Deploy a cluster for production
  start       Start a TiDB cluster
……
Use "tiup cluster help [command]" for more information about a command.
[root@JiekeXu ~]#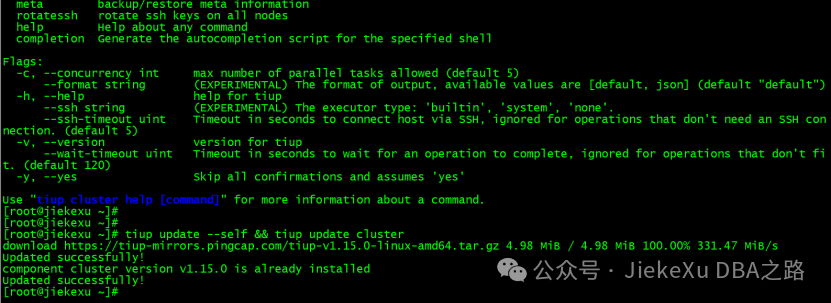
4)如果机器已经安装 TiUP cluster,需要更新软件版本
tiup update --self && tiup update cluster[root@JiekeXu ~]# tiup update --self && tiup update cluster
download https://tiup-mirrors.pingcap.com/tiup-v1.15.0-linux-amd64.tar.gz 4.98 MiB / 4.98 MiB 100.00% 331.47 MiB/s
Updated successfully!
component cluster version v1.15.0 is already installed
Updated successfully!5)调大 MaxSessions
由于模拟多机部署,需要通过 root 用户调大 sshd 服务的连接数限制:
1. 修改 /etc/ssh/sshd_config 将 MaxSessions 调至 20,并去掉注释。
2. 重启 sshd 服务:service sshd restart
6)创建并启动集群
按下面的配置模板,编辑配置文件,命名为 topo.yaml,其中:
· user: “tidb”:表示通过 tidb 系统用户(部署会自动创建)来做集群的内部管理,默认使用 22 端口通过 ssh 登录目标机器
· replication.enable-placement-rules:设置这个 PD 参数来确保 TiFlash 正常运行
· host:设置为本部署主机的 IP
· deploy_dir 和 data_dir:软件目录和数据目录,这里我加了一级目录 /app
配置模板如下,大家可修改 IP 为自己机器 IP,也可自定义端口和节点个数。
vi topo.yaml


# # Global variables are applied to all deployments and used as the default value of
# # the deployments if a specific deployment value is missing.
global:
 user: "tidb"
 ssh_port: 22
 deploy_dir: "/app/tidb-deploy"
 data_dir: "/app/tidb-data"


# # Monitored variables are applied to all the machines.
monitored:
 node_exporter_port: 9100
 blackbox_exporter_port: 9115


server_configs:
 tidb:
   instance.tidb_slow_log_threshold: 300
 tikv:
   readpool.storage.use-unified-pool: false
   readpool.coprocessor.use-unified-pool: true
 pd:
   replication.enable-placement-rules: true
   replication.location-labels: ["host"]
 tiflash:
   logger.level: "info"


pd_servers:
 - host: 192.168.75.88


tidb_servers:
 - host: 192.168.75.88


tikv_servers:
 - host: 192.168.75.88
   port: 20160
   status_port: 20180
   config:
     server.labels: { host: "logic-host-1" }


 - host: 192.168.75.88
   port: 20161
   status_port: 20181
   config:
     server.labels: { host: "logic-host-2" }


 - host: 192.168.75.88
   port: 20162
   status_port: 20182
   config:
     server.labels: { host: "logic-host-3" }


tiflash_servers:
 - host: 192.168.75.88


monitoring_servers:
 - host: 192.168.75.88


grafana_servers:
 - host: 192.168.75.88
7)执行集群部署命令
tiup cluster deploy <cluster-name> <version> ./topo.yaml --user root -p
tiup cluster deploy JiekeXu 8.0.0 ./topo.yaml --user root -p· 参数 <cluster-name> 表示设置集群名称
· 参数 <version> 表示设置集群版本,例如 v8.0.0。可以通过 tiup list tidb 命令来查看当前支持部署的 TiDB 版本
· 参数 -p 表示在连接目标机器时使用密码登录
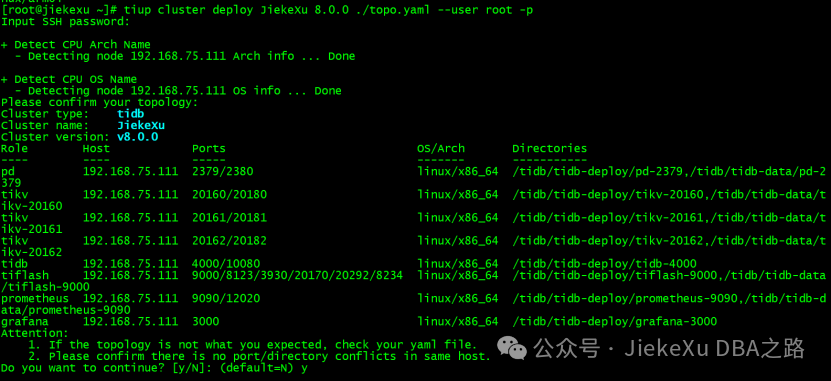

[root@JiekeXu ~]# tiup cluster deploy JiekeXu 8.0.0 ./topo.yaml --user root -p
Input SSH password:


+ Detect CPU Arch Name
  - Detecting node 192.168.75.88 Arch info ... Done


+ Detect CPU OS Name
  - Detecting node 192.168.75.88 OS info ... Done
Please confirm your topology:
Cluster type:    tidb
Cluster name:    JiekeXu
Cluster version: v8.0.0
Role        Host            Ports                            OS/Arch       Directories
----        ----            -----                            -------       -----------
pd          192.168.75.88  2379/2380                        linux/x86_64  /tidb/tidb-deploy/pd-2379,/tidb/tidb-data/pd-2379
tikv        192.168.75.88  20160/20180                      linux/x86_64  /tidb/tidb-deploy/tikv-20160,/tidb/tidb-data/tikv-20160
tikv        192.168.75.88  20161/20181                      linux/x86_64  /tidb/tidb-deploy/tikv-20161,/tidb/tidb-data/tikv-20161
tikv        192.168.75.88  20162/20182                      linux/x86_64  /tidb/tidb-deploy/tikv-20162,/tidb/tidb-data/tikv-20162
tidb        192.168.75.88  4000/10080                       linux/x86_64  /tidb/tidb-deploy/tidb-4000
tiflash     192.168.75.88  9000/8123/3930/20170/20292/8234  linux/x86_64  /tidb/tidb-deploy/tiflash-9000,/tidb/tidb-data/tiflash-9000
prometheus  192.168.75.88  9090/12020                       linux/x86_64  /tidb/tidb-deploy/prometheus-9090,/tidb/tidb-data/prometheus-9090
grafana     192.168.75.88  3000                             linux/x86_64  /tidb/tidb-deploy/grafana-3000
Attention:
    1. If the topology is not what you expected, check your yaml file.
    2. Please confirm there is no port/directory conflicts in same host.
Do you want to continue? [y/N]: (default=N) y
+ Generate SSH keys ... Done
+ Download TiDB components
  - Download pd:v8.0.0 (linux/amd64) ... Done
  - Download tikv:v8.0.0 (linux/amd64) ... Done
  - Download tidb:v8.0.0 (linux/amd64) ... Done
  - Download tiflash:v8.0.0 (linux/amd64) ... Done
  - Download prometheus:v8.0.0 (linux/amd64) ... Done
  - Download grafana:v8.0.0 (linux/amd64) ... Done
  - Download node_exporter: (linux/amd64) ... Done
  - Download blackbox_exporter: (linux/amd64) ... Done
+ Initialize target host environments
  - Prepare 192.168.75.88:22 ... Done
+ Deploy TiDB instance
  - Copy pd -> 192.168.75.88 ... Done
  - Copy tikv -> 192.168.75.88 ... Done
  - Copy tikv -> 192.168.75.88 ... Done
  - Copy tikv -> 192.168.75.88 ... Done
  - Copy tidb -> 192.168.75.88 ... Done
  - Copy tiflash -> 192.168.75.88 ... Done
  - Copy prometheus -> 192.168.75.88 ... Done
  - Copy grafana -> 192.168.75.88 ... Done
  - Deploy node_exporter -> 192.168.75.88 ... Done
  - Deploy blackbox_exporter -> 192.168.75.88 ... Done
+ Copy certificate to remote host
+ Init instance configs
  - Generate config pd -> 192.168.75.88:2379 ... Done
  - Generate config tikv -> 192.168.75.88:20160 ... Done
  - Generate config tikv -> 192.168.75.88:20161 ... Done
  - Generate config tikv -> 192.168.75.88:20162 ... Done
  - Generate config tidb -> 192.168.75.88:4000 ... Done
  - Generate config tiflash -> 192.168.75.88:9000 ... Done
  - Generate config prometheus -> 192.168.75.88:9090 ... Done
  - Generate config grafana -> 192.168.75.88:3000 ... Done
+ Init monitor configs
  - Generate config node_exporter -> 192.168.75.88 ... Done
  - Generate config blackbox_exporter -> 192.168.75.88 ... Done
Enabling component pd
        Enabling instance 192.168.75.88:2379
        Enable instance 192.168.75.88:2379 success
Enabling component tikv
        Enabling instance 192.168.75.88:20162
        Enabling instance 192.168.75.88:20161
        Enabling instance 192.168.75.88:20160
        Enable instance 192.168.75.88:20162 success
        Enable instance 192.168.75.88:20161 success
        Enable instance 192.168.75.88:20160 success
Enabling component tidb
        Enabling instance 192.168.75.88:4000
        Enable instance 192.168.75.88:4000 success
Enabling component tiflash
        Enabling instance 192.168.75.88:9000
        Enable instance 192.168.75.88:9000 success
Enabling component prometheus
        Enabling instance 192.168.75.88:9090
        Enable instance 192.168.75.88:9090 success
Enabling component grafana
        Enabling instance 192.168.75.88:3000
        Enable instance 192.168.75.88:3000 success
Enabling component node_exporter
        Enabling instance 192.168.75.88
        Enable 192.168.75.88 success
Enabling component blackbox_exporter
        Enabling instance 192.168.75.88
        Enable 192.168.75.88 success
Cluster `JiekeXu` deployed successfully, you can start it with command: `tiup cluster start JiekeXu --init`
[root@JiekeXu ~]#
8)启动集群
tiup cluster start JiekeXu --init[root@JiekeXu ~]# tiup cluster start JiekeXu --init
Starting cluster JiekeXu...
+ [ Serial ] - SSHKeySet: privateKey=/root/.tiup/storage/cluster/clusters/JiekeXu/ssh/id_rsa, publicKey=/root/.tiup/storage/cluster/clusters/JiekeXu/ssh/id_rsa.pub
+ [Parallel] - UserSSH: user=tidb, host=192.168.75.88
+ [Parallel] - UserSSH: user=tidb, host=192.168.75.88
+ [Parallel] - UserSSH: user=tidb, host=192.168.75.88
+ [Parallel] - UserSSH: user=tidb, host=192.168.75.88
+ [Parallel] - UserSSH: user=tidb, host=192.168.75.88
+ [Parallel] - UserSSH: user=tidb, host=192.168.75.88
+ [Parallel] - UserSSH: user=tidb, host=192.168.75.88
+ [Parallel] - UserSSH: user=tidb, host=192.168.75.88
+ [ Serial ] - StartCluster
Starting component pd
Starting instance 192.168.75.88:2379
Start instance 192.168.75.88:2379 success
Starting component tikv
Starting instance 192.168.75.88:20162
Starting instance 192.168.75.88:20160
Starting instance 192.168.75.88:20161
Start instance 192.168.75.88:20160 success
Start instance 192.168.75.88:20162 success
Start instance 192.168.75.88:20161 success
Starting component tidb
Starting instance 192.168.75.88:4000
Start instance 192.168.75.88:4000 success
Starting component tiflash
Starting instance 192.168.75.88:9000
Start instance 192.168.75.88:9000 success
Starting component prometheus
Starting instance 192.168.75.88:9090
Start instance 192.168.75.88:9090 success
Starting component grafana
Starting instance 192.168.75.88:3000
Start instance 192.168.75.88:3000 success
Starting component node_exporter
Starting instance 192.168.75.88
Start 192.168.75.88 success
Starting component blackbox_exporter
Starting instance 192.168.75.88
Start 192.168.75.88 success
+ [ Serial ] - UpdateTopology: cluster=JiekeXu
Started cluster `JiekeXu` successfully
The root password of TiDB database has been changed.
The new password is: '+^Z_021Ywm7K@93naU'.
Copy and record it to somewhere safe, it is only displayed once, and will not be stored.
The generated password can NOT be get and shown again.
[root@JiekeXu ~]#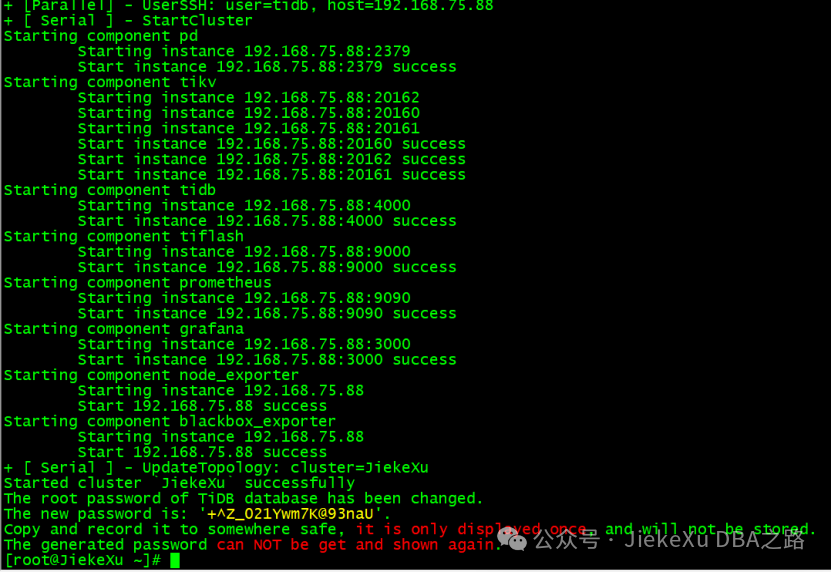
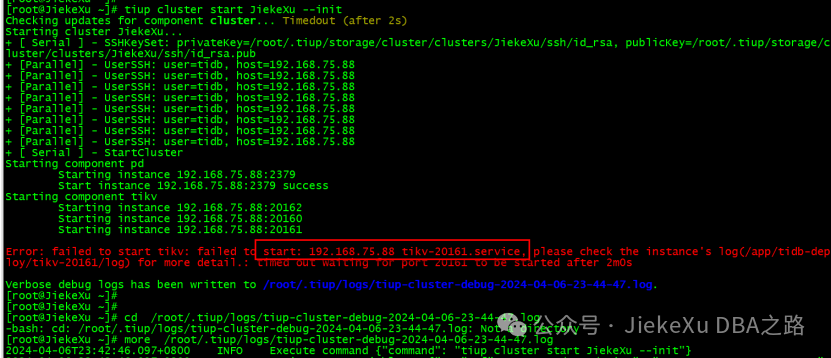
注意:1、上图中黄色密码需要记住,’+^Z_021Ywm7K@93naU’ 这是登录数据库的初始密码,也是访问 TiDB 的 Dashboard 的密码;2、如果你的主机还有其他用途,安装了其他数据库,需要避免端口占用情况。我这里安装了其他数据库占用了 2380 端口,导致启动 TiKV 失败了。
启动集群操作会按 PD -> TiKV -> Pump -> TiDB -> TiFlash -> Drainer -> TiCDC -> Prometheus -> Grafana -> Alertmanager 的顺序启动整个 TiDB 集群所有组件;该命令支持通过 -R 和 -N 参数来只启动部分组件。
例如,下列命令只启动 PD 组件:
tiup cluster start ${cluster-name} -R pd下列命令只启动 10.10.3.4 和 10.10.3.5 这两台机器上的 PD 组件:
tiup cluster start ${cluster-name} -N 10.10.3.4:2379,10.10.3.5:2379关闭集群操作会按 Alertmanager -> Grafana -> Prometheus -> TiCDC -> Drainer -> TiFlash -> TiDB -> Pump -> TiKV -> PD 的顺序关闭整个 TiDB 集群所有组件(同时也会关闭监控组件):
tiup cluster stop ${cluster-name}stop 命令也支持通过 -R 和 -N 参数来只停止部分组件。
9) 查看集群状态
tiup cluster display JiekeXu[root@JiekeXu ~]# tiup cluster display JiekeXu
Cluster type: tidb
Cluster name: JiekeXu
Cluster version: v8.0.0
Deploy user: tidb
SSH type: builtin
Dashboard URL: http://192.168.75.88:2379/dashboard
Grafana URL: http://192.168.75.88:3000
ID Role Host Ports OS/Arch Status Data Dir Deploy Dir
-- ---- ---- ----- ------- ------ -------- ----------
192.168.75.88:3000 grafana 192.168.75.88 3000 linux/x86_64 Up - /app/tidb-deploy/grafana-3000
192.168.75.88:2379 pd 192.168.75.88 2379/2380 linux/x86_64 Up|L|UI /app/tidb-data/pd-2379 /app/tidb-deploy/pd-2379
192.168.75.88:9090 prometheus 192.168.75.88 9090/12020 linux/x86_64 Up /app/tidb-data/prometheus-9090 /app/tidb-deploy/prometheus-9090
192.168.75.88:4000 tidb 192.168.75.88 4000/10080 linux/x86_64 Up - /app/tidb-deploy/tidb-4000
192.168.75.88:9000 tiflash 192.168.75.88 9000/8123/3930/20170/20292/8234 linux/x86_64 Up /app/tidb-data/tiflash-9000 /app/tidb-deploy/tiflash-9000
192.168.75.88:20160 tikv 192.168.75.88 20160/20180 linux/x86_64 Up /app/tidb-data/tikv-20160 /app/tidb-deploy/tikv-20160
192.168.75.88:20161 tikv 192.168.75.88 20161/20181 linux/x86_64 Up /app/tidb-data/tikv-20161 /app/tidb-deploy/tikv-20161
192.168.75.88:20162 tikv 192.168.75.88 20162/20182 linux/x86_64 Up /app/tidb-data/tikv-20162 /app/tidb-deploy/tikv-20162
Total nodes: 8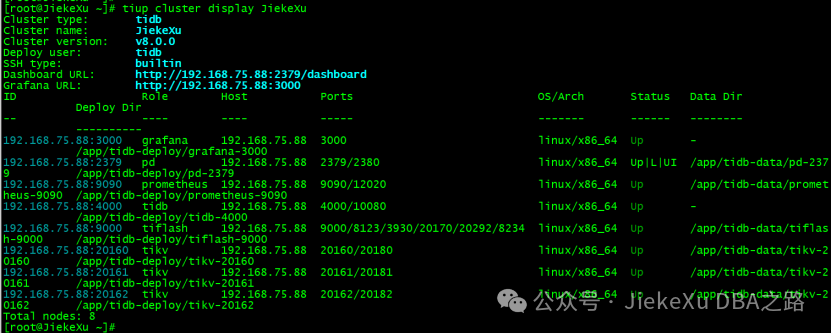
10)访问 TiDB 集群
执行以下命令确认当前已经部署的集群列表
[root@JiekeXu ~]# tiup cluster list
Name User Version Path PrivateKey
---- ---- ------- ---- ----------
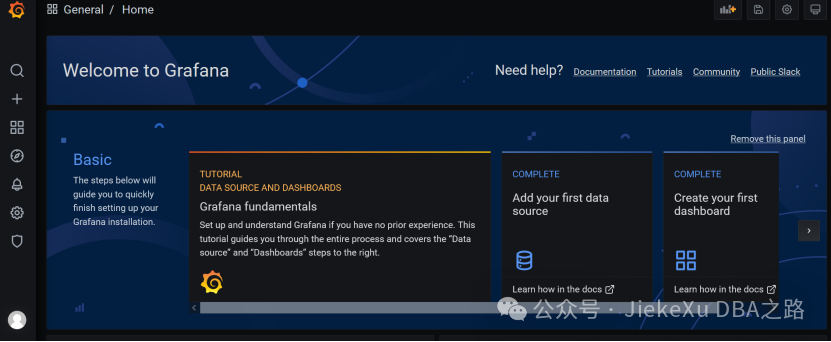
JiekeXu tidb v8.0.0 /root/.tiup/storage/cluster/clusters/JiekeXu /root/.tiup/storage/cluster/clusters/JiekeXu/ssh/id_rsa· 访问 TiDB 的 Grafana 监控通过 http://192.168.75.88:3000 访问集群 Grafana 监控页面,默认用户名和密码均为 admin。首次登录之后强制修改密码,我这里将其修改为 TiDB8.0
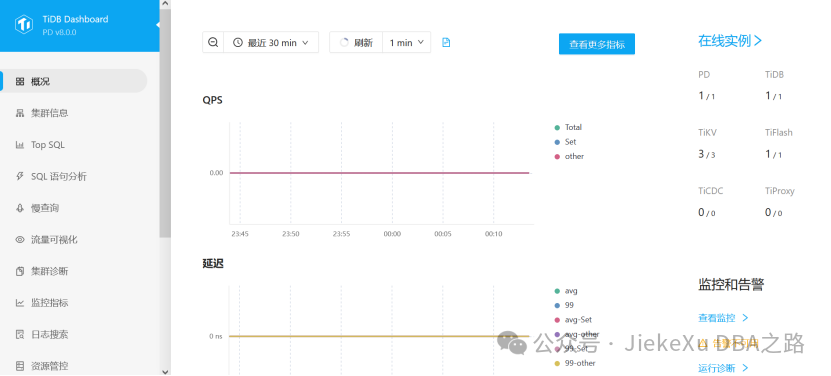
· 访问 TiDB 的 Dashboard
通过 http://192.168.75.88:2379/dashboard 访问集群 TiDB Dashboard 监控页面,默认用户名为 root,密码为上面启动时打印在屏幕上的密码 +^Z_021Ywm7K@93naU。
The new password is: ‘+^Z_021Ywm7K@93naU’.
由于 TiDB 兼容 MySQL,所以可以通过 MySQL 客户端来访问。这里先安装一个 MySQL 命令行客户端工具访问 TiDB。
[root@JiekeXu log]# yum install mysql -y
Loaded plugins: fastestmirror, langpacks
Loading mirror speeds from cached hostfile
 * base: mirrors.huaweicloud.com
 * epel: mirrors.bfsu.edu.cn
 * extras: mirrors.huaweicloud.com
 * updates: mirrors.huaweicloud.com
file:///mnt/centos/repodata/repomd.xml: [Errno 14] curl#37 - "Couldn't open file /mnt/centos/repodata/repomd.xml"
Trying other mirror.
Resolving Dependencies
--> Running transaction check
---> Package mariadb.x86_64 1:5.5.68-1.el7 will be installed
--> Processing Dependency: mariadb-libs(x86-64) = 1:5.5.68-1.el7 for package: 1:mariadb-5.5.68-1.el7.x86_64
--> Running transaction check
---> Package mariadb-libs.x86_64 1:5.5.60-1.el7_5 will be updated
---> Package mariadb-libs.x86_64 1:5.5.68-1.el7 will be an update
--> Finished Dependency Resolution

Dependencies Resolved

=============================================================================================================================
 Package                         Arch                      Version                             Repository               Size
=============================================================================================================================
Installing:
 mariadb                         x86_64                    1:5.5.68-1.el7                      base                    8.8 M
Updating for dependencies:
 mariadb-libs                    x86_64                    1:5.5.68-1.el7                      base                    760 k

Transaction Summary
=============================================================================================================================
Install  1 Package
Upgrade             ( 1 Dependent package)

Total size: 9.5 M
Total download size: 8.8 M
Downloading packages:
mariadb-5.5.68-1.el7.x86_64.rpm                                                                       | 8.8 MB  00:00:00
Running transaction check
Running transaction test
Transaction test succeeded
Running transaction
Warning: RPMDB altered outside of yum.
  Updating   : 1:mariadb-libs-5.5.68-1.el7.x86_64                                                                        1/3
  Installing : 1:mariadb-5.5.68-1.el7.x86_64                                                                             2/3
  Cleanup    : 1:mariadb-libs-5.5.60-1.el7_5.x86_64                                                                      3/3
  Verifying  : 1:mariadb-libs-5.5.68-1.el7.x86_64                                                                        1/3
  Verifying  : 1:mariadb-5.5.68-1.el7.x86_64                                                                             2/3
  Verifying  : 1:mariadb-libs-5.5.60-1.el7_5.x86_64                                                                      3/3

Installed:
  mariadb.x86_64 1:5.5.68-1.el7

Dependency Updated:
  mariadb-libs.x86_64 1:5.5.68-1.el7

Complete!
[root@JiekeXu log]#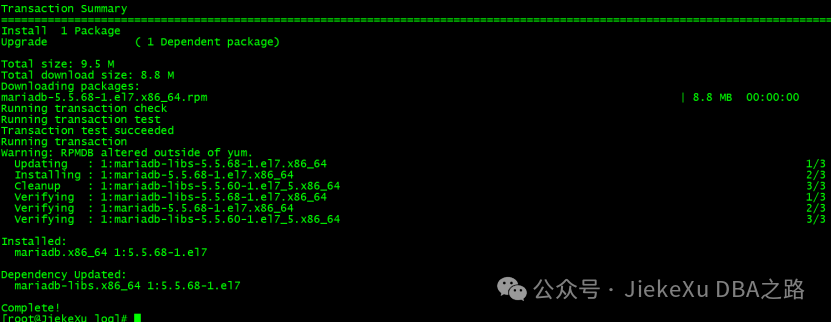
访问 TiDB 数据库,密码为上面第九步屏幕上打印出来的复杂密码:
mysql -h 192.168.75.88 -P 4000 -u root -p


mysql -h 192.168.75.88 -P 4000 -u root -p+^Z_021Ywm7K@93naU
MySQL [(none)]> create database JiekeXu;
Query OK, 0 rows affected (0.24 sec)
MySQL [(none)]> show databases;
+--------------------+
| Database |
+--------------------+
| INFORMATION_SCHEMA |
| JiekeXu |
| METRICS_SCHEMA |
| PERFORMANCE_SCHEMA |
| mysql |
| sys |
| test |
+--------------------+
7 rows in set (0.00 sec)
MySQL [(none)]> use JiekeXu;
Database changed
MySQL [JiekeXu]>当然我们也可以使用 Navicat Permium 16 去连接查询。
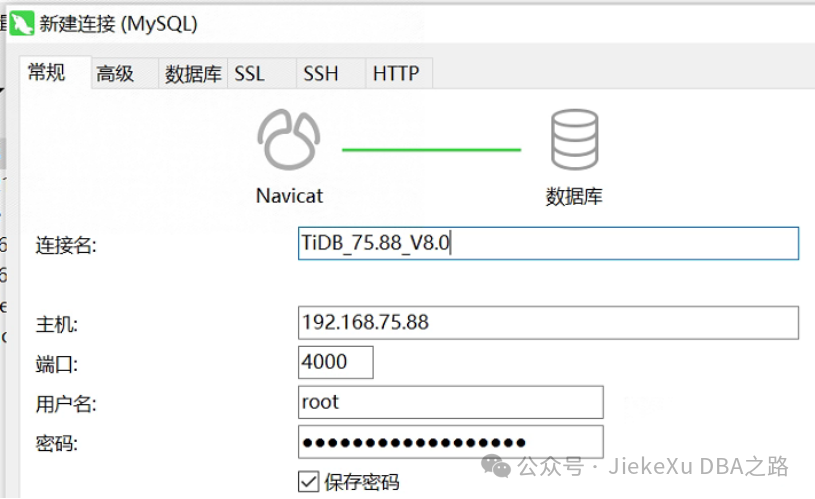
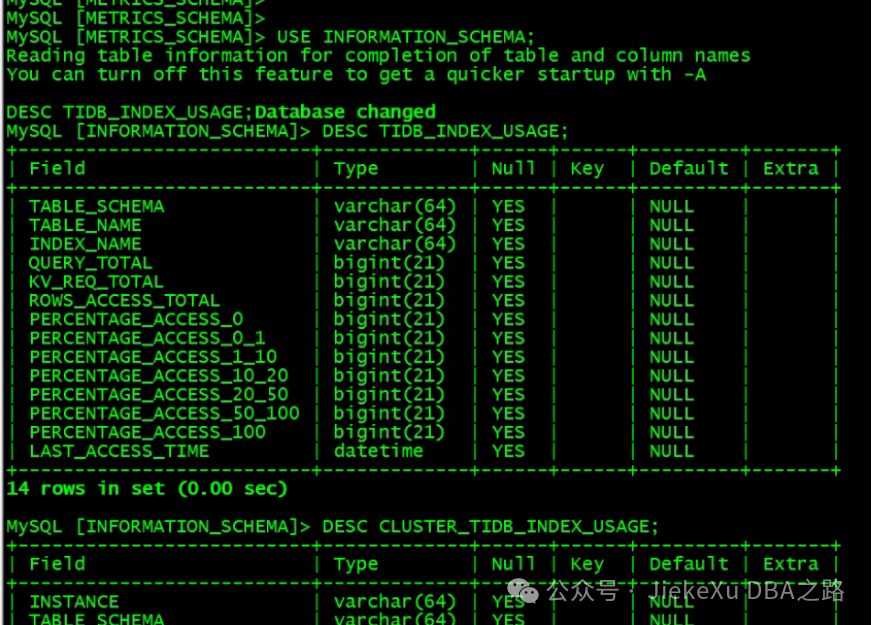
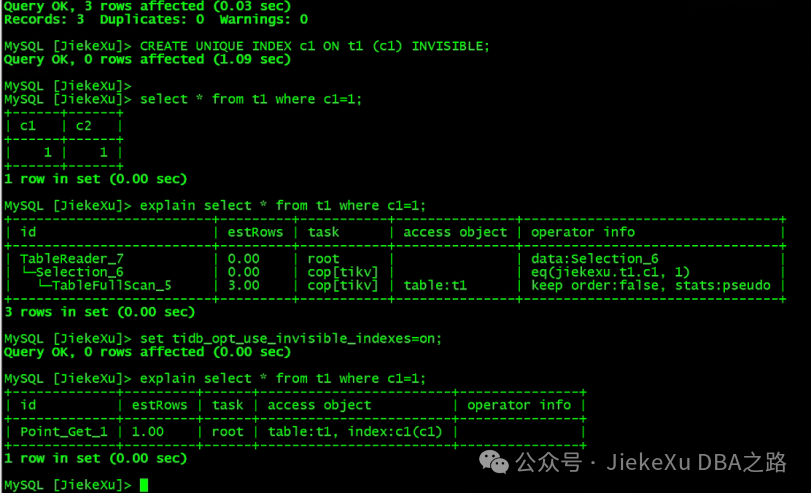
接下来就可以体验V8.0 的新特性了,比如观测索引使用情况,在会话级将不可见索引 (Invisible Indexes) 调整为可见,建表时使用更多的表达式设置列的默认值等等新特性。
默认情况下,不可见索引 (Invisible Indexes) 不会被查询优化器使用:
CREATE TABLE t1 (c1 INT, c2 INT, UNIQUE(c2));
INSERT INTO T1 VALUES(1,1),(2,2),(3,3);
CREATE UNIQUE INDEX c1 ON t1 (c1) INVISIBLE;
select * from t1 where c1=1;
explain select * from t1 where c1=1;
从 TiDB v8.0.0 开始,你可以通过修改系统变量 tidb_opt_use_invisible_indexes,默认值为 OFF,当修改变量为 ON 时,对该会话中的查询,优化器可以选择不可见索引进行查询优化。
MySQL [INFORMATION_SCHEMA]> use JiekeXu;
Database changed
MySQL [JiekeXu]> CREATE TABLE JiekeXu (blog BLOB DEFAULT (RAND()));
Query OK, 0 rows affected (0.18 sec)

MySQL [JiekeXu]>
这样,我们就可以去体验测试新特性了,由于时间关系,今天就先体验到这里吧,剩下的新特性后面有机会的话在慢慢发掘。如果觉得这个环境太占你的磁盘空间的话,那么我们也可以清理日志,甚至清理数据。
五、清除集群数据
此操作会关闭所有服务,并清空其数据目录或/和日志目录,并且无法恢复,需要谨慎操作。
清空集群所有服务的数据,但保留日志:
tiup cluster clean ${cluster-name} --data清空集群所有服务的日志,但保留数据:
tiup cluster clean ${cluster-name} --log清空集群所有服务的数据和日志:
tiup cluster clean ${cluster-name} --all清空 Prometheus 以外的所有服务的日志和数据:
tiup cluster clean ${cluster-name} --all --ignore-role prometheus清空节点 172.16.13.11:9000 以外的所有服务的日志和数据:
tiup cluster clean ${cluster-name} --all --ignore-node 172.16.13.11:9000清空部署在 172.16.13.12 以外的所有服务的日志和数据:
tiup cluster clean ${cluster-name} --all --ignore-node 172.16.13.12六、销毁集群
销毁集群操作会关闭服务,清空数据目录和部署目录,并且无法恢复,需要谨慎操作。
tiup cluster destroy ${cluster-name}七、附:2380端口占用处理办法
启动 TiKV 报错
Starting component pd
        Starting instance 192.168.75.88:2379
        Start instance 192.168.75.88:2379 success
Starting component tikv
        Starting instance 192.168.75.88:20162
        Starting instance 192.168.75.88:20160
        Starting instance 192.168.75.88:20161


Error: failed to start tikv: failed to start: 192.168.75.88 tikv-20161.service, please check the instance's log(/app/tidb-deploy/tikv-20161/log) for more detail.: timed out waiting for port 20161 to be started after 2m0s


Verbose debug logs has been written to /root/.tiup/logs/tiup-cluster-debug-2024-04-06-23-44-47.log.
** 查看 TiKV 日志**/app/tidb-deploy/tikv-20161/log,发现 Connection refused 192.168.75.88:2379,这是 PD 的端口地址,那么我们去看 PD 的启动日志吧。
[2024/04/06 23:50:49.888 +08:00] [INFO] [<unknown>] ["subchannel 0x7f5f62c56c00 {address=ipv4:192.168.75.88:2379, args=grpc.client_channel_factory=0x7f5f62c978a8, grpc.default_authority=192.168.75.88:2379, grpc.initial_reconnect_backoff_ms=1000, grpc.internal.subchannel_pool=0x7f5f62c38e50, grpc.keepalive_time_ms=10000, grpc.keepalive_timeout_ms=3000, grpc.max_receive_message_length=-1, grpc.max_reconnect_backoff_ms=5000, grpc.max_send_message_length=-1, grpc.primary_user_agent=grpc-rust/0.10.4, grpc.resource_quota=0x7f5f62cbb0e0, grpc.server_uri=dns:///192.168.75.88:2379}: connect failed: {\"created\":\"@1712418649.888694501\",\"description\":\"Failed to connect to remote host: Connection refused\",\"errno\":111,\"file\":\"/workspace/.cargo/registry/src/index.crates.io-6f17d22bba15001f/grpcio-sys-0.10.3+1.44.0-patched/grpc/src/core/lib/iomgr/tcp_client_posix.cc\",\"file_line\":200,\"os_error\":\"Connection refused\",\"syscall\":\"connect\",\"target_address\":\"ipv4:192.168.75.88:2379\"}"] [thread_id=13]
[2024/04/06 23:50:49.888 +08:00] [INFO] [<unknown>] ["subchannel 0x7f5f62c56c00 {address=ipv4:192.168.75.88:2379, args=grpc.client_channel_factory=0x7f5f62c978a8, grpc.default_authority=192.168.75.88:2379, grpc.initial_reconnect_backoff_ms=1000, grpc.internal.subchannel_pool=0x7f5f62c38e50, grpc.keepalive_time_ms=10000, grpc.keepalive_timeout_ms=3000, grpc.max_receive_message_length=-1, grpc.max_reconnect_backoff_ms=5000, grpc.max_send_message_length=-1, grpc.primary_user_agent=grpc-rust/0.10.4,grpc.resource_quota=0x7f5f62cbb0e0, grpc.server_uri=dns:///192.168.75.88:2379}: Retry in 999 milliseconds"] [thread_id=13]
[2024/04/06 23:50:49.888 +08:00] [INFO] [util.rs:601] ["PD failed to respond"] [err="Grpc(RpcFailure(RpcStatus { code: 14-UNAVAILABLE, message: \"failed to connect to all addresses\", details: [] }))"] [endpoints=192.168.75.88:2379] [thread_id=1]
[2024/04/06 23:50:49.888 +08:00] [WARN] [client.rs:169] ["validate PD endpoints failed"] [err="Other(\"[components/pd_client/src/util.rs:634]: PD cluster failed to respond\")"] [thread_id=1]
[2024/04/06 23:50:50.190 +08:00] [INFO] [util.rs:639] ["connecting to PD endpoint"] [endpoints=192.168.75.88:2379] [thread_id=1]
[2024/04/06 23:50:50.190 +08:00] [INFO] [<unknown>] ["subchannel 0x7f5f62c72800 {address=ipv4:192.168.75.88:2379, args=grpc.client_channel_factory=0x7f5f62c978a8, grpc.default_authority=192.168.75.88:2379, grpc.initial_reconnect_backoff_ms=1000, grpc.internal.subchannel_pool=0x7f5f62c38e50, grpc.keepalive_time_ms=10000, grpc.keepalive_timeout_ms=3000, grpc.max_receive_message_length=-1, grpc.max_reconnect_backoff_ms=5000, grpc.max_send_message_length=-1, grpc.primary_user_agent=grpc-rust/0.10.4,grpc.resource_quota=0x7f5f62cbb0e0, grpc.server_uri=dns:///192.168.75.88:2379}: connect failed: {\"created\":\"@1712418650.190326725\",\"description\":\"Failed to connect to remote host: Connection refused\",\"errno\":111,\"file\":\"/workspace/.cargo/registry/src/index.crates.io-6f17d22bba15001f/grpcio-sys-0.10.3+1.44.0-patched/grpc/src/core/lib/iomgr/tcp_client_posix.cc\",\"file_line\":200,\"os_error\":\"Connection refused\",\"syscall\":\"connect\",\"target_address\":\"ipv4:192.168.75.88:2379\"}"] [thread_id=13]
[2024/04/06 23:50:50.190 +08:00] [INFO] [<unknown>] ["subchannel 0x7f5f62c72800 {address=ipv4:192.168.75.88:2379, args=grpc.client_channel_factory=0x7f5f62c978a8, grpc.default_authority=192.168.75.88:2379, grpc.initial_reconnect_backoff_ms=1000, grpc.internal.subchannel_pool=0x7f5f62c38e50, grpc.keepalive_time_ms=10000, grpc.keepalive_timeout_ms=3000, grpc.max_receive_message_length=-1, grpc.max_reconnect_backoff_ms=5000, grpc.max_send_message_length=-1, grpc.primary_user_agent=grpc-rust/0.10.4,grpc.resource_quota=0x7f5f62cbb0e0, grpc.server_uri=dns:///192.168.75.88:2379}: Retry in 1000 milliseconds"] [thread_id=13]
[2024/04/06 23:50:50.190 +08:00] [INFO] [util.rs:601] ["PD failed to respond"] [err="Grpc(RpcFailure(RpcStatus { code: 14-UNAVAILABLE, message: \"failed to connect to all addresses\", details: [] }))"] [endpoints=192.168.75.88:2379] [thread_id=1]
[root@JiekeXu log]#
** PD 日志**
[root@JiekeXu log]# pwd
/app/tidb-deploy/tidb-4000/log
[root@JiekeXu log]# tail -30 pd.log
[2024/04/06 23:52:10.609 +08:00] [INFO] [registry.go:92] ["restful API service registered successfully"] [prefix=pd-192.168.75.88-2379] [service-name=ResourceManager]
[2024/04/06 23:52:10.609 +08:00] [WARN] [config.go:620] ["Running http and grpc server on single port. This is not recommended for production."]
[2024/04/06 23:52:10.609 +08:00] [INFO] [etcd.go:119] ["configuring peer listeners"] [listen-peer-urls="[http://0.0.0.0:2380]"]
[2024/04/06 23:52:10.609 +08:00] [ERROR] [etcd.go:537] ["creating peer listener failed"] [error="listen tcp 0.0.0.0:2380: bind: address already in use"]
[2024/04/06 23:52:10.609 +08:00] [INFO] [etcd.go:373] ["closing etcd server"] [name=pd-192.168.75.88-2379] [data-dir=/app/tidb-data/pd-2379] [advertise-peer-urls="[http://192.168.75.88:2380]"] [advertise-client-urls="[http://192.168.75.88:2379]"]
[2024/04/06 23:52:10.609 +08:00] [INFO] [etcd.go:377] ["closed etcd server"] [name=pd-192.168.75.88-2379] [data-dir=/app/tidb-data/pd-2379] [advertise-peer-urls="[http://192.168.75.88:2380]"] [advertise-client-urls="[http://192.168.75.88:2379]"]
[2024/04/06 23:52:10.609 +08:00] [INFO] [systimemon.go:30] ["start system time monitor"]
[2024/04/06 23:52:10.609 +08:00] [FATAL] [main.go:280] ["run server failed"] [error="[PD:etcd:ErrStartEtcd]listen tcp 0.0.0.0:2380: bind: address already in use: listen tcp 0.0.0.0:2380: bind: address already in use"] [stack="main.start\n\t/workspace/source/pd/cmd/pd-server/main.go:280\nmain.createServerWrapper\n\t/workspace/source/pd/cmd/pd-server/main.go:191\ngithub.com/spf13/cobra.(*Command).execute\n\t/root/go/pkg/mod/github.com/spf13/cobra@v1.0.0/command.go:846\ngithub.com/spf13/cobra.(*Command).ExecuteC\n\t/root/go/pkg/mod/github.com/spf13/cobra@v1.0.0/command.go:950\ngithub.com/spf13/cobra.(*Command).Execute\n\t/root/go/pkg/mod/github.com/spf13/cobra@v1.0.0/command.go:887\nmain.main\n\t/workspace/source/pd/cmd/pd-server/main.go:71\nruntime.main\n\t/usr/local/go/src/runtime/proc.go:267"]查找并杀掉占用进程[root@JiekeXu log]# isof -i:2380
bash: isof: command not found...
[root@JiekeXu log]# lsof -i:2380
COMMAND PID USER FD TYPE DEVICE SIZE/OFF NODE NAME
etcd 54500 etcd 5u IPv4 27152002 0t0 TCP 192.168.32.31:2380 (LISTEN)
etcd 54500 etcd 8u IPv4 40957112 0t0 TCP JiekeXu:59596->192.168.32.32:2380 (SYN_SENT)
etcd 54500 etcd 15u IPv4 40957110 0t0 TCP JiekeXu:49312->192.168.32.33:2380 (SYN_SENT)
etcd 54500 etcd 16u IPv4 40957111 0t0 TCP JiekeXu:59594->192.168.32.32:2380 (SYN_SENT)
[root@JiekeXu log]#
[root@JiekeXu log]# kill 54500
[root@JiekeXu log]# lsof -i:2380参考链接
https://docs.pingcap.com/zh/tidb/v8.0/release-8.0.0
https://tidb.net/blog/94c2b44c
全文完,希望可以帮到正在阅读的你,如果觉得有帮助,可以分享给你身边的朋友,同事,你关心谁就分享给谁,一起学习共同进步~~~
欢迎关注我公众号【JiekeXu DBA之路】,第一时间一起学习新知识!以下四个地址可以找到我,其他地址均属于盗版侵权爬取我的文章,而且代码格式、图片等均有错乱,不方便阅读,欢迎来我公众号或者墨天轮地址关注我,第一时间收获最新消息。
欢迎关注我的公众号【JiekeXu DBA之路】,第一时间一起学习新知识!————————————————————————————
公众号:JiekeXu DBA之路
CSDN :https://blog.csdn.net/JiekeXu
墨天轮:https://www.modb.pro/u/4347
ITPUB:https://blog.itpub.net/69968215
腾讯云:https://cloud.tencent.com/developer/user/5645107
————————————————————————————

分享几个数据库备份脚本
一文搞懂 Oracle 统计信息我的 Oracle ACE 心路历程
Oracle 主流版本不同架构下的静默安装指南关机重启导致 ASM 磁盘丢失数据库无法启动
Oracle SQL 性能分析(SPA)原理与实战演练Oracle 11g 升级到 19c 需要关注的几个问题
Windows 10 环境下 MySQL 8.0.33 安装指南
SQL 大全(四)|数据库迁移升级时常用 SQL 语句
OGG|使用 OGG19c 迁移 Oracle11g 到 19C(第二版)
Oracle 大数据量导出工具——sqluldr2 的安装与使用从国产数据库调研报告中你都能了解哪些信息及我的总结建议
使用数据泵利用 rowid 分片导出导入 lob 大表及最佳实践
在归档模式下直接 rm dbf 数据文件并重启数据库还有救吗?


 1649
1649


 被折叠的 条评论
为什么被折叠?
被折叠的 条评论
为什么被折叠?
 到【灌水乐园】发言


