


一、环境介绍
1、IP分布
| IP-主机名 | 用途 |
|---|---|
| 192.168.120.200-master1 | prometheus+minio+thanos+alertmanager+grafana |
| 192.168.120.201-master2 | prometheus+thanos+alertmanager |
| 192.168.120.203-agent | 客户端 |
2、所需软件及版本
| 软件名称 | 版本 |
|---|---|
| prometheus | prometheus-2.5.0 |
| thanos | thanos-0.17.2 |
| node_exporter | node_exporter-0.16.0 |
| alertmanager | alertmanager-0.21.0 |
| grafana | grafana-7.3.7 |
二、搭建步骤
步骤一、安装prometheus和node_exporter(master1、master2上操作)
# tar -xf prometheus-2.5.0.linux-amd64.tar.gz
# mv prometheus-2.5.0.linux-amd64 /usr/local/prometheus
# tar -xf node_exporter-0.16.0.linux-amd64.tar.gz
# mv node_exporter-0.16.0.linux-amd64 /usr/local/node_exporter
步骤二、修改prometheus配置文件(master1、master2上操作)
master1:
# cd /usr/local/prometheus
# vim prometheus.yml
# my global config
global:
  scrape_interval:     15s # Set the scrape interval to every 15 seconds. Default is every 1 minute.
  evaluation_interval: 15s # Evaluate rules every 15 seconds. The default is every 1 minute.
  # scrape_timeout is set to the global default (10s).
新增以下内容:
  external_labels:
monitor: 'monitor201'

    static_configs:
    - targets: ['192.168.120.200:19090','192.168.120.201:19090']

  - job_name: 'node'
    static_configs:
    - targets: ['192.168.120.200:9100','192.168.120.201:9100']
这里需要声明external_labels,标注你的地域。如果你是多副本运行,需要声明你的副本标识,如 0号,1,2 三个副本采集一模一样的数据,另外2个prometheus就可以同时运行,只是replica值不同而已。这里的配置和官方的 federation差不多
master2:
master2服务器的prometheus.yml的配置文件修改下
external_labels:
monitor: ‘monitor133’
其他配置与msater1一样即可
步骤三、启动prometheus和node_exporter(master1、master2上操作)
# cd /usr/local/prometheus
# nohup ./prometheus --config.file=prometheus.yml --storage.tsdb.path="/data/storage/prometheusData" --storage.tsdb.retention=2d --storage.tsdb.min-block-duration=2h --storage.tsdb.max-block-duration=2h --log.level=info --web.enable-lifecycle --web.enable-admin-api &
# cd /usr/local/node_exporter
# nohup ./node_exporter &
# ss -anplt
web.enable-lifecycle一定要开,用于热加载reload你的配置,retention保留 2天,prometheus 默认 2 小时会生成一个 block,thanos 会把这个 block 上传到对象存储
步骤四、安装Minio并使用它设置S3兼容对象存储服务器(master1上操作)
第一步:下载Minio
下载Minio二进制文件:
# wget https://dl.minio.io/server/minio/release/linux-amd64/minio
# chmod +x minio
# mv minio /usr/local/bin/
# minio  version
第二步:准备对象存储磁盘
下载Minio后,让我们准备一个我们用来存储对象的块设备,使用的路径只能是文件系统根目录中的目录
此次实验直接用/data/storage作为对象存储磁盘,不需作以下分区操作!
为了方便和可靠,我在服务器中可使用辅助磁盘:
# lsblk  | grep sdb
sdb      8:16   0    10G  0 disk
我将创建一个新分区并将此磁盘挂载到/data目录:
# parted -s -a optimal -- /dev/sdb mklabel gpt
# parted -s -a optimal -- /dev/sdb mkpart primary 0% 100%
# parted -s -- /dev/sdb align-check optimal 1
# mkfs.ext4 /dev/sdb1
# echo "/dev/sdb1 /data ext4 defaults 0 0" | sudo tee -a /etc/fstab
# mkdir /data
# mount -a
确认磁盘安装:
# df -h | grep /data
/dev/sdb1       9.8G   37M  9.3G   1% /data
第三步:启动Minio服务
使用systemd管理Minio服务
对于使用systemd init系统运行系统的人,请创建用于运行Minio服务的用户和组:
# groupadd --system minio
# useradd -s /sbin/nologin --system -g minio minio

为/data/storage目录提供minio用户所有权:
# chown -R minio:minio /data/

为Minio创建systemd服务单元文件:
# vim /etc/systemd/system/minio.service
将以下内容添加到文件中:
[Unit]
Description=Minio
Documentation=https://docs.minio.io
Wants=network-online.target
After=network-online.target
AssertFileIsExecutable=/usr/local/bin/minio
[Service]
WorkingDirectory=/data
User=minio
Group=minio
EnvironmentFile=-/etc/default/minio
ExecStartPre=/bin/bash -c "if [ -z \"${MINIO_VOLUMES}\" ]; then echo \"Variable MINIO_VOLUMES not set in /etc/default/minio\"; exit 1; fi"
ExecStart=/usr/local/bin/minio server $MINIO_OPTS $MINIO_VOLUMES
# Let systemd restart this service always
Restart=always
# Specifies the maximum file descriptor number that can be opened by this process
LimitNOFILE=65536
# Disable timeout logic and wait until process is stopped
TimeoutStopSec=infinity
SendSIGKILL=no
[Install]
WantedBy=multi-user.target

创建Minio环境文件/etc/default/minio:
# mkdir -p /etc/default/
# vim /etc/default/minio
# Volume to be used for Minio server.
MINIO_VOLUMES="/data/storage"
# Use if you want to run Minio on a custom port.
MINIO_OPTS="--address :9000"
# Access Key of the server.
MINIO_ACCESS_KEY=BKIKJAA5BMMU2RHO6IBB         #长度至少为3个字符的访问密钥
# Secret key of the server.
MINIO_SECRET_KEY=V7f1CwQqAcwo80UEIJEjQ9GSrr12          #最少8个字符的密钥

重新加载systemd并启动minio服务:
# systemctl daemon-reload
# systemctl start minio
第四步:访问Minio Web界面
192.168.120.200:9000
MINIO_ACCESS_KEY=BKIKJAA5BMMU2RHO6IBB
MINIO_SECRET_KEY=V7f1CwQqAcwo80UEIJEjQ9GSrr12

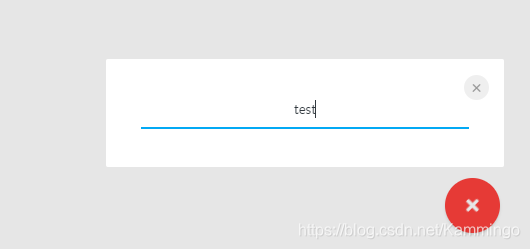
单击右下角的“+”按钮从UI创建测试存储

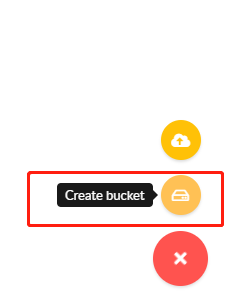
提供存储名称并按回车键
第五步:使用mc客户端测试Minio
mc提供了UNIX命令的现代替代方案,如ls、cat、cp、mirror、diff等,将mc下载到Linux:
# wget https://dl.minio.io/client/mc/release/linux-amd64/mc
# chmod +x mc
# mv mc /usr/local/bin
# mc --help
设置自动完成:
# wget https://raw.githubusercontent.com/minio/mc/master/autocomplete/bash_autocomplete
# mv bash_autocomplete /etc/bash_completion.d/mc
source /etc/bash_completion.d/mc
并享受标签完成功能:
# mc <TAB>
为Minio配置mc:
mc config host add <ALIAS> <YOUR-S3-ENDPOINT> <YOUR-ACCESS-KEY> <YOUR-SECRET-KEY> <API-SIGNATURE>
比如:
# mc config host add minio http://192.168.120.200 BKIKJAA5BMMU2RHO6IBB V7f1CwQqAcwo80UEIJEjQ9GSrr12 --api S3v4
步骤五、启动thanos组件(master1、master2上操作)
安装thanos
# tar -xf thanos-0.17.2.linux-amd64.tar.gz
# mv thanos-0.17.2.linux-amd64 /usr/local/thanos
编写Bucket 配置文件
# cd /usr/local/thanos
# vim bucket_config.yaml
type: s3
config:
  bucket: allprodata
  endpoint: 10.153.167.6:9000
  access_key: BKIKJAA5BMMU2RHO6IBB
  secret_key: V7f1CwQqAcwo80UEIJEjQ9GSrr12
  insecure: true
启动sidecar:
nohup ./thanos sidecar --tsdb.path "/data/storage/prometheusData" --prometheus.url "http://localhost:9090" --http-address 0.0.0.0:19191 --grpc-address 0.0.0.0:19091 --objstore.config-file bucket_config.yaml --shipper.upload-compacted &
启动成功后 Sidecar 组件就会向 S3 发送所有的本地数据以及新在 Prometheus 中落盘的数据
压缩:官方文档有提到,使用sidecar时,需要将 prometheus 的–storage.tsdb.min-block-duration 和 --storage.tsdb.max-block-duration,这两个值设置为2h,两个参数相等才能保证prometheus关闭了本地压缩,其实这两个参数在 prometheus -help 中并没有体现,prometheus 作者也说明这只是为了开发测试才用的参数,不建议用户修改。而 thanos 要求关闭压缩是因为 prometheus 默认会以2,25,25*5的周期进行压缩,如果不关闭,可能会导致 thanos 刚要上传一个 block,这个 block 却被压缩中,导致上传失败。
不过你也不必担心,因为在 sidecar 启动时,会坚持这两个参数,如果不合适,sidecar会启动失败
启动 Store:
在sidecar 配置中,如果你配置了对象存储objstore.config-file,你的数据就会定时上传到bucket 中,本地只留 2 小时,那么要想查询 2 小时前的数据怎么办呢?数据不被 prometheus 控制了,应该如何从 bucket 中拿回来,并提供一模一样的查询呢?
Store gateway 组件:Store gateway 主要与对象存储交互,从对象存储获取已经持久化的数据。与sidecar一样,Store gateway也实现了store api,query 组可以从 store gateway 查询历史数据
# nohup ./thanos store --data-dir /data/storage/thanos/store --objstore.config-file bucket_config.yaml --http-address 0.0.0.0:39191 --grpc-address 0.0.0.0:39090 &
启动query:
nohup ./thanos query --http-address "0.0.0.0:29090" --grpc-address "0.0.0.0:29091" --query.replica-label "monitor" --store "192.168.120.200:19091" --store "192.168.120.201:19091" --store "192.168.120.200:39090" --store "192.168.120.201:39090" &
启动 Compact:
# nohup ./thanos compact --data-dir /data/storage/thanos/compact --http-address 0.0.0.0:19192 --objstore.config-file bucket_config.yaml &
至此 Thanos 已经搭建完成!
当nohup.out日志显示adding new store to query storeset即表示query已经成功连上sidecar
# tail -f /usr/local/thanos/nohup.out
level=info ts=2021-01-28T07:30:21.245826938Z caller=storeset.go:387 component=storeset msg="adding new storeAPI to query storeset" address=192.168.120.201:19091 extLset="{monitor=\"monitor201\"}"
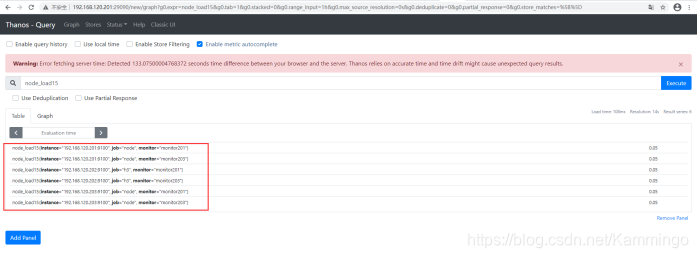
访问query,192.168.120.200:29090
验证数据情况:
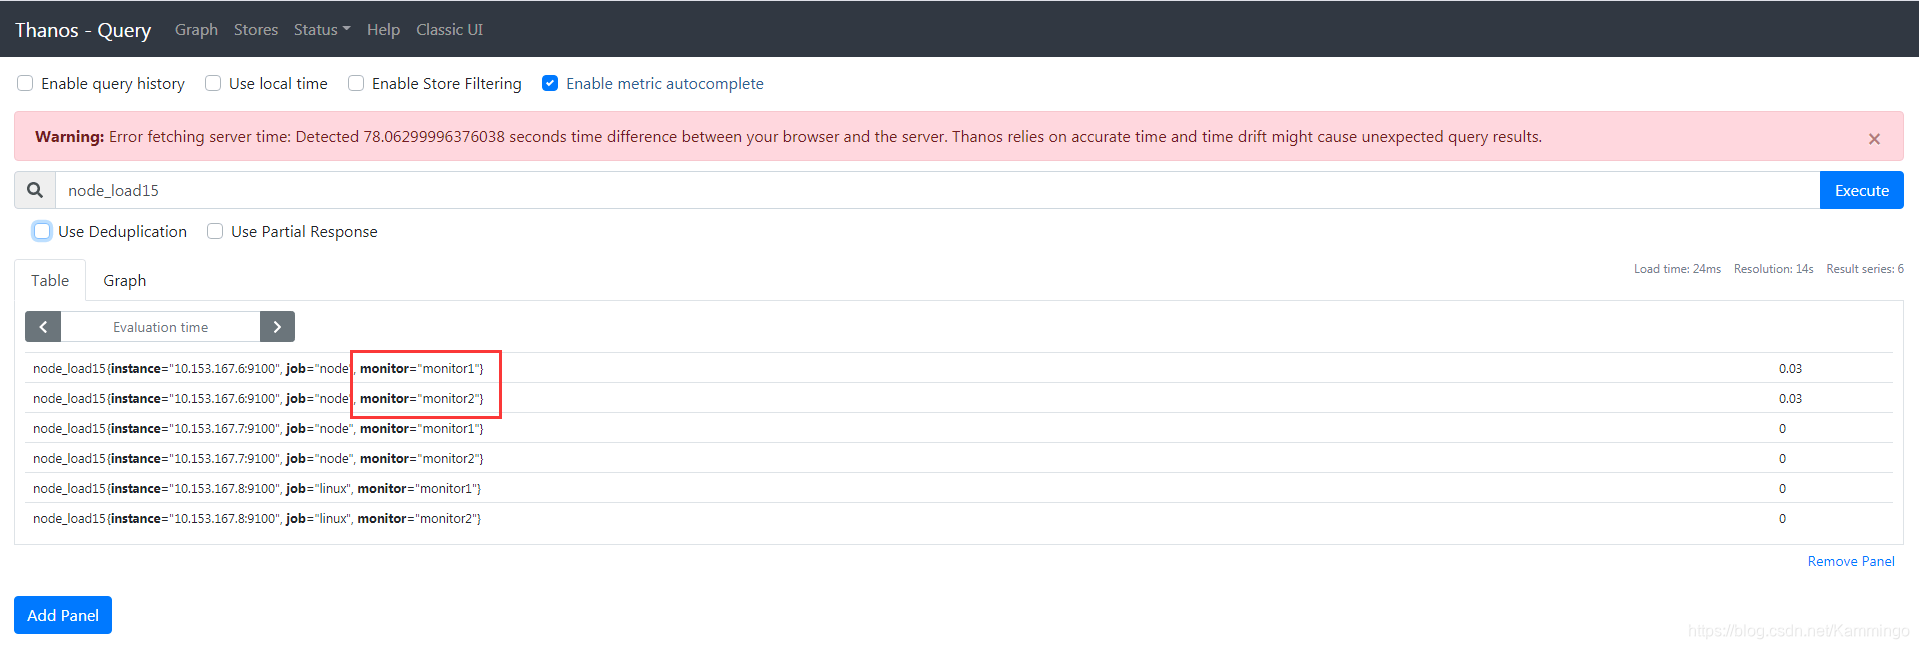
在 store 中可以看到 thanos 集群中接入的 Store 和 Sidecar,并且可以看到目前在 thanos 集群中保留监控数据的最大和最小时间等信息。
启动 Bucket web:
# nohup ./thanos bucket web --http-address=0.0.0.0:19194 --objstore.config-file bucket_config.yaml &
此处会出现报错,未解决:expected command but got “bucket”
thanos: error: expected command but got “bucket”
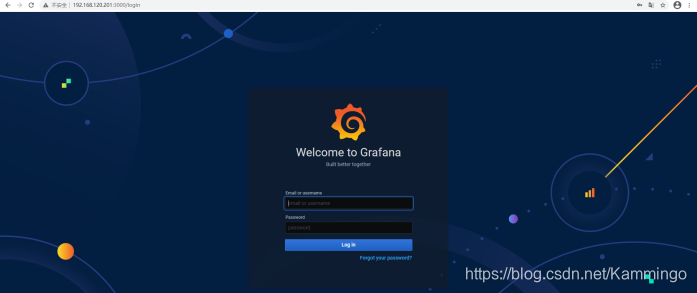
步骤六、安装grafana
# yum -y install grafana-7.3.7-1.x86_64.rpm
# systemctl start grafana-server
# ss -anptl
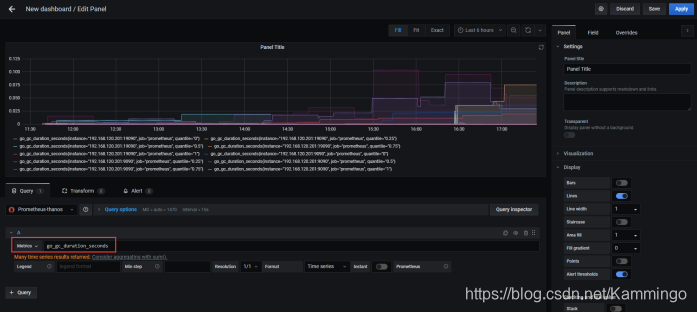
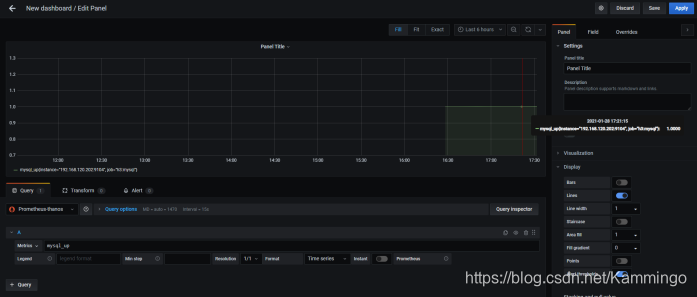
步骤七、添加thanos数据源
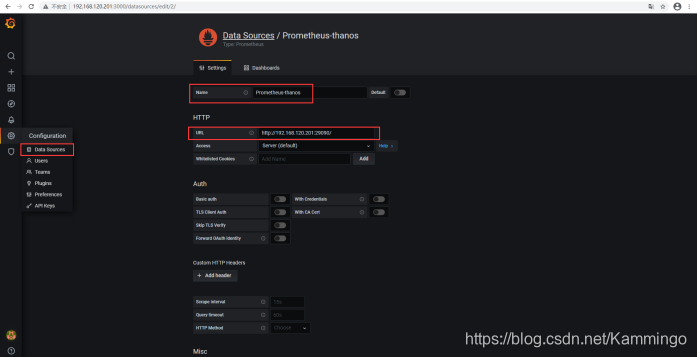
验证有数据:
步骤八、客户端部署
1、添加Linux监控
master操作:
修改prometheus.yml,添加以下内容:
  - job_name: 'h3'
    static_configs:
- targets: ['192.168.120.203:9100']
重启prometheus
agent操作:
# tar -xf node_exporter-0.16.0.linux-amd64.tar.gz
# mv node_exporter-0.16.0.linux-amd64 /usr/local/node_exporter
# cd /usr/local/node_exporter
# nohup ./node_exporter &
# ss -anplt
验证数据:
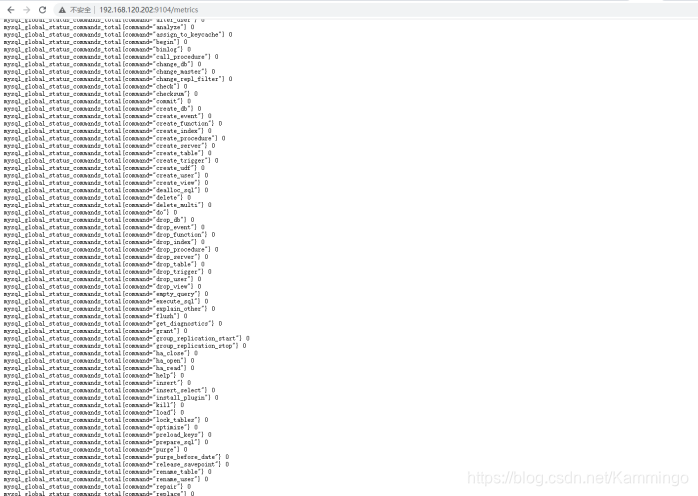
2、添加mysql监控
首先需要增加授权
mysql> GRANT PROCESS, REPLICATION CLIENT, SELECT ON *.* TO 'exporter'@'localhost' IDENTIFIED BY 'exporter123' WITH MAX_USER_CONNECTIONS 3;
mysql> flush privileges;
安装mysqld_exporter
# tar -xf mysqld_exporter-0.12.1.linux-amd64.tar.gz
# mv mysqld_exporter-0.12.1.linux-amd64 /usr/local/mysqld_exporter
修改启动参数
# vim /usr/lib/systemd/system/mysqld_exporter.service
[Unit]
Description=mysqld_exporter
After=network.target
[Service]
Type=simple
User=mysql
Environment=DATA_SOURCE_NAME=exporter:exporter123@(localhost:3306)/
ExecStart=/usr/local/mysqld_exporter/mysqld_exporter --web.listen-address=0.0.0.0:9104
  --config.my-cnf /etc/my.cnf \
  --collect.slave_status \
  --collect.slave_hosts \
  --log.level=error \
  --collect.info_schema.processlist \
  --collect.info_schema.innodb_metrics \
  --collect.info_schema.innodb_tablespaces \
  --collect.info_schema.innodb_cmp \
  --collect.info_schema.innodb_cmpmem
Restart=on-failure
[Install]
WantedBy=multi-user.targe
启动exporter
# chown -R root:root /usr/lib/systemd/system/mysqld_exporter.service
# chmod 644 /usr/lib/systemd/system/mysqld_exporter.service
# systemctl daemon-reload
# systemctl start mysqld_exporter.service
# ss -anptl
验证数据:
步骤九、安装alertmanager(可以单台,我这里是集群master1、2均操作)
官网下载alertmanager-0.21.0.linux-amd64.tar.gz
# tar -xf alertmanager-0.21.0.linux-amd64.tar.gz
# mv alertmanager-0.21.0.linux-amd64 /usr/local/alertmanager
步骤十、修改alertmanager配置文件
1、qq邮箱通知
# cd /usr/local/alertmanager
# vim alertmanager.yml
global:
  resolve_timeout: 5m
  smtp_smarthost: 'smtp.qq.com:465'
  smtp_from: 'xxx@qq.com' # 用于发送告警右键的邮箱
  smtp_auth_username: 'xxx@qq.com'
  smtp_auth_password: 'xxx'    #此处为邮箱的授权密码,非邮箱登录密码
  smtp_require_tls: false

route:  # 设置报警分发策略
  group_by: ['alertname'] # 分组标签
  group_wait: 10s      # 告警等待时间。告警产生后等待10s,如果有同组告警一起发出
  group_interval: 10s  # 两组告警的间隔时间
  repeat_interval: 1m  # 重复告警的间隔时间,减少相同右键的发送频率 此处为测试设置为1分钟
  receiver: 'mail'  # 默认接收者
  routes: # 指定那些组可以接收消息
  - receiver: mail

receivers:
- name: 'mail'
  email_configs:
  - to: 'xxx@qq.com' # 接收报警邮件的邮箱
inhibit_rules:
  - source_match:
      severity: 'critical'
    target_match:
      severity: 'warning'
    equal: ['alertname', 'dev', 'instance']
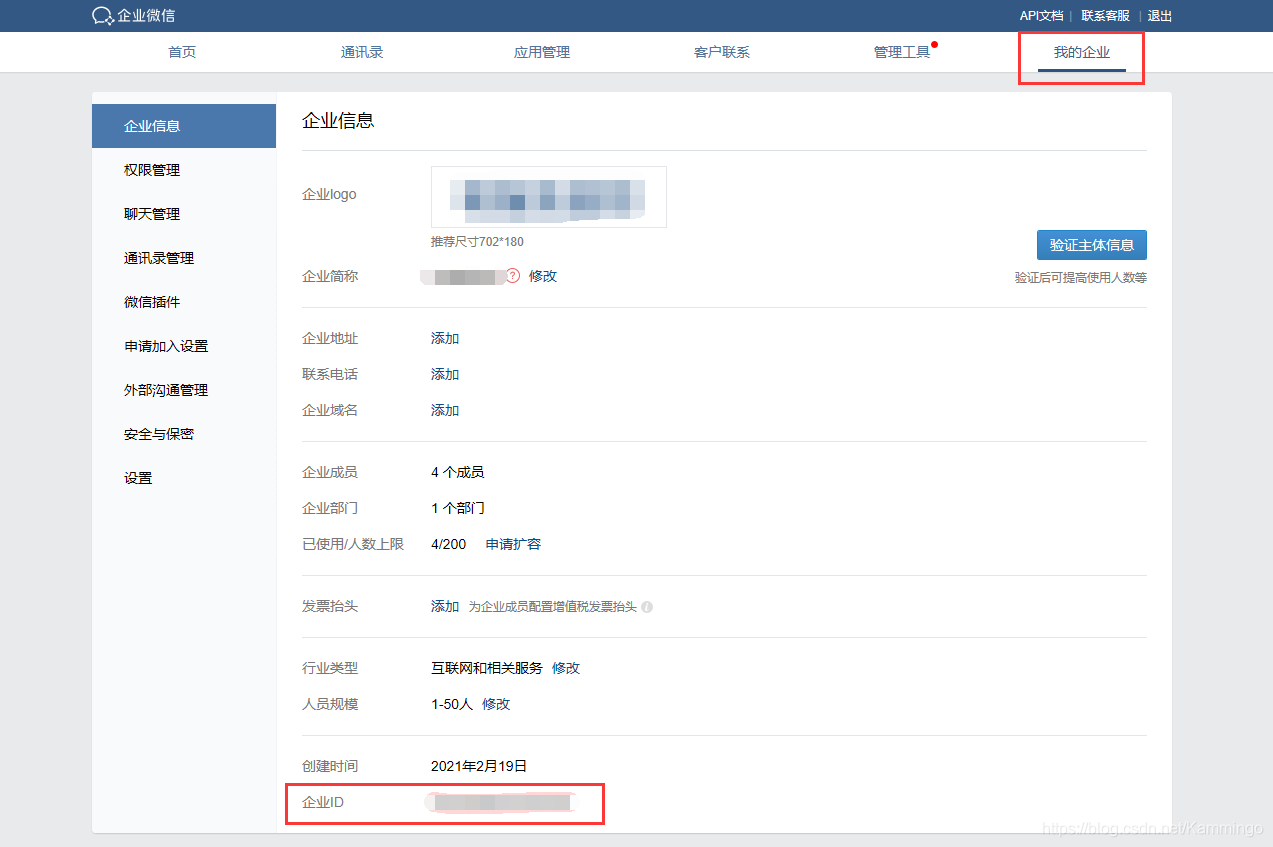
2、企业微信通知
(1)企业ID获取
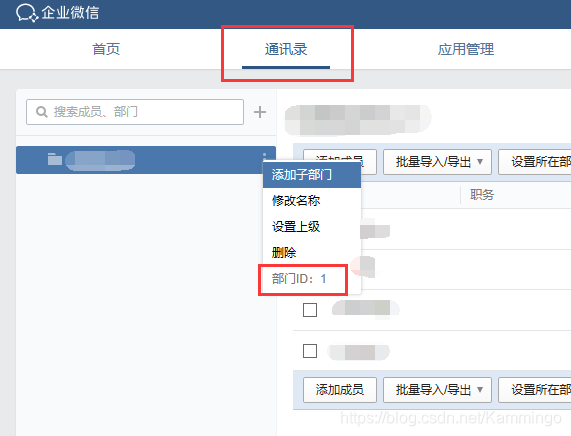
(2)部门ID获取
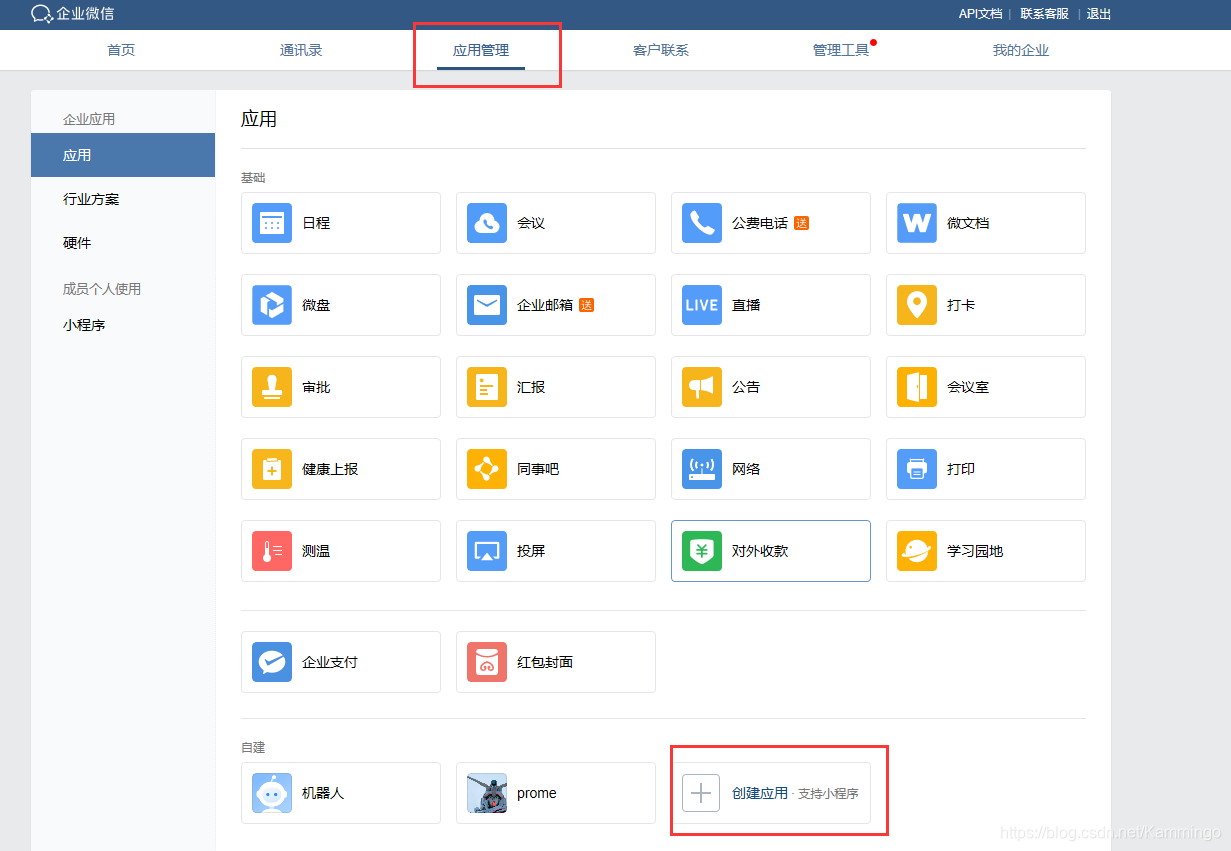
(3)告警AgentId和Secret获取
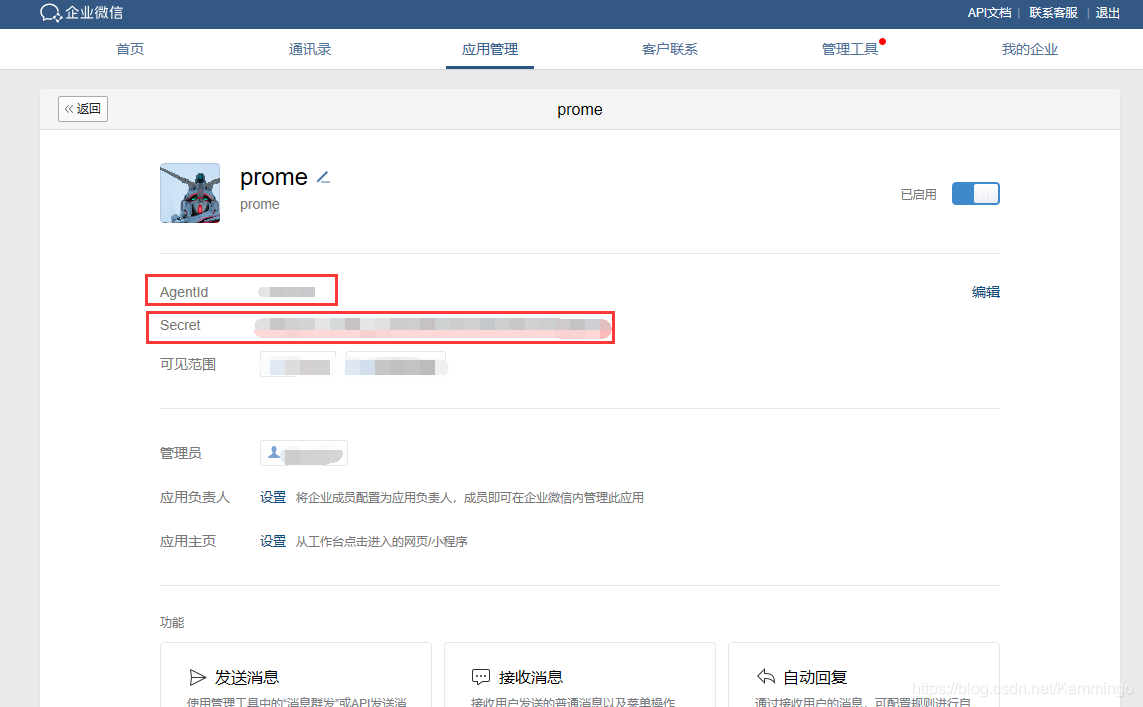
(3)配置文件修改
# cd /usr/local/alertmanager
# vim alertmanager.yml
global:
  resolve_timeout: 1m   # 每1分钟检测一次是否恢复
  wechat_api_url: 'https://qyapi.weixin.qq.com/cgi-bin/'
  wechat_api_corp_id: 'bbbbbbbbbbbbbbbb'      # 企业微信中企业ID
  wechat_api_secret: 'xxxxxxxxxxxxxxxxxxxxxxxxxxxxxxxxx'      # 企业微信中,应用的Secret

templates:
  - '/usr/local/alertmanager/config/*.tmpl'

route:
  receiver: 'wechat'
  group_by: ['env','instance','type','group','job','alertname']
  group_wait: 10s       # 初次发送告警延时
  group_interval: 10s   # 距离第一次发送告警,等待多久再次发送告警
  repeat_interval: 5m   # 告警重发时间

receivers:
- name: 'wechat'
  wechat_configs:
  - send_resolved: true
    message: '{{ template "wechat.default.message" . }}'
    to_party: '2'         # 企业微信中创建的接收告警的部门【告警机器人】的部门ID
    agent_id: '1000002'     # 企业微信中创建的应用的ID
    api_secret: 'xxxxxxxxxxxxxxxxxxxxxxxxxxxxxxxxx'      # 企业微信中,应用的Secret
# mkdir /usr/local/alertmanager/config
# cd /usr/local/alertmanager/config
# vim wechat.tmpl
{{ define "wechat.default.message" }}
{{- if gt (len .Alerts.Firing) 0 -}}
{{- range $index, $alert := .Alerts -}}
{{- if eq $index 0 }}
========= 监控报警 =========
告警状态:{{   .Status }}
告警级别:{{ .Labels.severity }}
告警类型:{{ $alert.Labels.alertname }}
故障主机: {{ $alert.Labels.instance }}
告警主题: {{ $alert.Annotations.summary }}
告警详情: {{ $alert.Annotations.message }}{{ $alert.Annotations.description}};
触发阀值:{{ .Annotations.value }}
故障时间: {{ ($alert.StartsAt.Add 28800e9).Format "2006-01-02 15:04:05" }}
========= = end =  =========
{{- end }}
{{- end }}
{{- end }}
{{- if gt (len .Alerts.Resolved) 0 -}}
{{- range $index, $alert := .Alerts -}}
{{- if eq $index 0 }}
========= 异常恢复 =========
告警类型:{{ .Labels.alertname }}
告警状态:{{   .Status }}
告警主题: {{ $alert.Annotations.summary }}
告警详情: {{ $alert.Annotations.message }}{{ $alert.Annotations.description}};
故障时间: {{ ($alert.StartsAt.Add 28800e9).Format "2006-01-02 15:04:05" }}
恢复时间: {{ ($alert.EndsAt.Add 28800e9).Format "2006-01-02 15:04:05" }}
{{- if gt (len $alert.Labels.instance) 0 }}
实例信息: {{ $alert.Labels.instance }}
{{- end }}
========= = end =  =========
{{- end }}
{{- end }}
{{- end }}
{{- end }}
3、webhook配置
(1)修改配置文件
# vim alertmanager.yml
global:
  resolve_timeout: 5m

route:
  group_by: ['alertname']
  group_wait: 10s
  group_interval: 10s
  repeat_interval: 1h
  receiver: 'web.hook'
receivers:
- name: 'web.hook'
  webhook_configs:
  - url: 'http://127.0.0.1:5001/'
inhibit_rules:
  - source_match:
      severity: 'critical'
    target_match:
      severity: 'warning'
    equal: ['alertname', 'dev', 'instance']
(2)本地webhook服务可以直接从Github获取
前提:有安装go
# go version
go version go1.15.5 linux/amd64
# cat /etc/profile
#golang env config
export GO111MODULE=on
export GOROOT=/usr/local/go
export GOPATH=/home/gopath
export PATH=$PATH:$GOROOT/bin:$GOPATH/bin
方式一:
获取alertmanager提供的webhook示例,如果该目录下定义了main函数,go get会自动将其编译成可执行文件
# go get github.com/prometheus/alertmanager/examples/webhook
设置环境变量指向GOPATH的bin目录
# export PATH=$GOPATH/bin:$PATH
启动服务
# webhook &
# ss -anplt | grep 5001
方式二:
解压pkg.tar.gz
# tar -xf pkg.tar.gz
移到gopath
# mv pkg /home/gopath
编译成可执行程序
# cd /home/gopath/pkg/mod/github.com/prometheus/alertmanager@v0.21.0/examples/webhook
# go build
启动webhook
# nohup ./webhook --log.level=debug 2>&1 > webhook.log &
# ss -anplt | grep 5001
步骤十一、修改prometheus配置文件
# vim /usr/local/prometheus/prometheus.yml
# Alertmanager configuration
alerting:
  alertmanagers:
  - static_configs:
    - targets:
        - 192.168.120.200:9093
        - 192.168.120.201:9093

# Load rules once and periodically evaluate them according to the global 'evaluation_interval'.
rule_files:
    - "rules/*.yml"
  # - "first_rules.yml"
  # - "second_rules.yml"
步骤十二、编写告警规则
# mkdir /usr/local/prometheus/rules
# vim node.yml
groups:
- name: node-up    # 分组名称
  rules:           # 规则设置
  - alert: node-up  #告警名称
    expr: up{job="h3"} == 0    # 表达式,查询式语句查询up的值是否等于0,如果等于则告警
    for: 15s    # 告警持续时间
    labels:
      severity: 1
      team: node
    annotations:    # 注解
      summary: "{{ $labels.instance }} 已停止运行超过 15s!"
步骤十三、启动服务
重启prometheus服务,或者curl -XPOST 192.168.120.200:9090/-/reload重新加载
启动alertmanager服务
# cd /usr/local/alertmanager
master1:
# nohup ./alertmanager  --web.listen-address=":9093" --cluster.listen-address="192.168.120.200:8001" --config.file=/usr/local/alertmanager/alertmanager.yml  --storage.path=/data/alertmanager/ &
master2:
# nohup ./alertmanager  --web.listen-address=":9093" --cluster.listen-address="192.168.120.201:8001" --cluster.peer=192.168.120.200:8001 --config.file=/usr/local/alertmanager/alertmanager.yml  --storage.path=/data/alertmanager2/ &
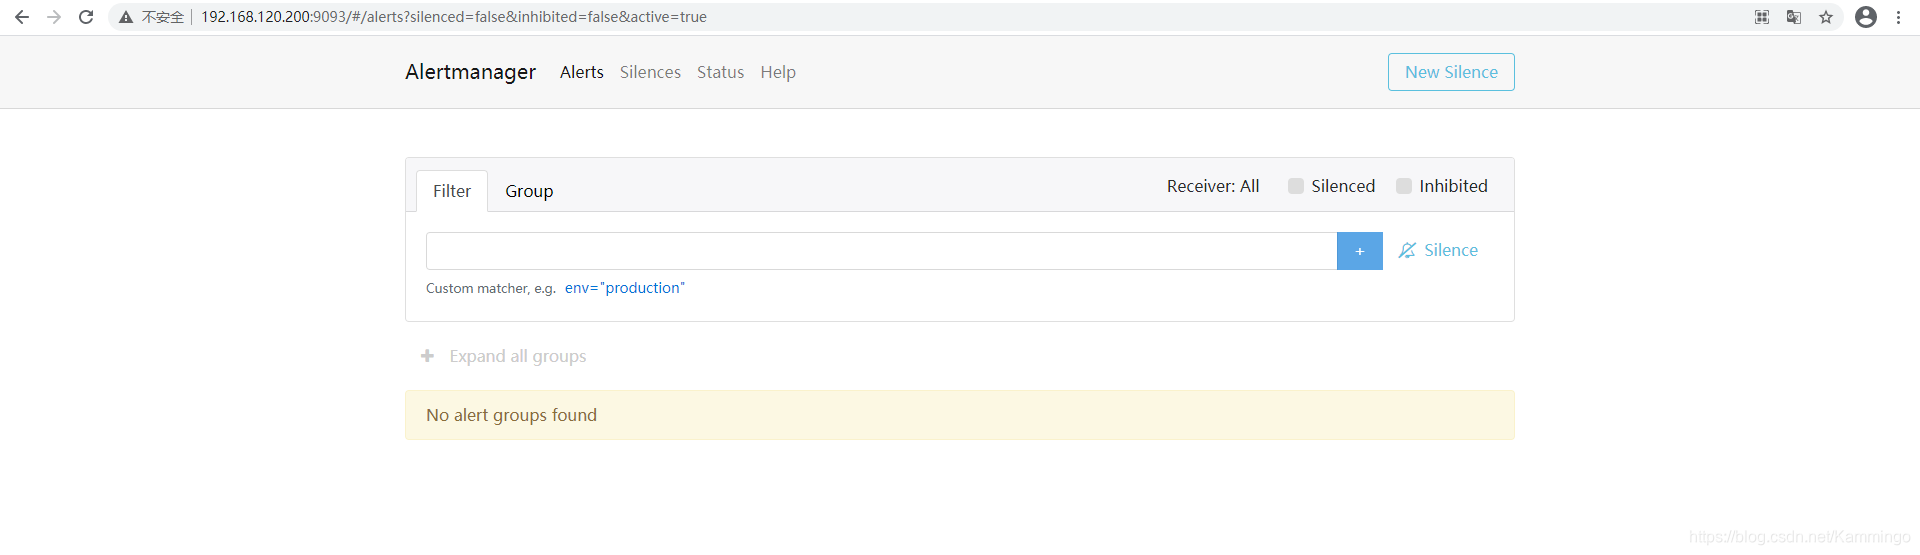
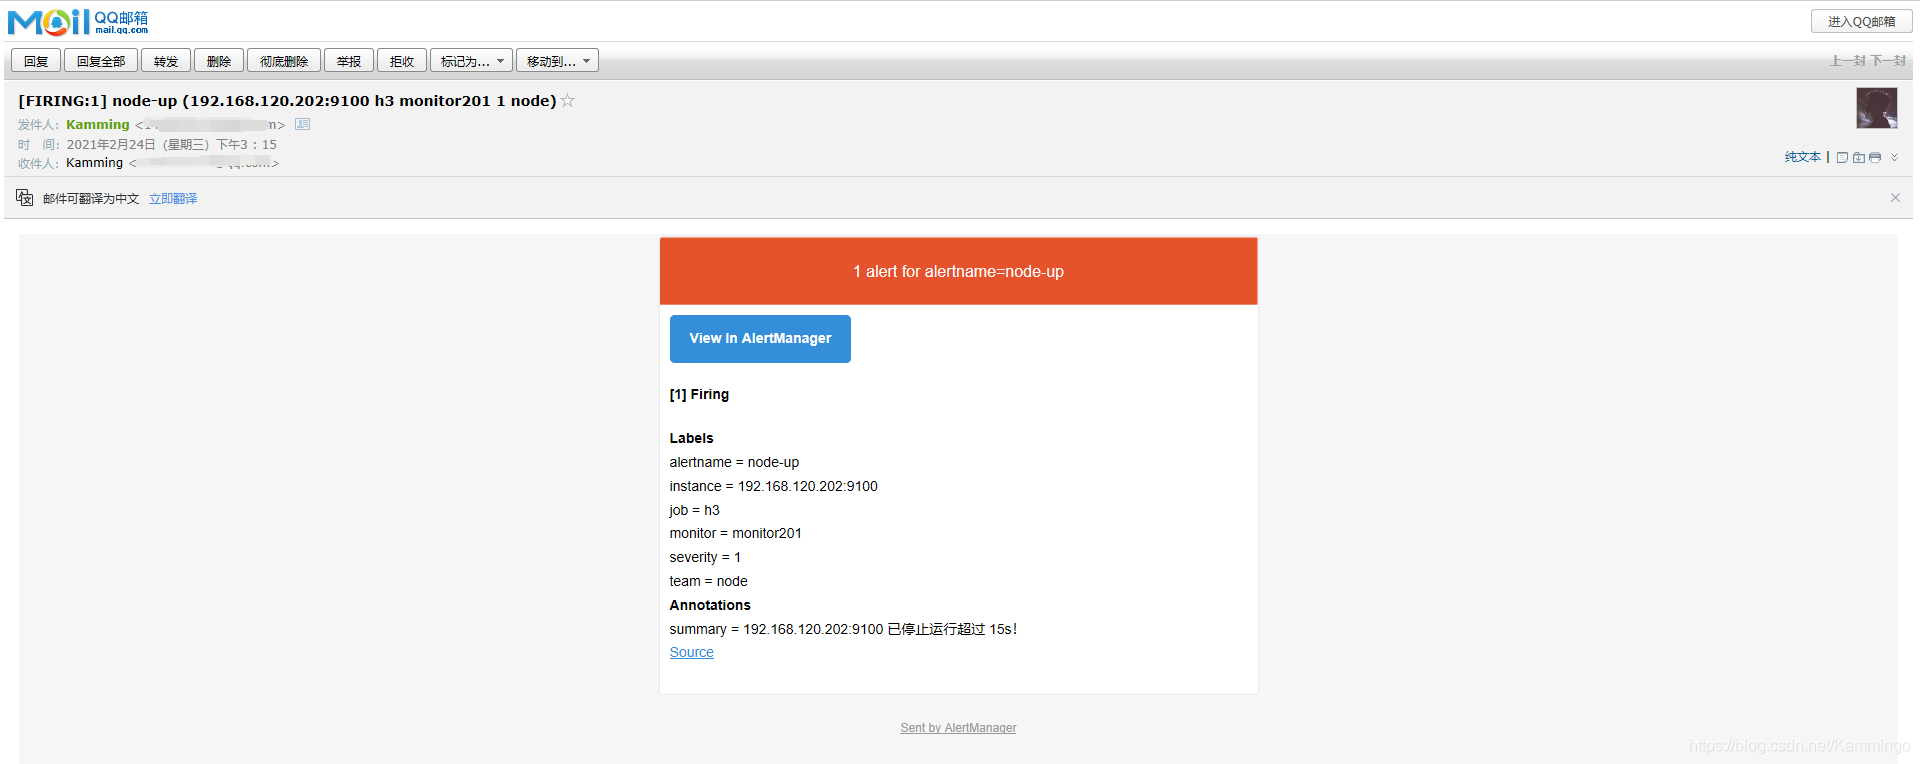
步骤十四、验证
浏览器访问:http://192.168.120.200:9093/
客户端192.168.120.203关闭node_exporter
# ps -ef | grep node
root      17982   2316  0 15:02 pts/0    00:00:01 ./node_exporter
root      18582   2316  0 15:14 pts/0    00:00:00 grep --color=auto node
# kill 17982
[1]+  已终止               nohup ./node_exporter
邮箱报警成功!
企业微信报警成功!
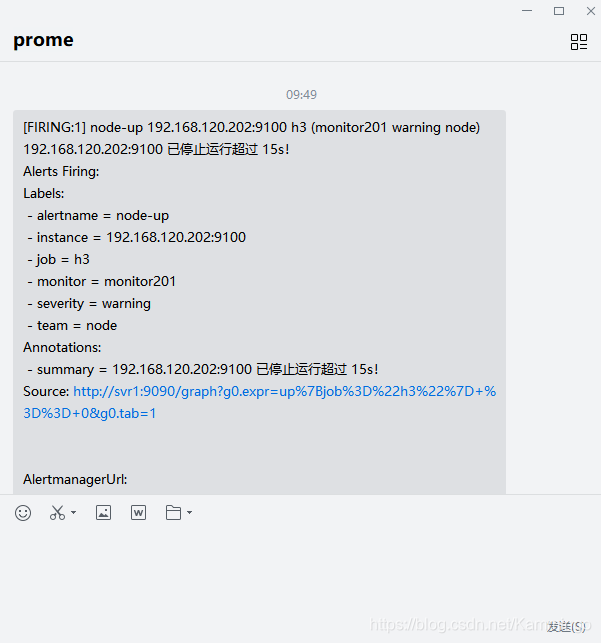
查看推送情况
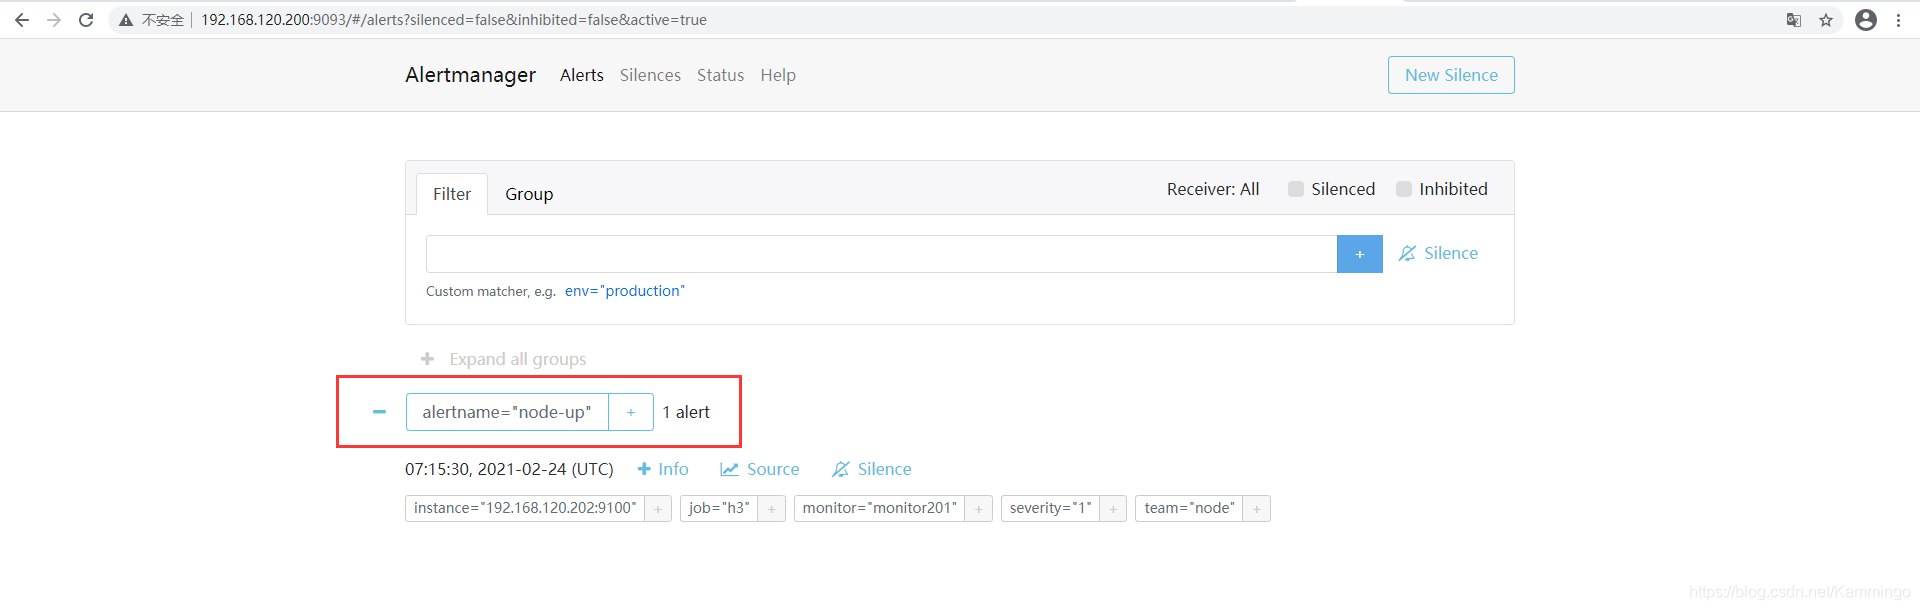
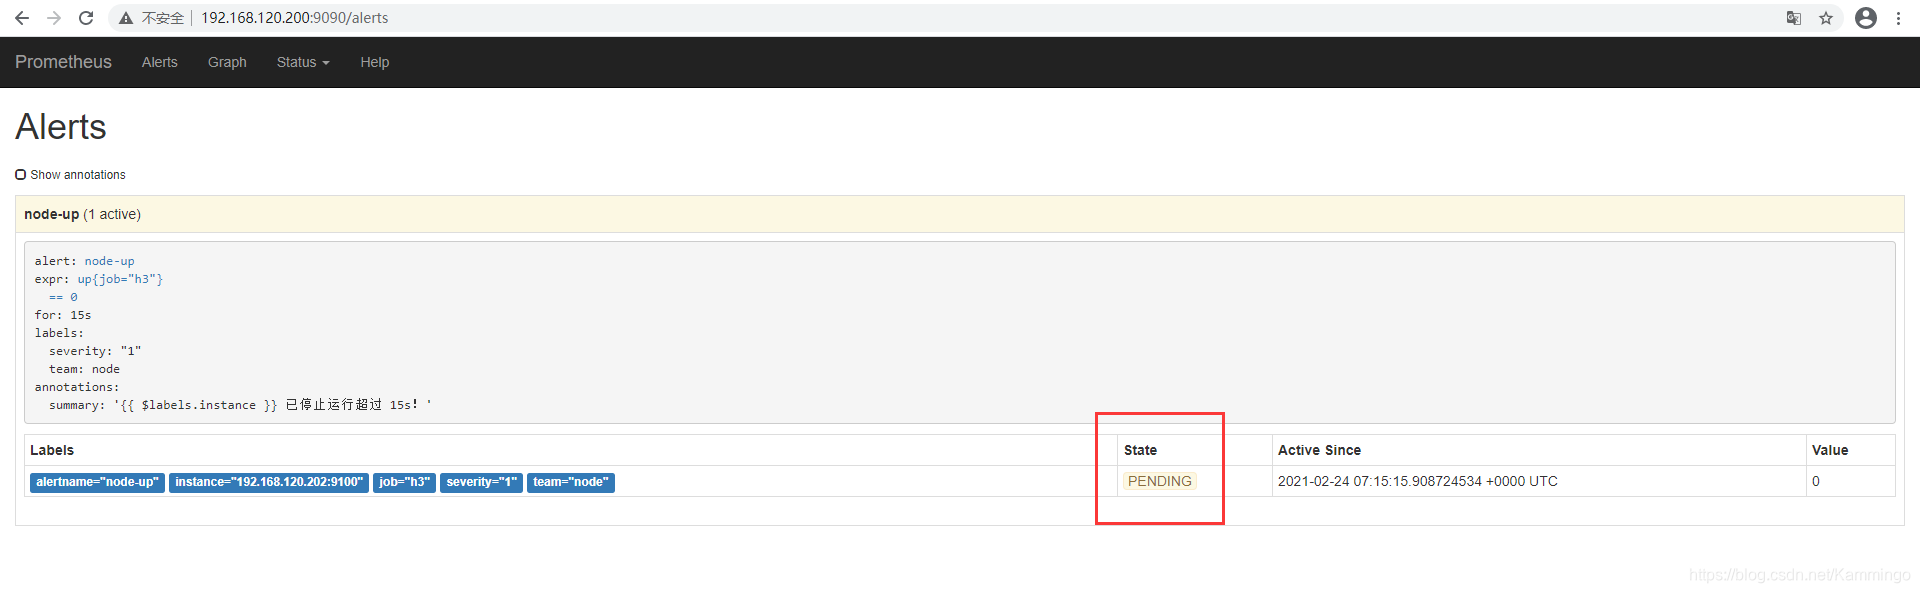
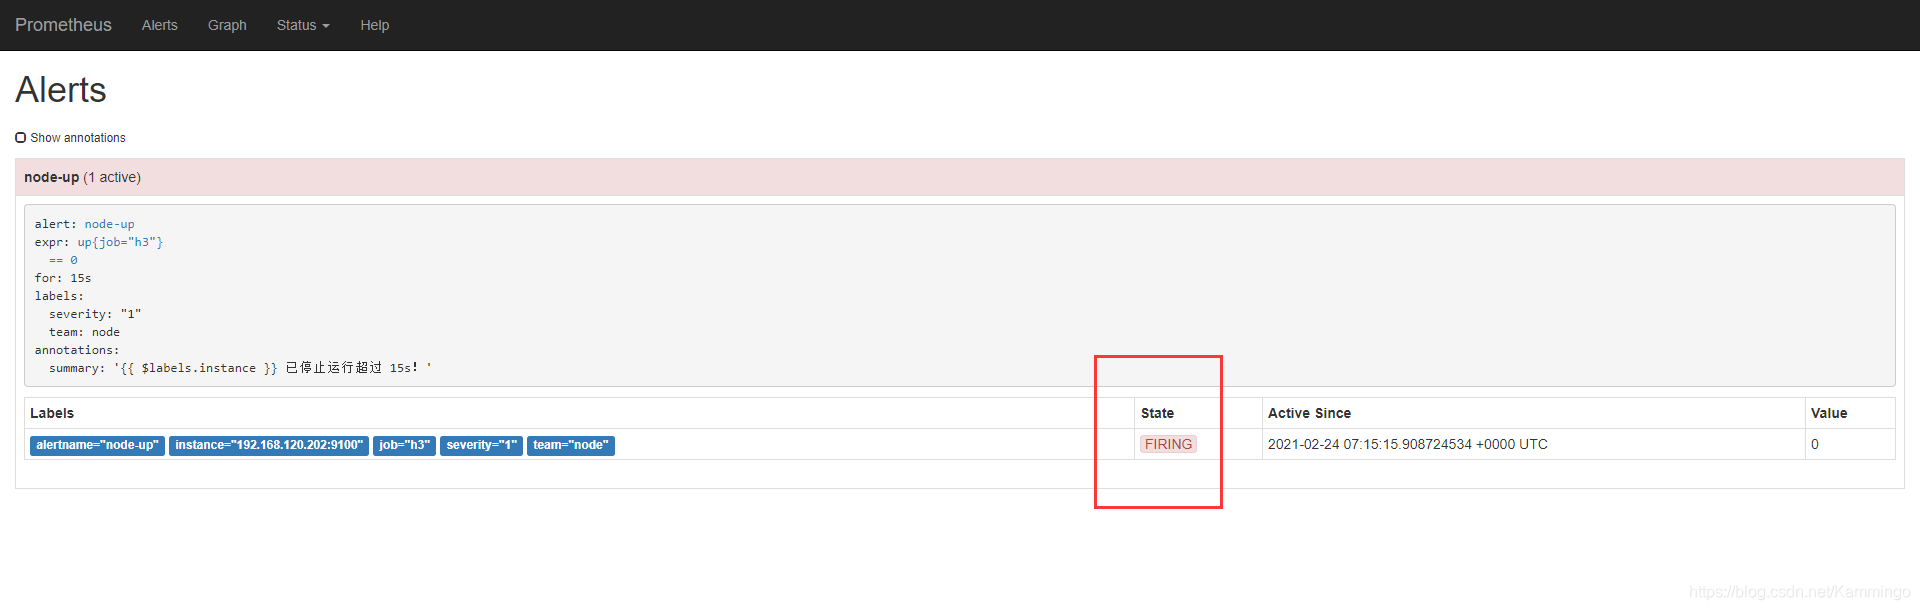
报警状态
inactive-已收到报警
pending-已经触发报警阈值,但未满足告警持续时间 #/usr/local/prometheus/rules/unreachable.yml 中设置的for时间
firing-已触发阈值,且满足报警持续时间,将报警发送给报警接收者
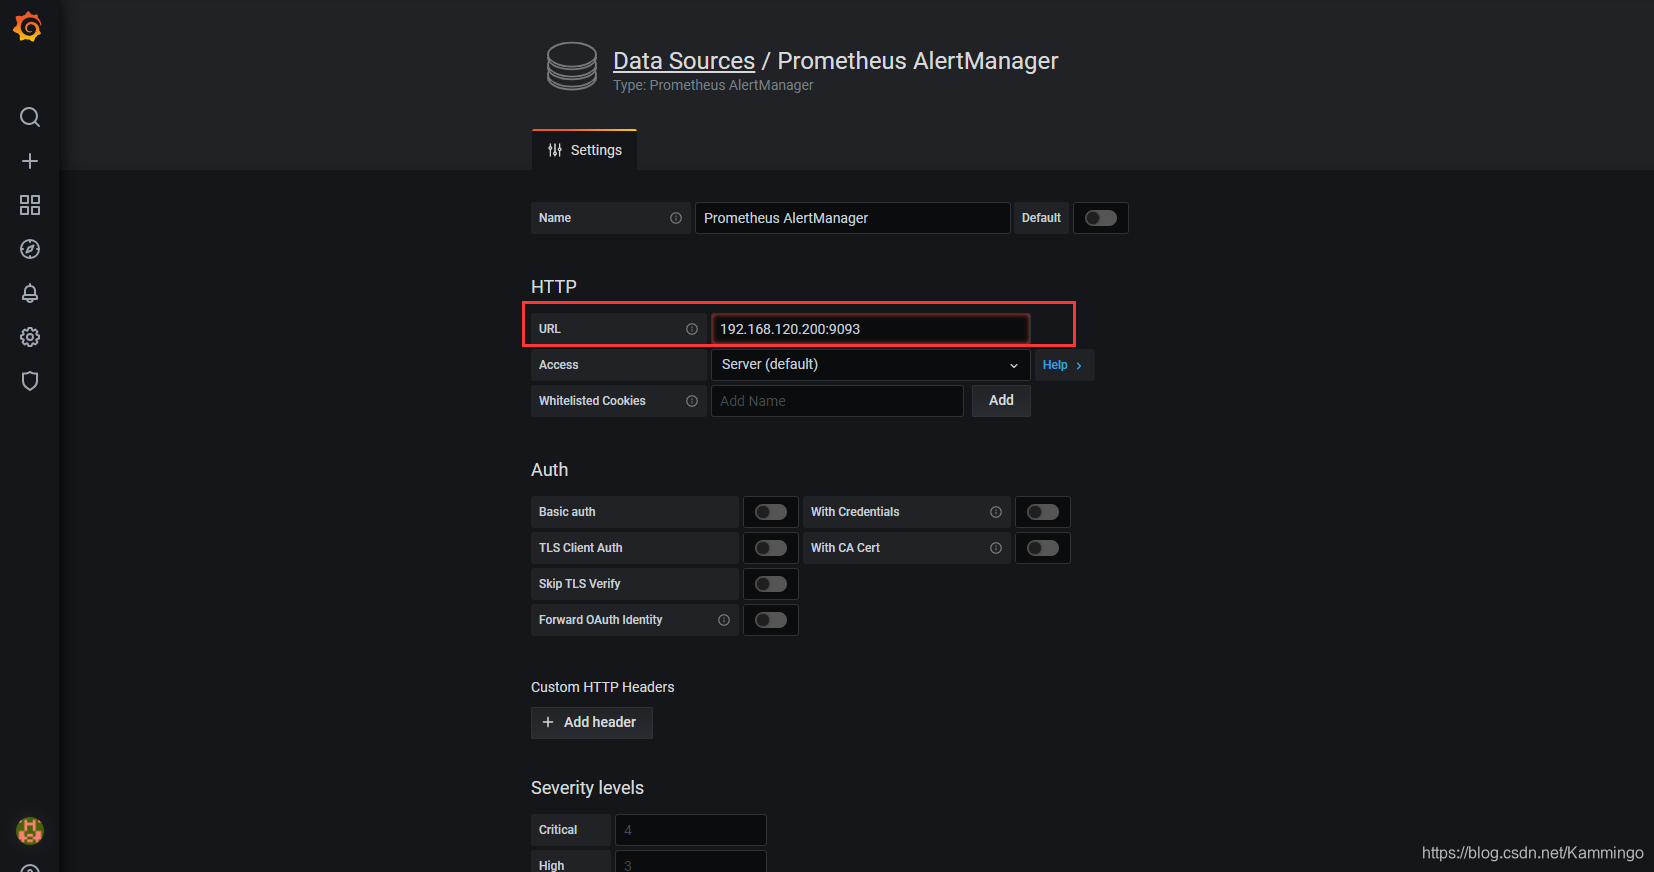
步骤十五、Grafana展示AlertManager告警
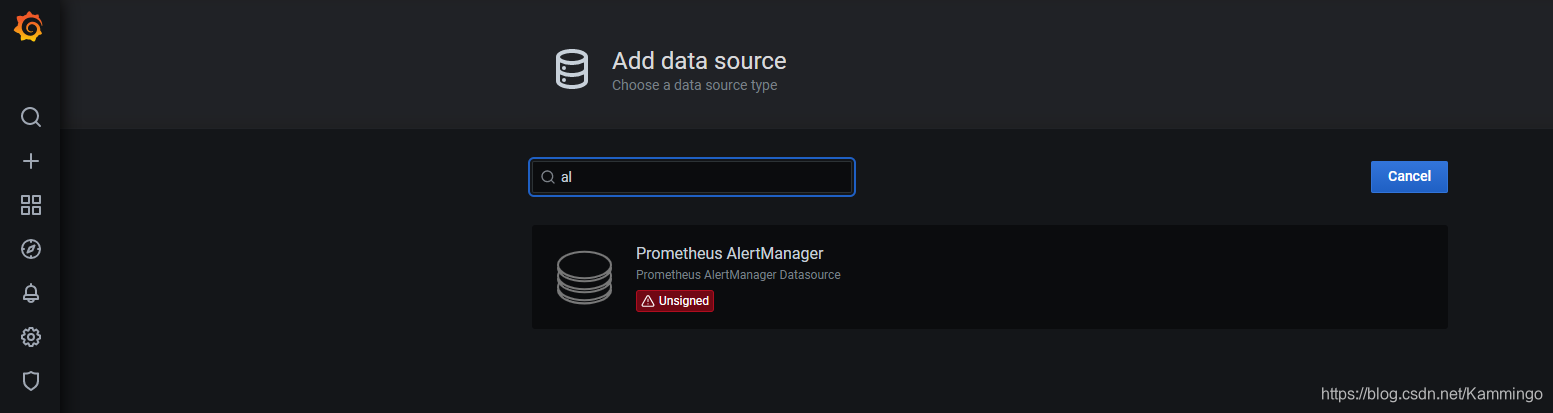
1、安装camptocamp-prometheus-alertmanager-datasource插件
# grafana-cli plugins install camptocamp-prometheus-alertmanager-datasource
# systemctl restart grafana-server
2、添加数据源
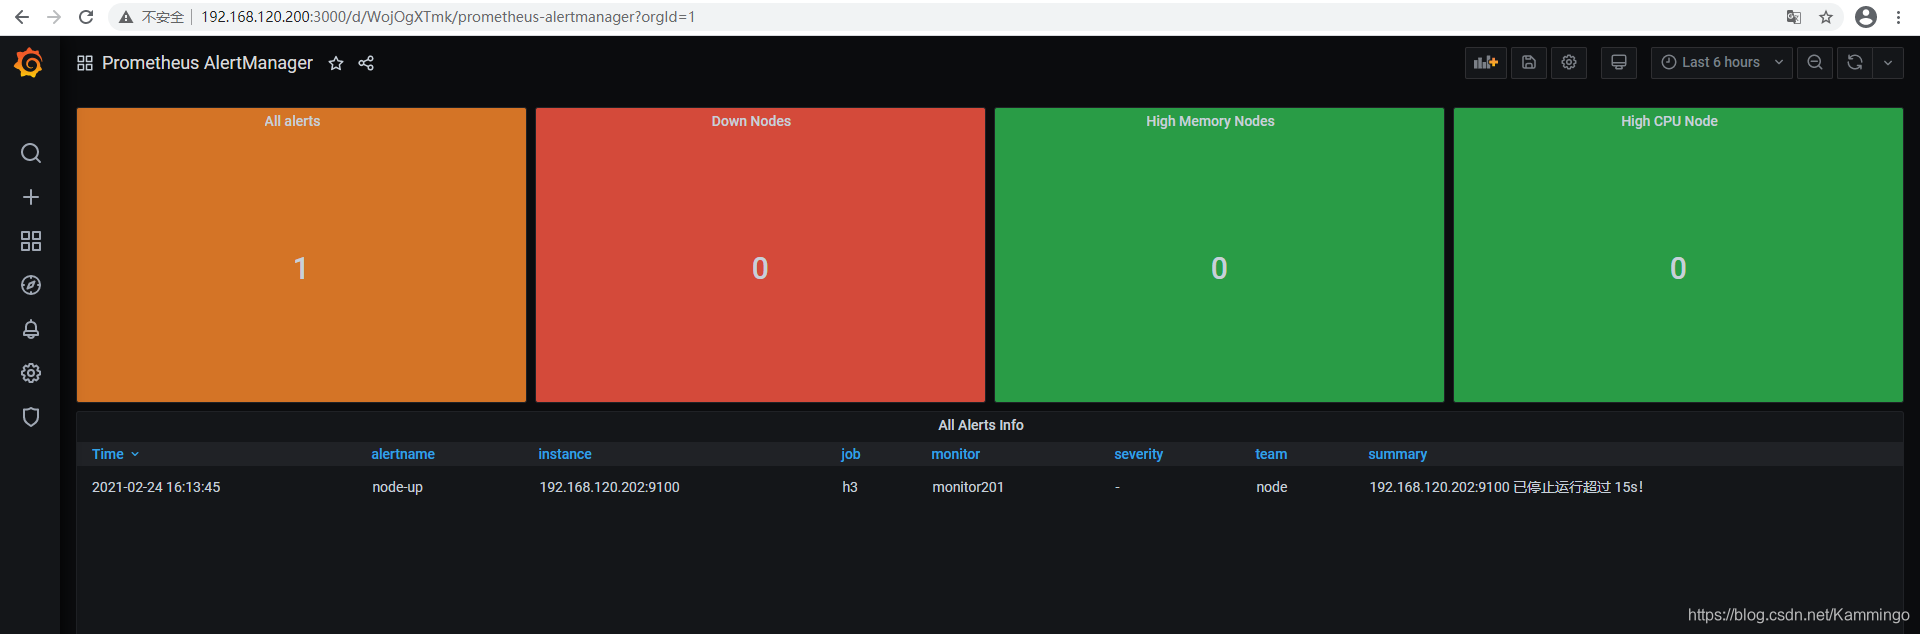
3、添加模板,选择 import ,输入8010
4、验证
步骤十六、可自定义告警模板
# mkdir /usr/local/alertmanager/template
# vim email.tmpl
{{ define "email.html" }}
    {{ range .Alerts }}
<pre>
    ========start==========
    告警程序: prometheus_alert
    告警级别: {{ .Labels.severity }}
    告警类型: {{ .Labels.alertname }}
    故障主机: {{ .Labels.instance }}
    告警主题: {{ .Annotations.summary }}
    告警详情: {{ .Annotations.description }}
    触发时间: {{ .StartsAt.Format "2019-12-14 16:01:01" }}
    ========end==========
</pre>
    {{ end }}
{{ end }}
# cat alertmanager.yml
global:
  resolve_timeout: 5m
  smtp_smarthost: 'smtp.qq.com:465'
  smtp_from: 'xxxxxxxxx@qq.com'
  smtp_auth_username: 'xxxxxxxxx@qq.com'
  smtp_auth_password: 'xxxxxxxxxxxxxx'
  smtp_require_tls: false

templates:    # 指定邮件模板的路径,可以使用相对路径,template/*.tmpl的方式
  - '/usr/local/alertmanager/template/email.tmpl'
步骤十七、补充
Prometheus存储原理及数据备份还原
快照备份,调用API
# curl -XPOST http://prometheusIP:端口/api/v1/admin/tsdb/snapshot
返回结果:
{"status":"success","data":{"name":"20191220T012427Z-21e0e532e8ca3423"}}
数据还原
利用api方式制作成snapshot后,还原时将snapshot中的文件覆盖到data目录下,重启prometheus即可!
添加定时备份任务(每周日3点备份)
# crontable -e
#注意时区,修改完时区后,需要重启 crontab systemctl  restart cron
0 3 * * 7 sudo /usr/bin/curl -XPOST -I http://127.0.0.1:9090/api/v1/admin/tsdb/snapshot >> /home/bill/prometheus


 149
149

 被折叠的 条评论
为什么被折叠?
被折叠的 条评论
为什么被折叠?
 到【灌水乐园】发言


