


vue echart 仪表盘样式
echart API https://echarts.apache.org/zh/option.html#series-gauge.type
官方的例子中仪表盘的样式是不太好看的,调了半天,调出个比较好看的来,如下:
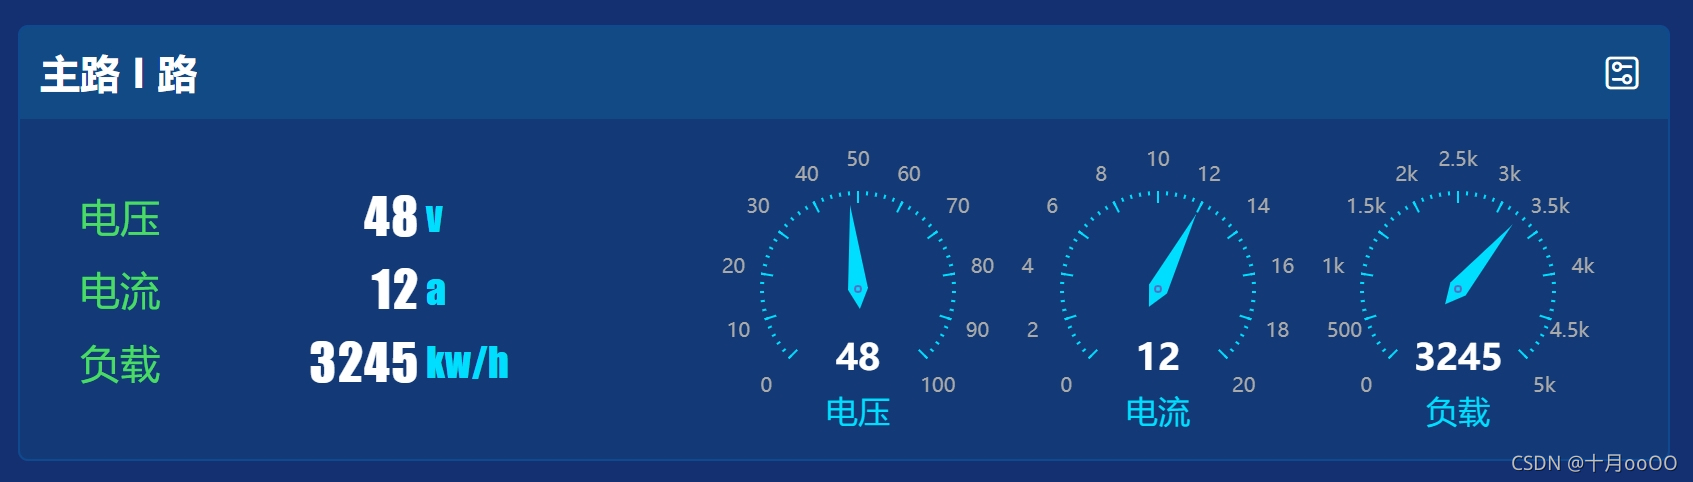
相关的配置说明如下,常用的配置项都已经详细注明了: chartSimple.vue 拿走别忘给我点个赞
<template>
    <div ref="chart" class="chart"></div>
</template>

<script>
import * as echarts from 'echarts'
const COLOR = {
    main: '#00deff',
    label: '#aaa',
    title: '#fff',
    green: '#4CD964'
}
export default {
    name: "ChartSimple",
    props: {
        chartData: '',
    },
    data(){
        return {
            option: {
                title: {
                    show: true
                },
                series: [
                    {
                        name: '电压',
                        radius: '80%', // 仪表盘占用空间的多少空间
                        type: 'gauge', // 仪表盘类型
                        progress: {
                            show: false,
                            width: 1
                        },
                        axisLine: { // 线的宽度
                            show: false,
                            lineStyle: { //
                                width: 1,
                                color: [ // 各个阶段的刻度颜色值
                                    [200, COLOR.main],
                                    [500, '#ff5454'],
                                    [1000, '#000000'],
                                ]
                            },
                        },
                        splitLine: { // 分隔刻度线样式
                            length: 6, // 刻度线的长度
                            lineStyle: {
                                width: 1,
                                color: COLOR.main
                            },
                        },
                        axisTick: { // 小刻度样式
                            splitNumber: 5, // 间隔
                            length: 2, // 刻度长度
                            show: true,
                            lineStyle: {
                                color: COLOR.main
                            }
                        },
                        axisLabel: { // 刻度标签
                            formatter: value => { // 格式化输出
                                if (value >= 1000){
                                    return `${value / 1000}k`
                                } else {
                                    return value
                                }
                            },
                            fontSize: 10,
                            distance: -25, // 标记与刻度线之间的距离
                            color: COLOR.label,
                        },
                        title: { // 标题
                            color: COLOR.main,
                            show: true,
                            offsetCenter: [0, '105%']
                        },
                        detail: { // 实际数值显示
                            valueAnimation: true,
                            fontSize: 18, // 显示数值文字大小
                            offsetCenter: [0, '60%'],
                            fontWeight: 'bold',
                            color: COLOR.title
                        },
                        anchor: { // 指针中心的固定点
                            show: true,
                            showAbove: true,
                            size: 3,
                            icon: 'circle',
                            itemStyle: {
                                color: COLOR.main,
                                borderWidth: 1
                            }
                        },
                        pointer: { // 指针样式
                            width: 5, // 指针宽度,
                            length: '70%', // 指针长度的半径比
                            itemStyle: {
                                color: COLOR.main,
                                borderWidth: 1
                            }
                        },
                        data: [
                            {
                                name: '电压',
                                value: 70, // 实际数值
                                itemStyle: {

                                }
                            }
                        ]
                    }
                ]
            }
        }
    },
    mounted() {
        this.initChart()
    },
    methods: {
        initChart(){
            this.chart = echarts.init(this.$refs.chart)
            this.option.series[0].min = this.chartData.min // 设置最值
            this.option.series[0].max = this.chartData.max
            this.option.series[0].data[0].value = this.chartData.value // 设置实时值
            this.option.series[0].data[0].name = this.chartData.name // 设置仪表名
            this.chart.setOption(this.option)
        }
    }
}
</script>

<style scoped lang="scss">

.chart{
    height: 150px;
    width: 150px;
}

</style>


 2119
2119

 被折叠的 条评论
为什么被折叠?
被折叠的 条评论
为什么被折叠?
 到【灌水乐园】发言


