


前言:
在早期的版本中 Kubernetes 提供了 heapster、influxDB、grafana 的组合来监控系统,所以我们可以在 Dashboard 中看到 heapster 提供的一些图表信息,在后续的版本中会陆续移除掉 heapster,现在更加流行的监控工具是 prometheus,prometheus 是 Google 内部监控报警系统的开源版本,是 Google SRE 思想在其内部不断完善的产物,它的存在是为了更快和高效的发现问题,快速的接入速度,简单灵活的配置都很好的解决了这一切,而且是已经毕业的 CNCF 项目
一、二进制搭建Prometheus
prometheus的方式有很多,为了兼容k8s环境,我们将prometheus搭建在k8s里,除了使用docker镜像的方式安装,还可以使用二进制的方式进行安装,支持mac、Linux、windows
1.1 下载二进制文件
二进制下载地址:Download | Prometheus 下
选择适合自己服务器的版本类型
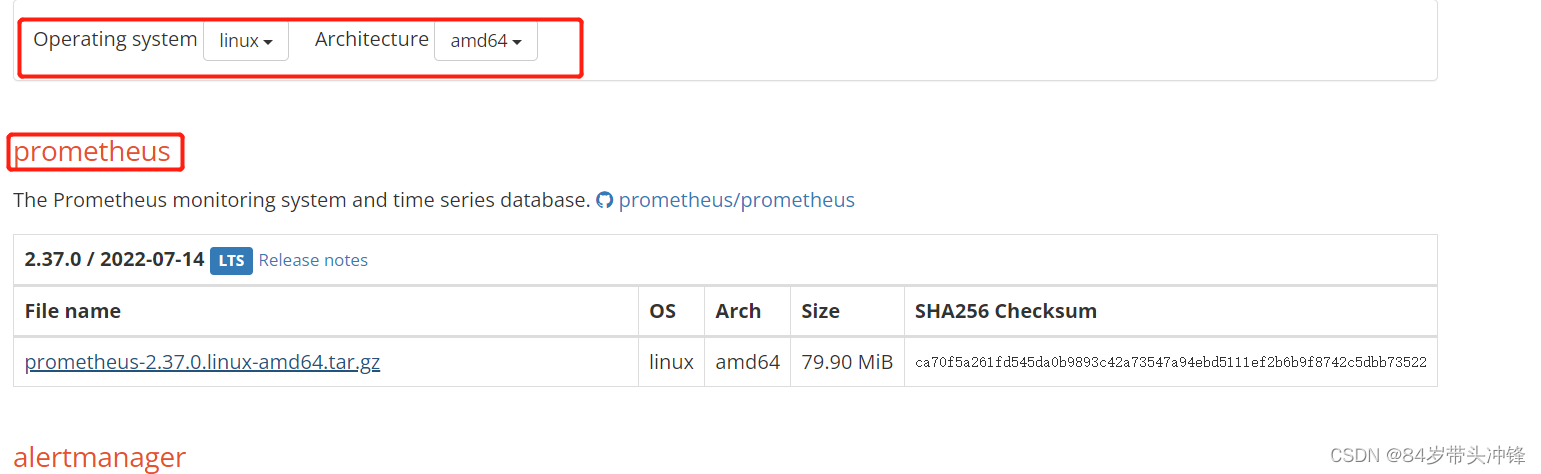
1.2 下载完成之后将二进制安装包上传至服务器
[root@k8s-master ~]# mkdir /opt/prometheus
[root@k8s-master ~]# cd /opt/prometheus/
[root@k8s-master prometheus]# ls
[root@k8s-master prometheus]# rz -E
rz waiting to receive.
[root@k8s-master prometheus]# ls
prometheus-2.37.0.linux-amd64.tar.gz prometheus-2.37.0.linux-amd64.tar.gz
[root@k8s-master prometheus]# tar -zxf prometheus-2.37.0.linux-amd64.tar.gz && tar -zxf node_exporter-1.4.0-rc.0.linux-amd64.tar.gz
[root@k8s-master prometheus]# cd prometheus-2.37.0.linux-amd64/
[root@k8s-master prometheus-2.37.0.linux-amd64]# sed -i  's/localhost/192.168.161.16/g' prometheus.yml
[root@k8s-master prometheus-2.37.0.linux-amd64]# nohup ./prometheus &
[1] 30914
[root@k8s-master prometheus-2.37.0.linux-amd64]# nohup: 忽略输入并把输出追加到"nohup.out"
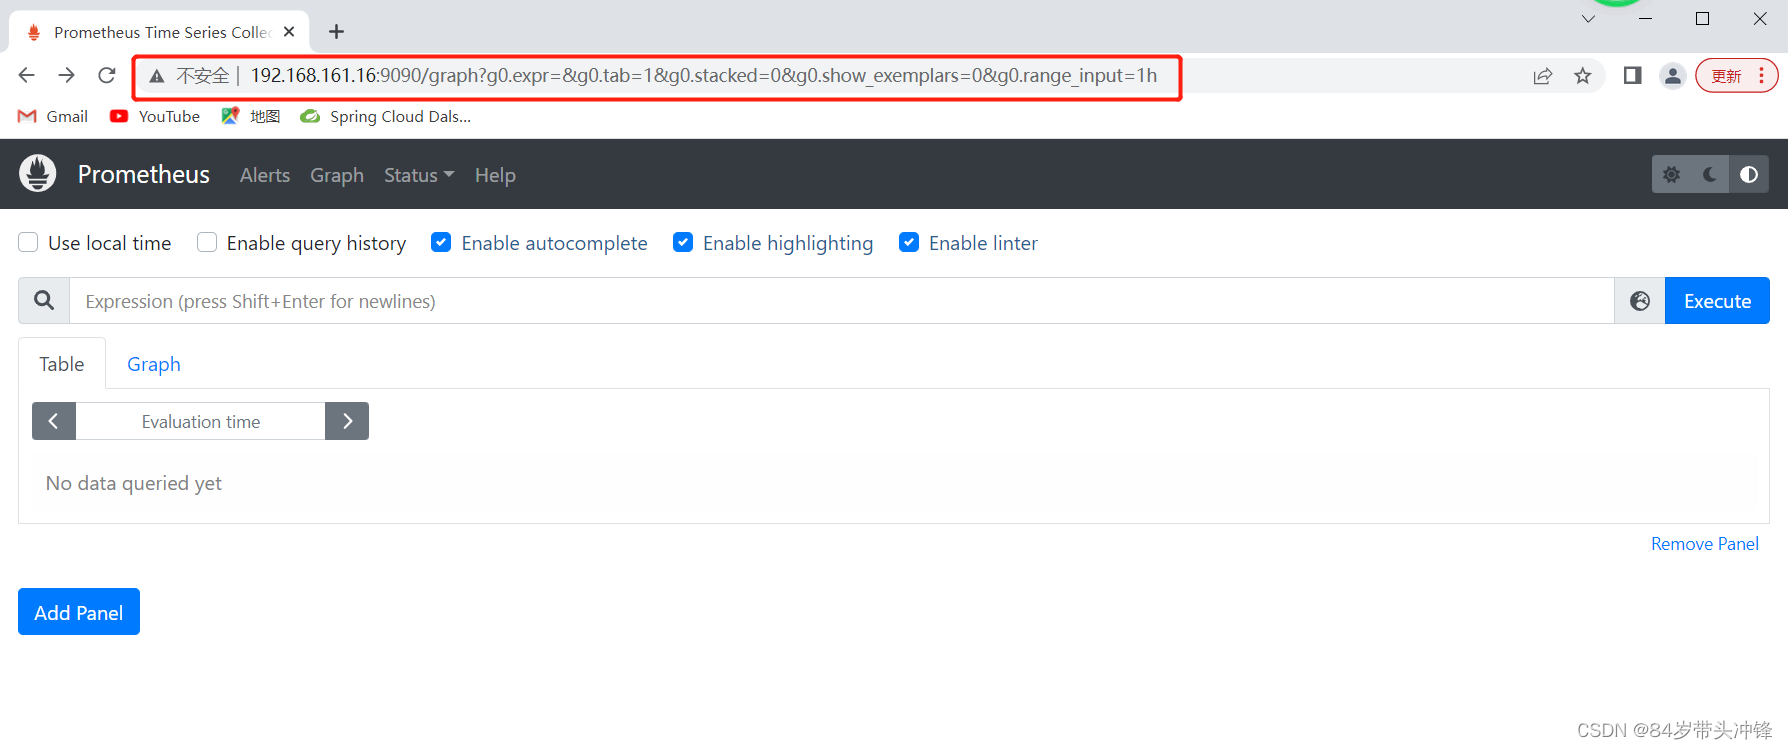
1.3 使用浏览器访问Prometheus
在浏览器输入192.168.161.16:9090;出现以下页面表示Prometheus搭建成功
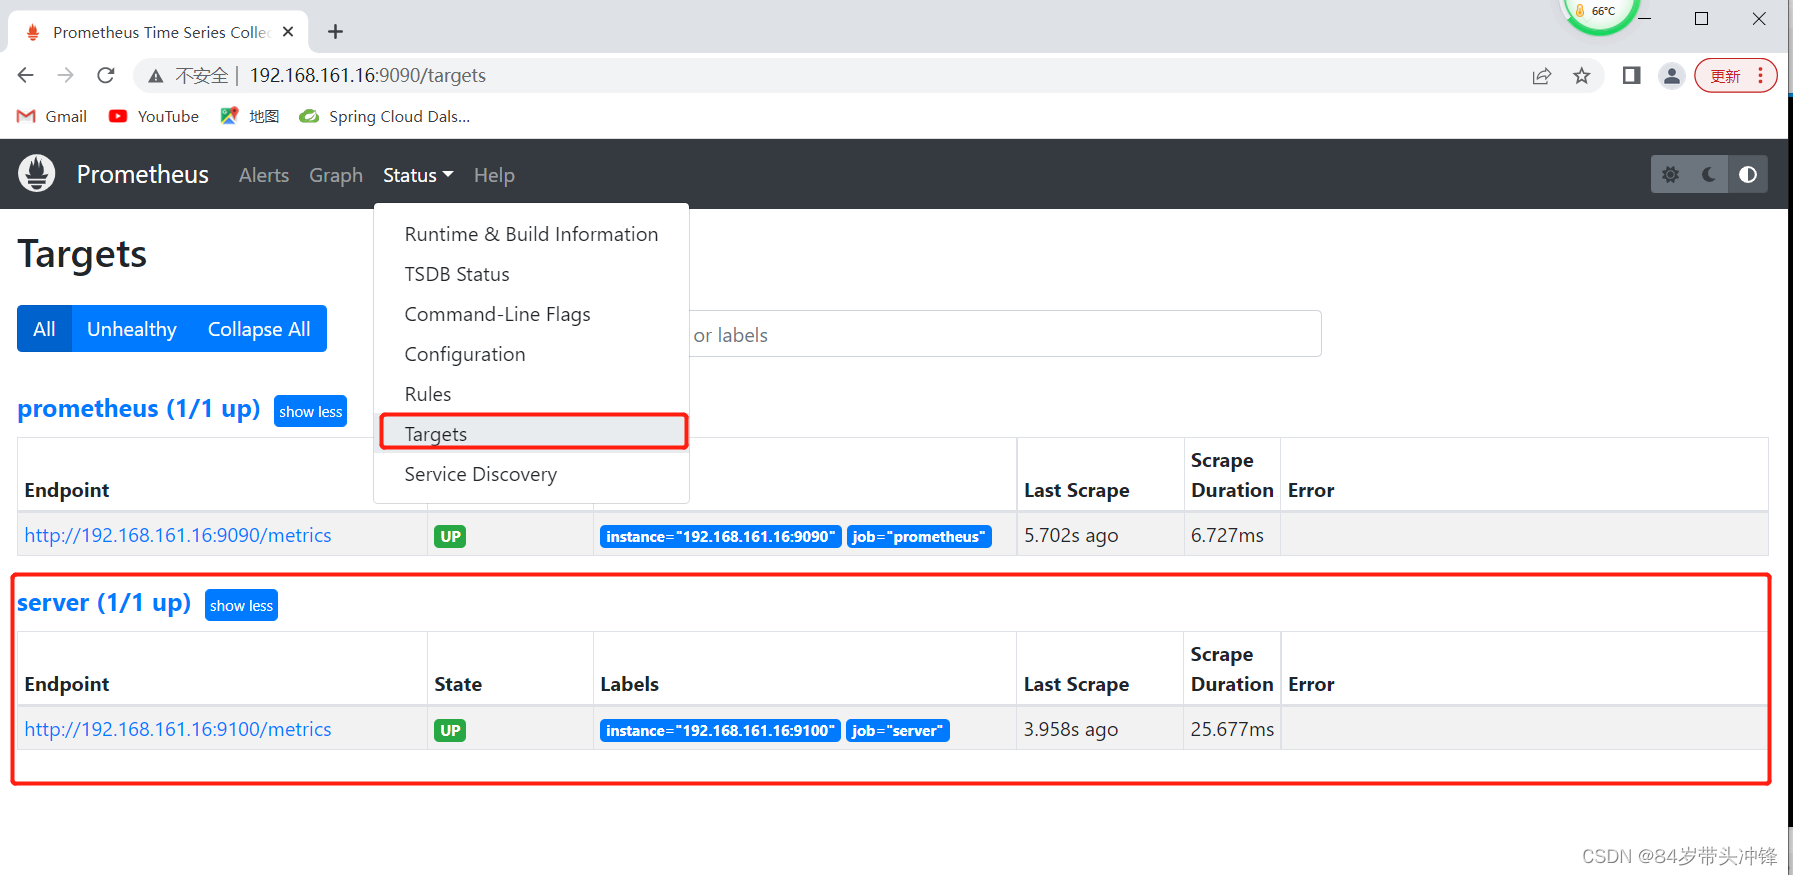
1.4 使用node_exporter获取监控主机的数据
再次使用浏览器查看Prometheus系统是否添加主机进来
[root@k8s-master ~]# cat /opt/prometheus/prometheus-2.37.0.linux-amd64/prometheus.yml
# my global config
global:
  scrape_interval: 15s # Set the scrape interval to every 15 seconds. Default is every 1 minute.
  evaluation_interval: 15s # Evaluate rules every 15 seconds. The default is every 1 minute.
  # scrape_timeout is set to the global default (10s).

# Alertmanager configuration
alerting:
  alertmanagers:
    - static_configs:
        - targets:
          # - alertmanager:9093

# Load rules once and periodically evaluate them according to the global 'evaluation_interval'.
rule_files:
  # - "first_rules.yml"
  # - "second_rules.yml"

# A scrape configuration containing exactly one endpoint to scrape:
# Here it's Prometheus itself.
scrape_configs:
  # The job name is added as a label `job=<job_name>` to any timeseries scraped from this config.
  - job_name: "prometheus"

    # metrics_path defaults to '/metrics'
    # scheme defaults to 'http'.

    static_configs:
      - targets: ["192.168.161.16:9090"]
  - job_name: 'server'
    static_configs:
      - targets: ['192.168.161.16:9100']  # 监控 node_exporter 数据,主要监控node节点数据(内存,cpu,负载等)
root@k8s-master prometheus-2.37.0.linux-amd64]# cd /opt/prometheus/prometheus-2.37.0.linux-amd64/ && nohup ./prometheus &
[2] 36571
[root@k8s-master prometheus-2.37.0.linux-amd64]# nohup: 忽略输入并把输出追加到"nohup.out"

[2]+  退出 1                cd /opt/prometheus/prometheus-2.37.0.linux-amd64/ && nohup ./prometheus
[root@k8s-master prometheus-2.37.0.linux-amd64]# cd /opt/prometheus/node_exporter-1.4.0-rc.0.linux-amd64/ && nohup ./node_exporter &
[2] 37165
[root@k8s-master prometheus-2.37.0.linux-amd64]# nohup: 忽略输入并把输出追加到"nohup.out"
1.5 Prometheus与grafana
下载地址:Download Grafana | Grafana Labs
[root@k8s-master opt]# wget https://dl.grafana.com/enterprise/release/grafana-enterprise-9.0.7-1.x86_64.rpm
[root@k8s-master opt]# sudo yum install grafana-enterprise-9.0.7-1.x86_64.rpm
[root@k8s-master opt]# systemctl start grafana-server.service
[root@k8s-master opt]# systemctl enable grafana-server.service
Created symlink from /etc/systemd/system/multi-user.target.wants/grafana-server.service to /usr/lib/systemd/system/grafana-server.service.
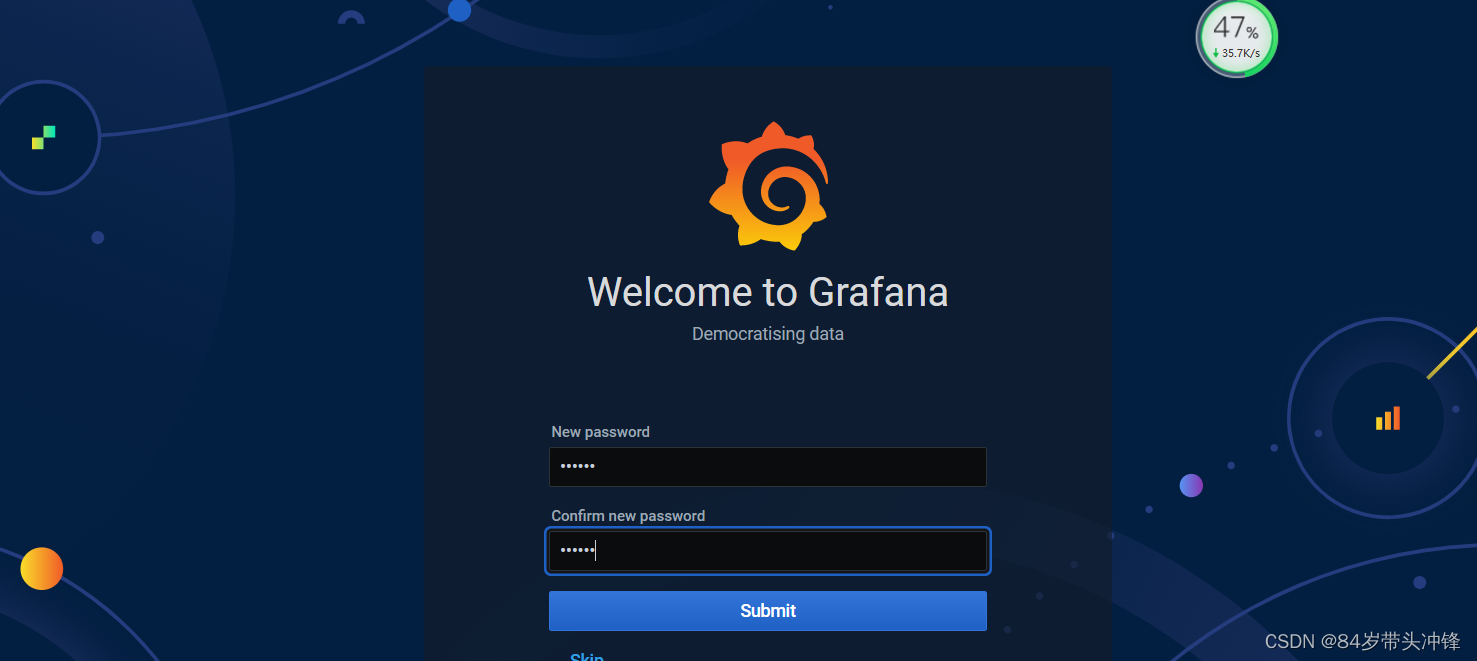
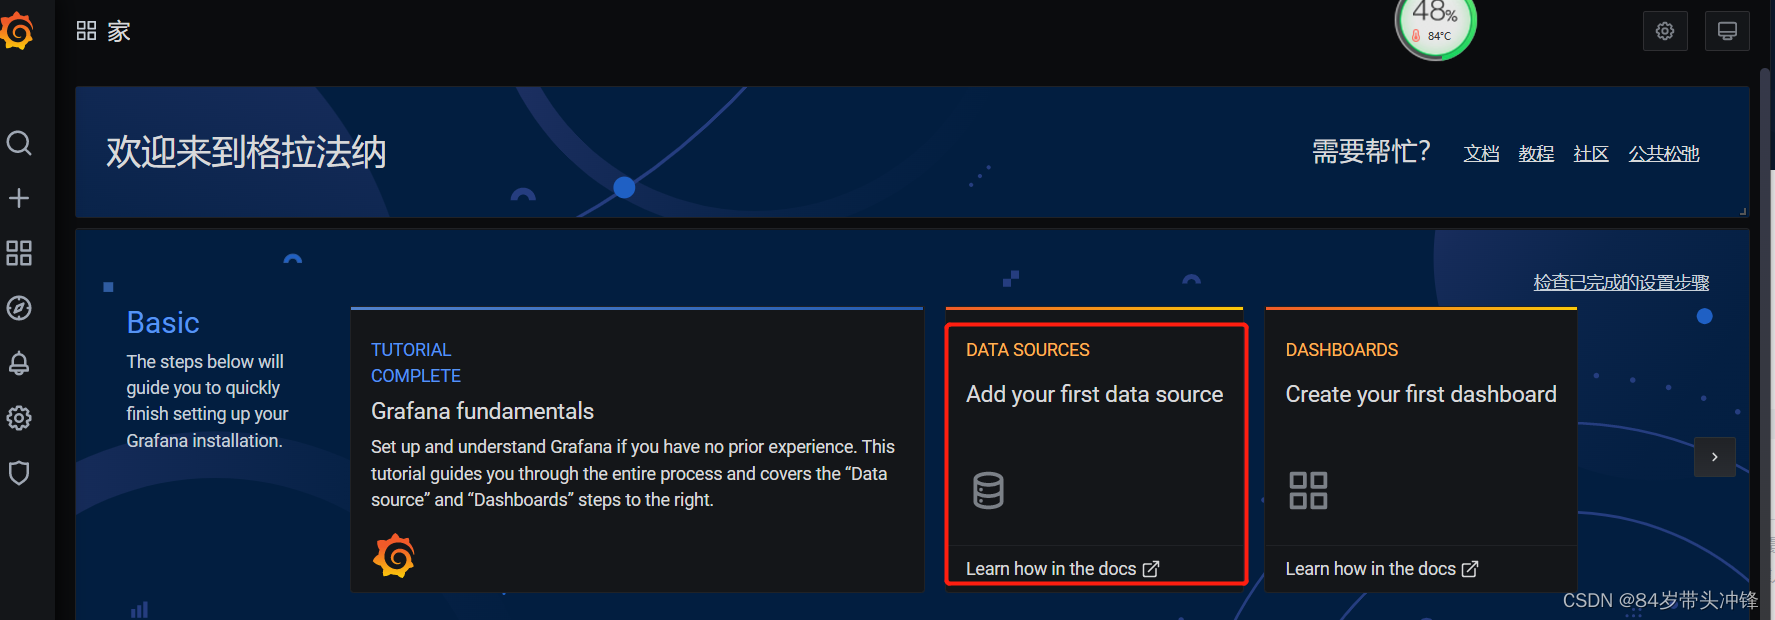
grafana默认账户密码为:admin/admin,第一次登陆成功后会强制修改默认密码
点击添加数据源
然后选择第一个Prometheus
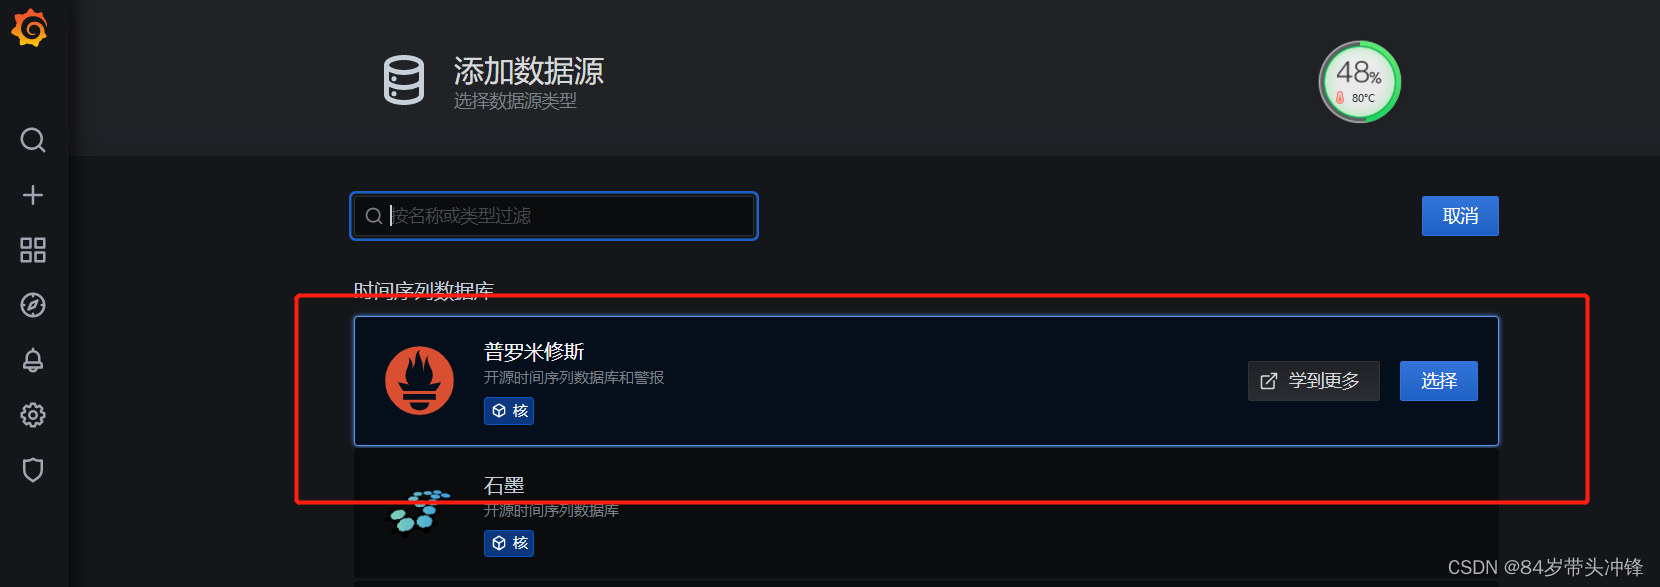
输入Prometheus监控系统的地址,这里为192.168.161.16

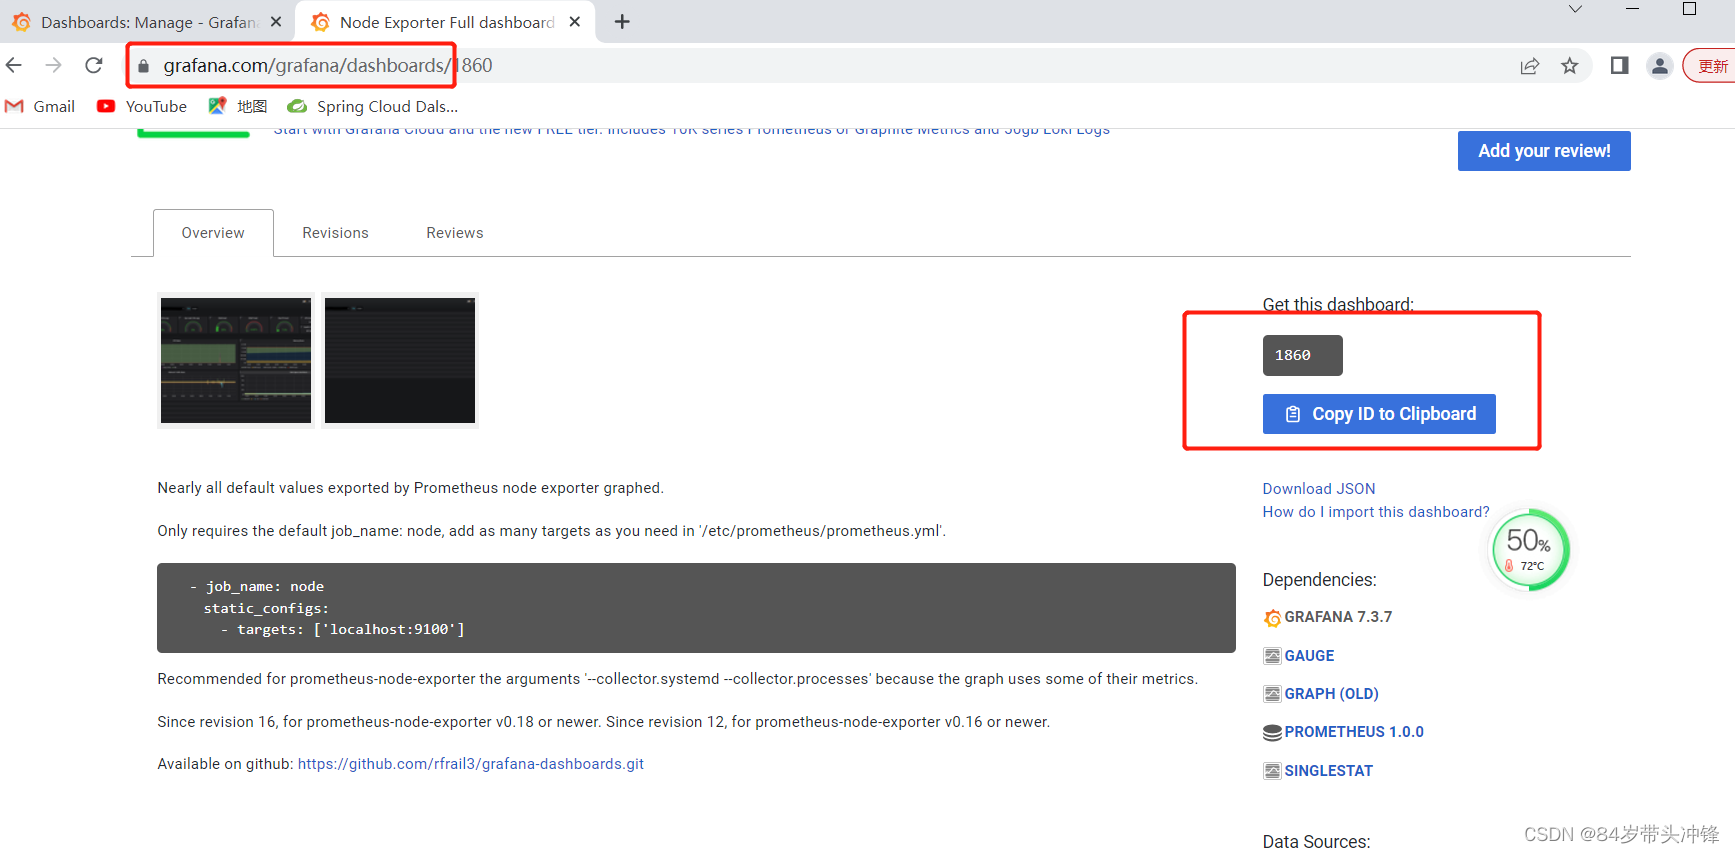
官网下载模板
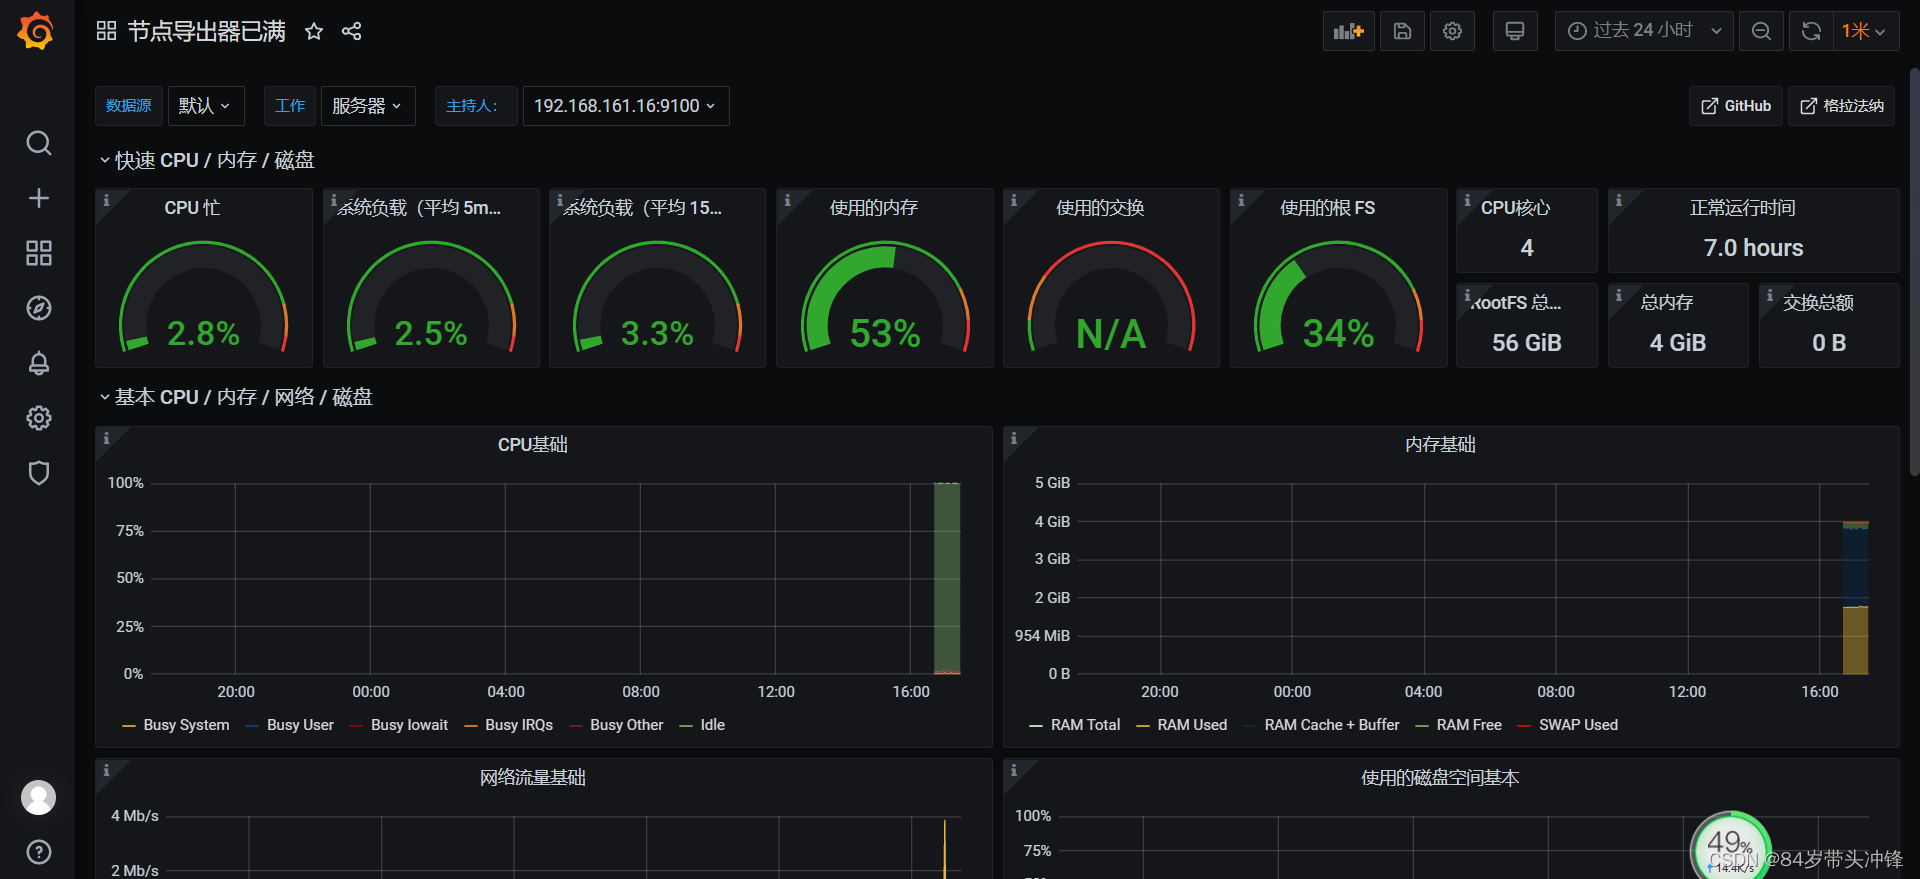
返回仪表盘,添加仪表盘
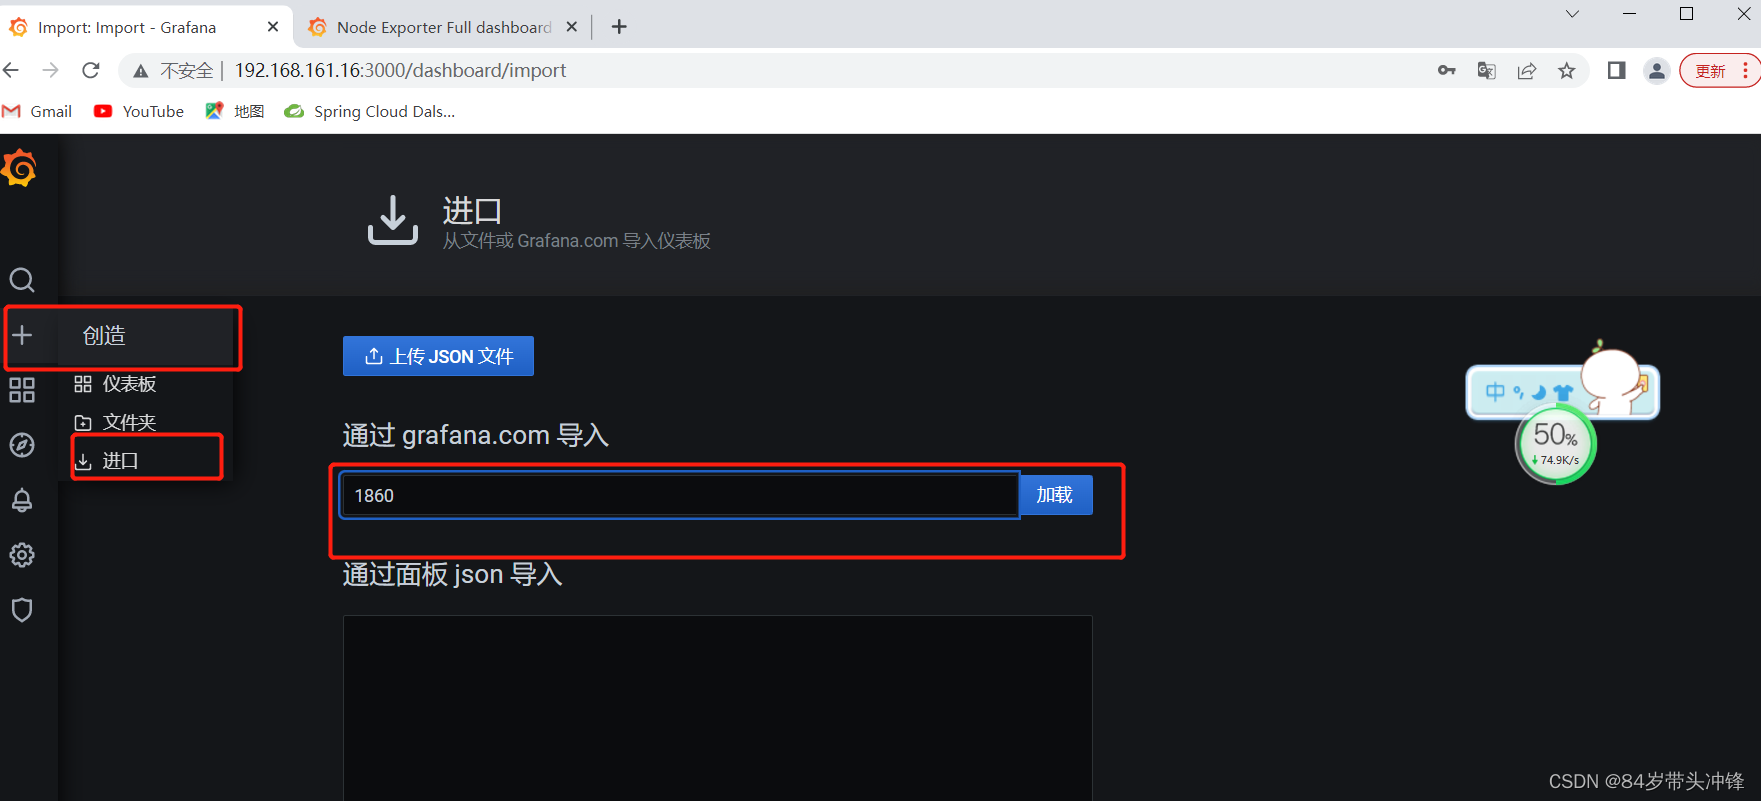
选择Prometheus1,然后点击import
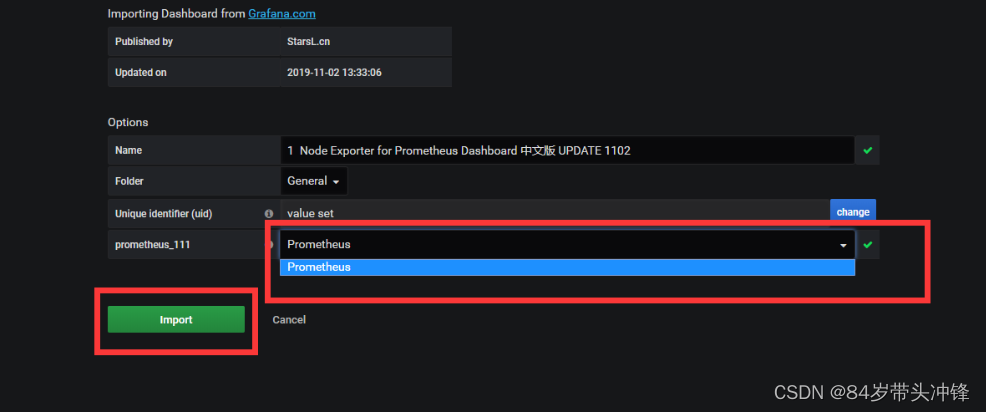
至此,grafana与Prometheus监控系统搭建成功


 353
353

 被折叠的 条评论
为什么被折叠?
被折叠的 条评论
为什么被折叠?
 到【灌水乐园】发言


