


 matlab 绘图、直方图、plot图
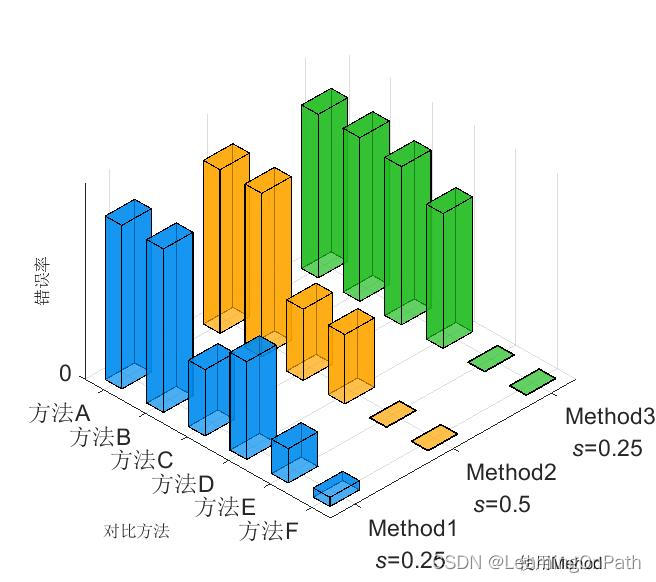
一、3D直方图
原代码来自作者xiaoyeyimier,如代码中的注释中所示。本文只是用于整理绘图代码,避免以前下载的代码丢失。若有侵权,请联系我删除。
clear all;
N = 6; % %这里修改每行数据个数
Data1 = [0.4997 0.4996 0.2027 0.2988 0.1050 0.028];%修改数据
Data2 = [0.5000 0.4997 0.2177 0.2119 0.002 0.002];
Data3 = [0.4995 0.5001 0.4835 0.4120 0.002 0.002];

X = repmat(1:N,3,1);% 3行N列
Y = [1,1.5,2];%要改变每行的位置,修改这里
Z = [Data1;Data2;Data3];

figure('color','w','position',[0,0,800,600])
ax = newplot();hold on;
FancyBar3(X,Y,Z);%绘图

ax.YTick = Y;% 这里我是三种方法,所以3个ticks
ax.XTick = 1:N;
ax.ZTick = 0:3;
ax.FontSize = 14;

% 这里对应Y轴3个ticks
ax.YTickLabel={'Method1\newline \it{s}\rm{=0.25}','Method2\newline \it{s}\rm{=0.5}','Method3\newline \it{s}\rm{=0.25}'};%\newline可以实现换行
ax.XTickLabel={'方法A','方法B','方法C','方法D','方法E','方法F'};
xlabel('对比方法','fontsize',10,'FontName','song','FontSize',10);
ylabel('使用Mehod','fontsize',10,'FontName','song','FontSize',10);
zlabel('错误率','fontsize',10,'FontName','song');
yyy = get(ax,'YLim');
ax.XGrid = 'off';
ax.YGrid = 'off';
ax.ZGrid = 'on';
grid on

function [ax] = FancyBar3(varargin)
% 3D histogram
% author : xiaoyeyimier
% date   : 2022-3-30
% version : 1.01
% contact : xiaoyeyimier@163.com
%=========================================================================%
%% Input
% X          : The abscissa of each set of data.
%              Each row of data must be uniform and increasing
% Y          : The position of each histogram on the plane
% Z          : yData of the data of each group
% B3settings : Drawing parameters,
% |            including the length, width and height of each cube
% |___dWidth         : The interval between adjacent pieces of data in the
% |                    same set;
% |___LineWidth      : The border thickness of the histogram;
% |___TempYWidth     : The interval between different datasets;
% |___TempFaceAlpha  : The opacity of the histogram;
% |___ViewAngle      : angle of view ;
% |___colorarr       : Colors used for different groups of data;
% ax          : You can specify a coordinate handle that is currently in use
%=========================================================================%
%% Output
% ax         : Handle to the coordinate axes used for drawing
%=========================================================================%
% read & check parameters
[X,Y,Z,B3,ax] = inputParamCheck(varargin,nargin);
B3 = StructCompletion(B3,X);
TempFaceAlpha  = B3.TempFaceAlpha;
colorarr = B3.colorarr;
LineWidth = B3.LineWidth;
% draw plane by plane
for looptimeI = 1:length(Y)
    if looptimeI==length(Y)
        TempYWidth = B3.TempYWidth*(Y(looptimeI)-Y(looptimeI-1));
    else
        TempYWidth = B3.TempYWidth*(Y(looptimeI+1)-Y(looptimeI
最低0.47元/天 解锁文章


 1869
1869


 被折叠的 条评论
为什么被折叠?
被折叠的 条评论
为什么被折叠?
 到【灌水乐园】发言


