


死锁经典代码(代码来源:http://www.debuginfo.com/examples/src/DeadLockDemo.cpp):
#include <windows.h>
#include <tchar.h>
#include <process.h>
#include <stdio.h>

typedef unsigned (__stdcall *PTHREAD_START) (void*);

#define BEGINTHREADEX(lpsa, cbStack, lpStartAddr,\
	lpvThreadParm, fdwCreate, lpIDThread)          \
	((HANDLE)_beginthreadex(                     \
	(void*)(lpsa),                           \
	(unsigned)(cbStack),                     \
	(PTHREAD_START)(lpStartAddr),            \
	(void*)(lpvThreadParm),                  \
	(unsigned)(fdwCreate),                   \
	(unsigned*)(lpIDThread)))


class CCriticalSectionMy
{
public:
	CCriticalSectionMy()
	{
		InitializeCriticalSection( &m_cs );
	}
	~CCriticalSectionMy()
	{
		DeleteCriticalSection( &m_cs );
	}
	void Lock()
	{
		EnterCriticalSection( &m_cs );
	}
	void Unlock()
	{
		LeaveCriticalSection( &m_cs );
	}

private:
	CCriticalSectionMy( const CCriticalSectionMy& );
	CCriticalSectionMy& operator=( const CCriticalSectionMy& );
	CRITICAL_SECTION m_cs;
};

class CCritSecLockMy
{
public:

	CCritSecLockMy( CCriticalSectionMy& cs )
		: m_rcs( cs )
	{
		_tprintf( _T("CCritSecLockMy[%u] Lock.\n"), GetCurrentThreadId() );
		m_rcs.Lock();
	}

	~CCritSecLockMy()
	{
		_tprintf( _T("~CCritSecLockMy[%u] Unlock.\n"), GetCurrentThreadId() );
		m_rcs.Unlock();
	}

private:
	CCriticalSectionMy& m_rcs;
};

DWORD WINAPI ThreadOne( LPVOID lpParam );
DWORD WINAPI ThreadTwo( LPVOID lpParam );

CCriticalSection CritSecOne;
CCriticalSection CritSecTwo;

int _tmain( int argc, TCHAR* argv[] )
{
	_tprintf( _T("Starting worker threads...\n") );
	HANDLE  hThread   = NULL;
	DWORD   ThreadId  = 0;

	hThread = BEGINTHREADEX(0, 0, ThreadOne, 0, 0, &ThreadId );
	if( hThread == NULL )
	{
		_tprintf( _T("Cannot start thread. Error: %u\n"), GetLastError() );
		return 0;
	}

	hThread = BEGINTHREADEX(0, 0, ThreadTwo, 0, 0, &ThreadId );
	if( hThread == NULL )
	{
		_tprintf( _T("Cannot start thread. Error: %u\n"), GetLastError() );
		return 0;
	}

	_tprintf( _T("Worker threads started.\n") );
	Sleep( 60 * 60 * 1000 );
	_tprintf( _T("Test complete.\n") );

	return 0;
}

DWORD WINAPI ThreadOne( LPVOID lpParam )
{
	_tprintf( _T("ThreadOne[%u] started.\n"), GetCurrentThreadId() );
	while( 1 )
	{
		CCritSecLockMy LockOne( CritSecOne);
		_tprintf( _T("ThreadOne[%u] acquired CritSecOne\n"), GetCurrentThreadId() );
		{
			CCritSecLockMy LockTwo( CritSecTwo);
			_tprintf( _T("ThreadOne[%u] acquired CritSecTwo.\n"), GetCurrentThreadId() );
		}
	}
	return 0;
}

DWORD WINAPI ThreadTwo( LPVOID lpParam )
{
	_tprintf( _T("ThreadTwo[%u] started.\n"), GetCurrentThreadId() );
	while( 1 )
	{
		CCritSecLockMy LockTwo( CritSecTwo);
		_tprintf( _T("ThreadTwo[%u] acquired CritSecTwo\n"), GetCurrentThreadId() );
		{
			CCritSecLockMy LockOne( CritSecOne);
			_tprintf( _T("ThreadTwo[%u] acquired CritSecOne\n"), GetCurrentThreadId() );
		}
	}

	return 0;
}
可以参考“获取dump的八种方式”获取dump。
分析流程:
1.设置“Symbol File Path”:srv*[MyPath]*http://msdl.microsoft.com/download/symbols;[MyPDBFilePath];
2.通过“Open Crash Dump”打开抓取的dump;
3.输入:!analyze -v分析一下:
FAULTING_IP:
ntdll!DbgBreakPoint+0
00007ffa`704ce370 cc              int     3

EXCEPTION_RECORD:  ffffffffffffffff -- (.exr 0xffffffffffffffff)
ExceptionAddress: 00007ffa704ce370 (ntdll!DbgBreakPoint)
   ExceptionCode: 80000003 (Break instruction exception)
  ExceptionFlags: 00000000
NumberParameters: 1
   Parameter[0]: 0000000000000000
80000003:中断指令异常;
4.输入:~*kb 观察到有线程由:ntdll!RtlpWaitOnCriticalSection
   3  Id: 74bc.5cd0 Suspend: 1 Teb: 00000000`005ba000 Unfrozen
RetAddr           : Args to Child                                                           : Call Site
00007ffa`70454c73 : 00000000`00000000 00000000`00000000 00000000`00000000 00000000`6d959b40 : ntdll!ZwWaitForAlertByThreadId+0x14
00007ffa`70454a74 : 00007ff7`a6df8150 00000000`02d2f830 00007ff7`a6df8158 00000000`6d90d3b6 : ntdll!RtlpWaitOnAddressWithTimeout+0x43
00007ffa`7044efb7 : 00000000`02d2f800 00007ff7`a6df8150 00000000`fffffffa 00000000`6d8d0a82 : ntdll!RtlpWaitOnCriticalSection+0x164
00007ffa`7044eed0 : 00000000`02d76430 00000000`00000000 00000000`00000000 00000000`00000000 : ntdll!RtlpEnterCriticalSectionContended+0xd7
00007ff7`a6df11a9 : 00007ff7`a6df68b0 00000000`00005cd0 00000000`00000002 00000000`02d2d180 : ntdll!RtlEnterCriticalSection+0x40

   4  Id: 74bc.1a2c Suspend: 1 Teb: 00000000`005bc000 Unfrozen
RetAddr           : Args to Child                                                           : Call Site
00007ffa`70454c73 : 00000000`00000000 00000000`00000000 00000000`00000000 00000000`6d959b40 : ntdll!ZwWaitForAlertByThreadId+0x14
00007ffa`70454a74 : 00007ff7`a6df8128 00000000`02e7fde0 00007ff7`a6df8130 00000000`6d90d3b6 : ntdll!RtlpWaitOnAddressWithTimeout+0x43
00007ffa`7044efb7 : 00000000`02e7fe00 00007ff7`a6df8128 00000000`fffffffa 00000000`6d8d0a82 : ntdll!RtlpWaitOnCriticalSection+0x164
00007ffa`7044eed0 : 00000000`02d76700 00000000`00000000 00000000`00000000 00000000`00000000 : ntdll!RtlpEnterCriticalSectionContended+0xd7
00007ff7`a6df12b9 : 00007ff7`a6df68b0 00000000`00001a2c 00000000`00000002 00000000`02e7d730 : ntdll!RtlEnterCriticalSection+0x40
5.输入:!locks
CritSec Testshow!CritSecOne+0 at 00007ff7a6df8128
WaiterWoken        No
LockCount          1
RecursionCount     1
OwningThread       5cd0
EntryCount         0
ContentionCount    1
*** Locked

CritSec Testshow!CritSecTwo+0 at 00007ff7a6df8150
WaiterWoken        No
LockCount          1
RecursionCount     1
OwningThread       1a2c
EntryCount         0
ContentionCount    1
*** Locked
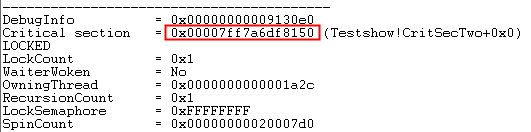
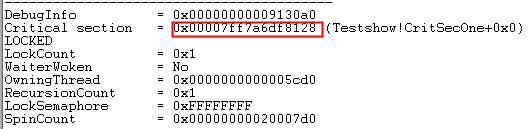
6.输入:!cs -l
-----------------------------------------
DebugInfo          = 0x00000000009130a0
Critical section   = 0x00007ff7a6df8128 (Testshow!CritSecOne+0x0)
LOCKED
LockCount          = 0x1
WaiterWoken        = No
OwningThread       = 0x0000000000005cd0
RecursionCount     = 0x1
LockSemaphore      = 0xFFFFFFFF
SpinCount          = 0x00000000020007d0
-----------------------------------------
DebugInfo          = 0x00000000009130e0
Critical section   = 0x00007ff7a6df8150 (Testshow!CritSecTwo+0x0)
LOCKED
LockCount          = 0x1
WaiterWoken        = No
OwningThread       = 0x0000000000001a2c
RecursionCount     = 0x1
LockSemaphore      = 0xFFFFFFFF
SpinCount          = 0x00000000020007d0
7.输入:~3kv
0:007> ~3kv
Child-SP          RetAddr           : Args to Child                                                           : Call Site
00000000`02d2f788 00007ffa`70454c73 : 00000000`00000000 00000000`00000000 00000000`00000000 00000000`6d959b40 : ntdll!ZwWaitForAlertByThreadId+0x14
00000000`02d2f790 00007ffa`70454a74 : 00007ff7`a6df8150 00000000`02d2f830 00007ff7`a6df8158 00000000`6d90d3b6 : ntdll!RtlpWaitOnAddressWithTimeout+0x43
00000000`02d2f7c0 00007ffa`7044efb7 : 00000000`02d2f800 00007ff7`a6df8150 00000000`fffffffa 00000000`6d8d0a82 : ntdll!RtlpWaitOnCriticalSection+0x164
00000000`02d2f870 00007ffa`7044eed0 : 00000000`02d76430 00000000`00000000 00000000`00000000 00000000`00000000 : ntdll!RtlpEnterCriticalSectionContended+0xd7
00000000`02d2f8a0 00007ff7`a6df11a9 : 00007ff7`a6df68b0 00000000`00005cd0 00000000`00000002 00000000`02d2d180 : ntdll!RtlEnterCriticalSection+0x40
0:007> ~4kv
Child-SP          RetAddr           : Args to Child                                                           : Call Site
00000000`02e7fd38 00007ffa`70454c73 : 00000000`00000000 00000000`00000000 00000000`00000000 00000000`6d959b40 : ntdll!ZwWaitForAlertByThreadId+0x14
00000000`02e7fd40 00007ffa`70454a74 : 00007ff7`a6df8128 00000000`02e7fde0 00007ff7`a6df8130 00000000`6d90d3b6 : ntdll!RtlpWaitOnAddressWithTimeout+0x43
00000000`02e7fd70 00007ffa`7044efb7 : 00000000`02e7fe00 00007ff7`a6df8128 00000000`fffffffa 00000000`6d8d0a82 : ntdll!RtlpWaitOnCriticalSection+0x164
00000000`02e7fe20 00007ffa`7044eed0 : 00000000`02d76700 00000000`00000000 00000000`00000000 00000000`00000000 : ntdll!RtlpEnterCriticalSectionContended+0xd7
00000000`02e7fe50 00007ff7`a6df12b9 : 00007ff7`a6df68b0 00000000`00001a2c 00000000`00000002 00000000`02e7d730 : ntdll!RtlEnterCriticalSection+0x40
8.分析:可以观察到3号线程RtlpWaitOnCriticalSection的第二个参数对象正好在4号线程的Critical Section里:
4号线程的RtlpWaitOnCriticalSection的第二个参数对象亦然:

边学边研究,后面补充“所以然”。


 1687
1687


 被折叠的 条评论
为什么被折叠?
被折叠的 条评论
为什么被折叠?
 到【灌水乐园】发言


