


博主最近在看无监督学习中的EM算法部分,主要参考的是MLAPP和YiDaXu在优酷上的视频。后期想进一步了解一个EM算法在混合高斯模型中的应用,所以想要进一步参考相关的MATLAB代码。MLAPP提供了hardEM中的一个应用,即K-means的MATLAB实现。然而…(:зゝ∠)…

这一坨代码足足看了博主将近两天,不得不承认MLAPP的代码确实很有水准,但是对于和博主一样的初学者,这段代码和鸡肋一样难啃。所以博主自写一段最为简练的EM in GMM 的MATLAB代码,希望各位网友批评指正。
1.Comprehension of EM algorithm
Thereason why we introduce EM algorithm is that if we are dealing withunsupervised learning problem, specifically, the GMM problem, since there arenumerous Gaussian Models to fit the dataset, therefore, there are sum ofprobability appearing inside the log. In this way, the latent variable z’s aresupposed to introduced another variables while replace the summation withproduction.
Inthe E-step, the mission is to calculate the responsibility. To understand itintuitively, responsibility z_k is the probability that data point x_i willappear in the clustering group k, with respect to total clustering groups weassume.
To sum up, in this step, we figure out
P(z|x,θ(g))
.
In the M-step, after we get the above conditional probability, we could maximize the log-likelihood of the given dataset, where
θ(g+1)=argmax∫P(x|z,θ)P(z|x,θ(g))dz
With respect to the weights, means, and covariance matrices of each Gaussian Models,
ϕ
,
μ
and
σ
.
What simplifies our work is that the values of these parameters after every iteration are given in most of the reference books in Machine Learning by setting the derivatives to zero. The deduction of these parameters will be depicted in another article.
2. MATLAB code for EM
main.m:
%% Initialization
clear ; close all; clc
u = [1 6; 8 2];
Sigma(:,:,1) = [2 0; 0 2];
Sigma(:,:,2) = [1 0; 0 1];
generate_Data(u, Sigma);
iter = 100;
%% =========== Part 1: Loading and Visualizing Data =============
% Load Training Data
fprintf('Loading and Visualizing Data ...\n')
load('EM_GMM_data.mat');
% Number of examples (m); dimension of examples (n)
[m, n] = size(X);
% Seperate the dataset into two dimension data, x1 and x2
x1 = X(:, 1);
x2 = X(:, 2);
% Plot training data
plot(x1, x2, 'rx', 'MarkerSize', 10, 'LineWidth', 1.5);
xlabel('x1'); ylabel('x2');
fprintf('Program paused. Press enter to continue.\n');
pause;
%% =========== Part 2: Initialize the parameters ===============
% Suppose we have only 2 clustering groups
K = 2;
% phi_x is the weight of the Gaussian
% u_x and Sigma_x is the mean and the covariance matrix of the Gaussian
phi_x = 1/K * ones(K, 1);
u_x = rand(K, n);
Sigma_x = 2*rand(n,n,K) - rand(n,n,K);
for i = 1:K
while (det(Sigma(:,:,i))<1e-2)
Sigma(:,:,i) = 2*rand(n,n) - rand(n,n);
end
end
%% ===================== Part 3: EM step =========================
phi_last = phi_x;
u_last = u_x;
Sigma_last = Sigma_x;
for i = 1:iter
respons = E_step(X, K, phi_last, u_last, Sigma_last);
[phi_new, u_new, Sigma_new] = M_step(X, respons);
phi_last = phi_new;
u_last = u_new;
Sigma_last = Sigma_new;
end
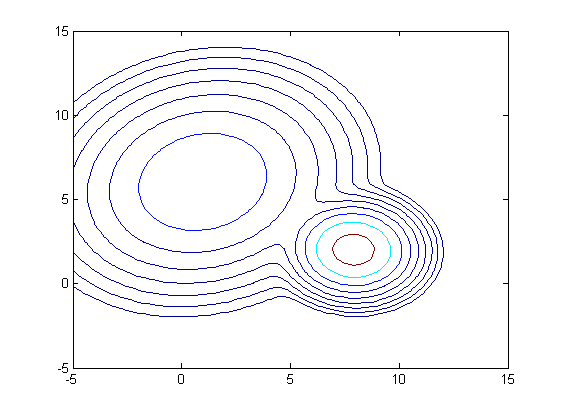
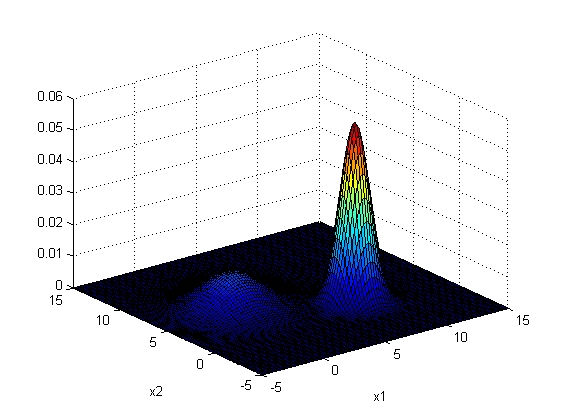
%% ============ Part 4: Plot the contour of Gauss ================
% This section could only be applied to the 2-dimensional dataset, and the
% number of clustering group is 2
x1_val = linspace(-5, 15, 100);
x2_val = linspace(-5, 15, 100);
% calculate the corresponding density probability
for i = 1:length(x1_val)
for j = 1:length(x2_val)
x_cb = [x1_val(i), x2_val(j)];
P_d1(i,j) = gaussian_Cal(x_cb, u_new(1,:), Sigma_new(:,:,1));
end
end
for i = 1:length(x1_val)
for j = 1:length(x2_val)
x_cb = [x1_val(i), x2_val(j)];
P_d2(i,j) = gaussian_Cal(x_cb, u_new(2,:), Sigma_new(:,:,2));
end
end
P_d = phi_new(1) * P_d1 + phi_new(2) * P_d2;
P_d = P_d';
figure;
surf(x1_val, x2_val, P_d);
xlabel('x1'); ylabel('x2');
figure;
contour(x1_val, x2_val, P_d, logspace(-5, -1, 10));function generate_Data(u, Sigma)
% Determine the dimension of this training set (n)
% and the number of clustering groups (m)
[m, n] = size(u);
%% Generate data
% Create 500 data points according to the input Gaussian parameters
data_num = 500;
% randomly
X = zeros(data_num, n);
for i = 1:data_num
index = (m-1) * rand(1);
index = int8(index) + 1;
X_plus = u(index,:) + randn(1, n) * Sigma(:,:,index);
X(i, :) = X_plus;
end
%% Store the data
save('EM_GMM_data.mat', 'X');
endfunction p = gaussian_Cal(x, u, Sigma)
%GAUSSIANCAL is used to calculate the probability density of a
%multi-dimentional Gaussian distribution
m = size(u, 2);
Sigma_inv = sum(sum((Sigma)' * Sigma)); % calculate the inner product
p = 1./((2*pi).^(m/2) * Sigma_inv.^(1/2)) * exp(...
-0.5 * (x - u) * (inv(Sigma)) * (x - u)');
endfunction respons = E_step(X, K, phi, u, Sigma)
%ESEP figures out the responsibility of the individual Gaussian.
% The P(zi = q|xi, thetaq) is denoted by P_z(q)
[m, n] = size(X);
respons = zeros(m, K);
% First we have to calculate for each x, what is the density of probability
% for it to appear in jth clustering group. Here P is a m-by-K dimensional
% matrix.
% Then we should calculate P(zi = q|xi, thetaq) accordingly
for i = 1:m
for j = 1:K
P(i, j) = phi(j, 1) * gaussian_Cal(X(i,:), u(j, :), Sigma(:, :, j));
end
P_sum = sum(P(i, :));
for j = 1:K
respons(i, j) = P(i, j)/P_sum;
end
end
endfunction [phi, u, Sigma] = M_step(X, respons)
%MSEP is a function attempt to maximize the paremeter phi, u, Sigma
% m denotes the number of training sets, n demotes the dimension of
% training set
[m, n] = size(X);
% K denotes the number of clustering group
K = size(respons, 2);
respons_k = sum(respons, 1);
phi = (respons_k/m)';
for i = 1:K
respons_v = repmat(respons(:,i),1,n);
u(i, :) = sum(respons_v .* X, 1)./ repmat(respons_k(i),1,n);
end
for i = 1:K
respons_v = repmat(respons(:,i),1,n);
Sigma(:,:,i) = (respons_v .* X)' * X ./ repmat(respons_k(i),n,n) - u(i,:)' * u(i,:);
end
end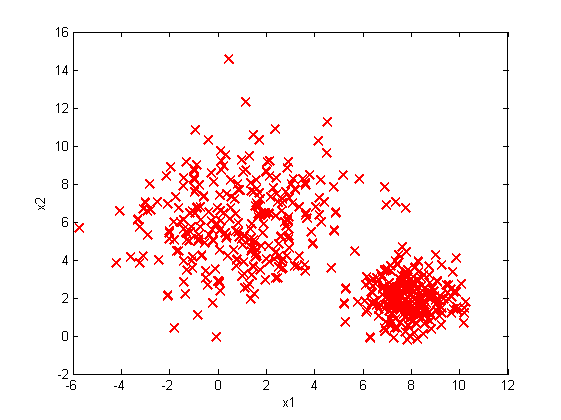
Although it could generate somehow correct fitting models to the datasets, this piece of code fail to make sure that the eigenvalue of covariance matrices to be positive, which I would try to modify it later.


 1805
1805

 被折叠的 条评论
为什么被折叠?
被折叠的 条评论
为什么被折叠?
 到【灌水乐园】发言


