


vue项目中引入
npm install echarts --save
npm i echarts-liquidfill@2.0.2 --save
在主文件入口js文件
import echarts from 'echarts';
import 'echarts-liquidfill';
//可以在别的组件中使用this.$echarts直接使用
Vue.prototype.$echarts = echarts;
mounted(){
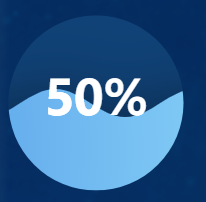
this.setflow("flow","#104277","#58A2F0","#8BD7FF",0.5);
},
methods:{
setflow(vessel,bgcolor,bgcolor2,bgcolor3,val){
var chartDom = document.getElementById(vessel);
var myChart = this.$echarts.init(chartDom);
var option;
option = {
series: [{
type: 'liquidFill', //表明这是一个水球图类型
radius: '70%', // 水球图的半径,一般控制球的大小
center: ['50%', '50%'],
data:[{
value:val,
label: {
color: "#fff",
fontSize: 38,
fontFamily: 'OPPOSans',
fontWeight: 'bold',
lineHeight: 28,
},
direction:'left', //指定波浪的移动方向'left' 或 'right', 'none' 表示静止。
itemStyle:{
normal:{
color:{
colorStops:[{
offset: 0,
color: bgcolor2 // 0% 处的颜色
}, {
offset: 1,
color: bgcolor3 // 100% 处的颜色
}]
} // 设置水波的颜色
}
}
}
],
outline: {
// 外边框不显示
show: false,
// itemStyle: {
// borderWidth: 0,
// },
borderDistance: 0,
},
backgroundStyle: {
borderWidth: '0',
color: bgcolor,
},
}],
}
option && myChart.setOption(option);
},
}


 438
438


 被折叠的 条评论
为什么被折叠?
被折叠的 条评论
为什么被折叠?
 到【灌水乐园】发言


