


<div id="sssqtb" class="sssqtb"></div>
// 水位示意图
initChart() {
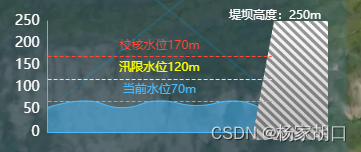
var maxHeight = "250"; //最大高度/堤坝高度
let markline = ["170", "120", "70", "0"]; //设计水位,汛限水位,当前水位,校核水位
let normalColor = "#CBDDFF";
let option = {
xAxis: {
type: "category",
data: ["", "", "", "", "", "", ""],
boundaryGap: false,
axisTick: { show: false },
axisLabel: {
// show: false, // 设置为 false 可以隐藏 x 轴的数据
fontSize: 16,
color: normalColor,
},
axisLine: {
lineStyle: {
color: "#48BCFF",
width: 1,
},
},
splitLine: {
lineStyle: {
color: "#FFF",
},
},
},
yAxis: {
nameTextStyle: {
fontSize: 16,
color: normalColor,
},
max: maxHeight,
min: 0,
boundaryGap: [1, 1],
type: "value",
axisLine: {
show: true,
lineStyle: {
color: "#48BCFF",
width: 1,
},
},
axisTick: { show: false },
axisLabel: {
fontSize: 14,
color: "#ffffff",
},
splitLine: {
show: false,
lineStyle: {
color: "#FFF",
type: "dotted",
opacity: 0.02,
width: 1,
},
},
splitNumber: 5,
},
grid: {
top: "18%",
right: "20%",
left: "3%",
bottom: "0",
containLabel: true,
},
graphic: {
elements: [
{
type: "image",
right: "3%",
top: "18%",
z: 5,
bounding: "raw",
origin: [0, 0],
style: {
image: require("../../../../assets/images/drawMap/mapIndex/reservoir.png"),
width: 80,
height: 140,
},
},
{
type: "text",
right: 0,
top: "10%",
right: "5%",
z: 5,
style: {
text: "堤坝高度:" + maxHeight + "m",
fill: "#FFF",
fontSize: 12,
},
},
],
},
series: [
{
type: "line",
data: [55, 70, 55, 70, 60,70,40],
// barCategoryGap: "-100%",
// 区域
areaStyle: {
color: '#48BCFF',
opacity: 0.5
},
smooth: true,// 平滑
symbolSize: 0, // 设置小圆点的大小
// 线颜色
lineStyle: {
normal: {
color: '#48BCFF',
width: 1,
// type: 'dashed'
}
},
// itemStyle: {
// color: new this.$echarts.graphic.LinearGradient(0, 0, 0, 1, [
// { offset: 0, color: "#0493df" },
// { offset: 1, color: "#48BCFF" },
// ]),
// },
markLine: {
silent: true, //鼠标移入高亮 true不高亮
symbol: ['none', 'none'],
data: [
{
label: {
position: "middle",
fontSize: 12,
formatter: "{b}{c}m",
color: "#FF473A",
},
name: "校核水位",
yAxis: markline[0],
lineStyle: { type: "solid", color: "#FF473A ", width: 1, type: 'dashed', },
},
{
label: {
position: "middle",
fontSize: 12,
formatter: "{b}{c}m",
color: "#FF0",
},
name: "汛限水位",
yAxis: markline[1],
lineStyle: { type: "solid", color: "#FF0", width: 1, type: 'dashed', },
},
{
label: {
position: "middle",
fontSize: 12,
formatter: "{b}{c}m",
color: "#48BCFF",
},
name: "当前水位",
yAxis: markline[2],
lineStyle: { type: "solid", color: "#48BCFF ", width: 1, type: 'dashed', },
},
// {
// label: {
// position: "insideMiddleBottom",
// fontSize: 12,
// formatter: "{b}{c}m",
// color: "#FFF",
// },
// name: "校核洪水位",
// yAxis: markline[3],
// lineStyle: { type: "solid", color: "#FFF", width: 1 },
// },
],
},
},
],
};
let myChart = this.$echarts.init(document.getElementById("sssqtb"));
myChart.setOption(option);
window.addEventListener("resize", () => {
myChart.resize();
});
},


 1247
1247


 被折叠的 条评论
为什么被折叠?
被折叠的 条评论
为什么被折叠?
 到【灌水乐园】发言


