


前言
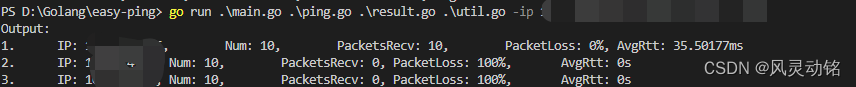
最近在写一些运维小工具,比如批量进行ping包的工具,实现不困难,反正就是ping,统计,然后输出,不过我本着自己既是开发者又是使用者的理念,还是不喜欢输出特别难看的工具,就像这样:
所以就去https://pkg.go.dev/瞄了一眼,看看有没有啥适合的库能够把输出整的好看点的,于是找到了一个库github.com/jedib0t/go-pretty/v6/table,这是一个在命令行输出格式化表格的库,这里记录一下使用这个库进行一些格式化输出的过程。
其实还有一个比较简单的库叫做gotable,也能实现基础的格式化输出功能,使用起来也方便些,不过功能相对来说就要单一一些,在表格样式设置上会差一些,没那么自由,也可以看下https://pkg.go.dev/github.com/liushuochen/gotable#section-readme
正文
接下来开始正式的去在命令行生成好看的满足需要的表格。
生成Table
首先我们要生成一个Table结构体的实例,可以直接New一个,也可以自己构造:
t := table.Table{}
// 或者
t := table.NewWriter()
NewWriter会返回一个Writer接口
表头设置
表格首先要设置表头,以我的应用为例,表头设置:
header := table.Row{"ID", "IP", "Num", "PacketsRecv", "PacketLoss", "AvgRtt"}
这样生成了一个表头行,然后要通过AppendHeader方法在表格中生效:
t.AppendHeader(header)
看看效果,表头已经打印出来了
+----+----+-----+-------------+------------+--------+
| ID | IP | NUM | PACKETSRECV | PACKETLOSS | AVGRTT |
+----+----+-----+-------------+------------+--------+
+----+----+-----+-------------+------------+--------+
插入行
数据的插入和表头的生成类似,要生成一个table.Row,然后调用AppendRow方法:
func (d *Demo) AppendRow() {
	for i := 1; i <= 5; i++ {
		row := table.Row{i, fmt.Sprintf("10.0.0.%v", i), i + 4, i, i, "AppendRow"}
		d.T.AppendRow(row)
	}
}
效果如下:
+----+----------+-----+-------------+------------+-----------+
| ID | IP       | NUM | PACKETSRECV | PACKETLOSS | AVGRTT    |
+----+----------+-----+-------------+------------+-----------+
|  1 | 10.0.0.1 |   5 |           1 |          1 | AppendRow |
|  2 | 10.0.0.2 |   6 |           2 |          2 | AppendRow |
|  3 | 10.0.0.3 |   7 |           3 |          3 | AppendRow |
|  4 | 10.0.0.4 |   8 |           4 |          4 | AppendRow |
|  5 | 10.0.0.5 |   9 |           5 |          5 | AppendRow |
+----+----------+-----+-------------+------------+-----------+
当然也可以生成table.Row的切片后调用一次AppendRows方法,效果和上面是一样的:
func (d *Demo) AppendRows() {
	var rows []table.Row
	for i := 1; i <= 5; i++ {
		rows = append(rows, table.Row{i, fmt.Sprintf("10.0.0.%v", i), i + 4, i, i, "AppendRows"})
	}
	d.T.AppendRows(rows)
}
+----+----------+-----+-------------+------------+------------+
| ID | IP       | NUM | PACKETSRECV | PACKETLOSS | AVGRTT     |
+----+----------+-----+-------------+------------+------------+
|  1 | 10.0.0.1 |   5 |           1 |          1 | AppendRow  |
|  2 | 10.0.0.2 |   6 |           2 |          2 | AppendRow  |
|  3 | 10.0.0.3 |   7 |           3 |          3 | AppendRow  |
|  4 | 10.0.0.4 |   8 |           4 |          4 | AppendRow  |
|  5 | 10.0.0.5 |   9 |           5 |          5 | AppendRow  |
|  1 | 10.0.0.1 |   5 |           1 |          1 | AppendRows |
|  2 | 10.0.0.2 |   6 |           2 |          2 | AppendRows |
|  3 | 10.0.0.3 |   7 |           3 |          3 | AppendRows |
|  4 | 10.0.0.4 |   8 |           4 |          4 | AppendRows |
|  5 | 10.0.0.5 |   9 |           5 |          5 | AppendRows |
+----+----------+-----+-------------+------------+------------+
表格标题
在设置表格实际内容时,还可以设置一个表格标题,如下:
func (d *Demo) AddTitle() {
	d.T.SetTitle("This is Easy Table")
}
+-------------------------------------------------------------+
| This is Easy Table                                          |
+----+----------+-----+-------------+------------+------------+
| ID | IP       | NUM | PACKETSRECV | PACKETLOSS | AVGRTT     |
+----+----------+-----+-------------+------------+------------+
|  1 | 10.0.0.1 |   5 |           1 |          1 | AppendRow  |
|  2 | 10.0.0.2 |   6 |           2 |          2 | AppendRow  |
|  1 | 10.0.0.1 |   5 |           1 |          1 | AppendRows |
|  2 | 10.0.0.2 |   6 |           2 |          2 | AppendRows |
+----+----------+-----+-------------+------------+------------+
自动标号
在插入行的时候,我额外输入了一个ID列,作为标号,其实table提供了相关的方法和接口,只需要调用SetAutoIndex方法,增加自动的索引列即可:
func (d *Demo) MakeHeader() {
	header := table.Row{"IP", "Num", "PacketsRecv", "PacketLoss", "AvgRtt"}
	d.T.AppendHeader(header)
	d.T.SetAutoIndex(true)
}
+------------------------------------------------------------+
| This is Easy Table                                         |
+---+----------+-----+-------------+------------+------------+
|   | IP       | NUM | PACKETSRECV | PACKETLOSS | AVGRTT     |
+---+----------+-----+-------------+------------+------------+
| 1 | 10.0.0.1 |   5 |           1 |          1 | AppendRow  |
| 2 | 10.0.0.2 |   6 |           2 |          2 | AppendRow  |
| 3 | 10.0.0.1 |   5 |           1 |          1 | AppendRows |
| 4 | 10.0.0.2 |   6 |           2 |          2 | AppendRows |
+---+----------+-----+-------------+------------+------------+
单元格合并
有的时候,相邻单元格的值一样我们可能会想要进行合并,这样更美观,单元格合并分为列合并和行合并;先定义一下这里的列合并和行合并:
- 列合并:针对单列,如果单列中的多个相邻行数据一样,那么就合并为一个大行;
- 行合并:针对单行,如果单行中的多个相邻列数据一样,那么久合并为一个大列;
这里我们用到的原始表格如下:
+--------------------------------------------------------------+
| This is Easy Table                                           |
+---+----------+-------+-------------+------------+------------+
|   | IP       |   NUM | PACKETSRECV | PACKETLOSS | AVGRTT     |
+---+----------+-------+-------------+------------+------------+
| 1 | 10.0.0.1 |     5 |           1 |          1 | AppendRow  |
| 2 | 10.0.0.2 |     6 |           2 |          2 | AppendRow  |
| 3 | 10.0.0.1 |     5 |           1 |          1 | AppendRows |
| 4 | 10.0.0.2 |     6 |           2 |          2 | AppendRows |
+---+----------+-------+-------------+------------+------------+
|   | TOTAL    | TOTAL |       TOTAL |      TOTAL | 4          |
+---+----------+-------+-------------+------------+------------+
列合并
我们先进行最后一列AvgRtt的列合并:
func (d *Demo) ColumnMerge() {
	d.T.SetColumnConfigs([]table.ColumnConfig{
		{
			Name: "AvgRtt",
			// Number是指定列的序号
			// Number: 5,
			AutoMerge: true,
			Align:     text.AlignCenter,
		},
	})
}
可以选择通过列的表头或者列的序号来选择具体进行合并的列:
+---+----------+-------+-------------+------------+------------+
|   | IP       |   NUM | PACKETSRECV | PACKETLOSS | AVGRTT     |
+---+----------+-------+-------------+------------+------------+
| 1 | 10.0.0.1 |     5 |           1 |          1 |  AppendRow |
| 2 | 10.0.0.2 |     6 |           2 |          2 |            |
| 3 | 10.0.0.1 |     5 |           1 |          1 | AppendRows |
| 4 | 10.0.0.2 |     6 |           2 |          2 |            |
+---+----------+-------+-------------+------------+------------+
|   | TOTAL    | TOTAL |       TOTAL |      TOTAL | 4          |
+---+----------+-------+-------------+------------+------------+
这样看表格线条不明显,感觉不到区分,那么可以加上一些设置
d.T.Style().Options.SeparateRows = true
+---+----------+-------+-------------+------------+------------+
|   | IP       |   NUM | PACKETSRECV | PACKETLOSS | AVGRTT     |
+---+----------+-------+-------------+------------+------------+
| 1 | 10.0.0.1 |     5 |           1 |          1 |  AppendRow |
+---+----------+-------+-------------+------------+            |
| 2 | 10.0.0.2 |     6 |           2 |          2 |            |
+---+----------+-------+-------------+------------+------------+
| 3 | 10.0.0.1 |     5 |           1 |          1 | AppendRows |
+---+----------+-------+-------------+------------+            |
| 4 | 10.0.0.2 |     6 |           2 |          2 |            |
+---+----------+-------+-------------+------------+------------+
|   | TOTAL    | TOTAL |       TOTAL |      TOTAL | 4          |
+---+----------+-------+-------------+------------+------------+
行合并
行合并我们对最后一行的汇总行进行合并,具体做法是在添加汇总行时增加RowConfig参数:
func (d *Demo) AppendFooter() {
	d.T.AppendFooter(table.Row{"Total", "Total", "Total", "Total", count}, table.RowConfig{AutoMerge: true})
}
+---+----------+-------+-------------+------------+------------+
|   | IP       |   NUM | PACKETSRECV | PACKETLOSS | AVGRTT     |
+---+----------+-------+-------------+------------+------------+
| 1 | 10.0.0.1 |     5 |           1 |          1 |  AppendRow |
+---+----------+-------+-------------+------------+            |
| 2 | 10.0.0.2 |     6 |           2 |          2 |            |
+---+----------+-------+-------------+------------+------------+
| 3 | 10.0.0.1 |     5 |           1 |          1 | AppendRows |
+---+----------+-------+-------------+------------+            |
| 4 | 10.0.0.2 |     6 |           2 |          2 |            |
+---+----------+-------+-------------+------------+------------+
|   |                    TOTAL                    | 4          |
+---+---------------------------------------------+------------+
样式设置
现在整个表格已经生成,但我们还需要进行一些美化,这就要对表格的样式进行设置了;
居中设置
对于居中,无法直接进行全局的设置,必须根据列进行,如下:
func (d *Demo) SetAlignCenter() {
	column := []string{"IP", "Num", "PacketsRecv", "PacketLoss", "AvgRtt"}
	c := []table.ColumnConfig{}
	// 根据表格的列数循环进行设置,统一居中
	for i := 1; i <= len(column); i++ {
		name := column[i-1]
		if name == "AvgRtt" {
			c = append(c, table.ColumnConfig{
				Name:        "AvgRtt",
				AutoMerge:   true,
				Align:       text.AlignCenter,
				AlignHeader: text.AlignCenter,
				AlignFooter: text.AlignCenter,
			})
			continue
		}
		c = append(c, table.ColumnConfig{
			Name:        column[i],
			Align:       text.AlignCenter,
			AlignHeader: text.AlignCenter,
			AlignFooter: text.AlignCenter,
		})
	}
	d.T.SetColumnConfigs(c)
}
居中效果如下,这样既能保留列合并又完成了剧中设置:
+---+----------+-------+-------------+------------+------------+
|   | IP       |  NUM  | PACKETSRECV | PACKETLOSS |   AVGRTT   |
+---+----------+-------+-------------+------------+------------+
| 1 | 10.0.0.1 |   5   |      1      |      1     |  AppendRow |
+---+----------+-------+-------------+------------+            |
| 2 | 10.0.0.2 |   6   |      2      |      2     |            |
+---+----------+-------+-------------+------------+------------+
| 3 | 10.0.0.1 |   5   |      1      |      1     | AppendRows |
+---+----------+-------+-------------+------------+            |
| 4 | 10.0.0.2 |   6   |      2      |      2     |            |
+---+----------+-------+-------------+------------+------------+
|   |                    TOTAL                    |      4     |
+---+---------------------------------------------+------------+
数字自动高亮标红
在我的应用场景中,ping的ip如果出现了丢包情况,那就要红色高亮,方便使用者马上关注到,这种情况下,可以通过Transformer来设置:
func (d *Demo) SetWarnColor() {
	// 字体颜色
	WarnColor := text.Colors{text.BgRed}
	warnTransformer := text.Transformer(func(val interface{}) string {
		if val.(float64) > 0 {
			// 统计丢包服务器总数
			return WarnColor.Sprintf("%.2f%%", val)
		}
		return fmt.Sprintf("%v%%", val)
	})

	d.T.SetColumnConfigs([]table.ColumnConfig{
		{
			Name:        "PacketLoss",
			AutoMerge:   true,
			Align:       text.AlignCenter,
			AlignHeader: text.AlignCenter,
			AlignFooter: text.AlignCenter,
			Transformer: warnTransformer,
		},
	})
}
实际效果如下:
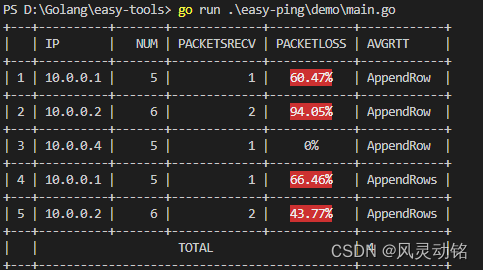
完整Demo代码
package main

import (
	"fmt"
	"math/rand"

	"github.com/jedib0t/go-pretty/v6/table"
	"github.com/jedib0t/go-pretty/v6/text"
)

var count = 0

type Demo struct {
	T table.Writer
}

func NewDemo() *Demo {
	return &Demo{
		T: table.NewWriter(),
	}
}

func (d *Demo) MakeHeader() {
	header := table.Row{"IP", "Num", "PacketsRecv", "PacketLoss", "AvgRtt"}
	d.T.AppendHeader(header)
	d.T.SetAutoIndex(true)
	// d.T.SetStyle(table.StyleLight)
	d.T.Style().Options.SeparateRows = true
}

func (d *Demo) AddTitle() {
	d.T.SetTitle("This is Easy Table")
}

func (d *Demo) AppendRow() {
	// rowConfig := table.RowConfig{AutoMerge: true}
	for i := 1; i <= 2; i++ {
		row := table.Row{fmt.Sprintf("10.0.0.%v", i), i + 4, i, rand.Float64() * 100, "AppendRow"}
		count += 1
		d.T.AppendRow(row)
	}
	d.T.AppendRow(table.Row{fmt.Sprintf("10.0.0.%v", 4), 1 + 4, 1, 0.0, "AppendRow"})
}

func (d *Demo) AppendRows() {
	var rows []table.Row
	for i := 1; i <= 2; i++ {
		rows = append(rows, table.Row{fmt.Sprintf("10.0.0.%v", i), i + 4, i, rand.Float64() * 100, "AppendRows"})
		count += 1
	}
	d.T.AppendRows(rows)
}

func (d *Demo) AppendFooter() {
	d.T.AppendFooter(table.Row{"Total", "Total", "Total", "Total", count}, table.RowConfig{AutoMerge: true, AutoMergeAlign: text.AlignCenter})
}

func (d *Demo) ColumnMerge() {
	d.T.SetColumnConfigs([]table.ColumnConfig{
		{
			Name: "AvgRtt",
			// Number是指定列的序号
			// Number: 5,
			AutoMerge: true,
			Align:     text.AlignCenter,
		},
	})
}

func (d *Demo) SetAlignCenter() {
	column := []string{"IP", "Num", "PacketsRecv", "PacketLoss", "AvgRtt"}
	c := []table.ColumnConfig{}

	// 根据表格的列数循环进行设置,统一居中
	for i := 1; i <= len(column); i++ {
		name := column[i-1]
		if name == "AvgRtt" {
			c = append(c, table.ColumnConfig{
				Name:        "AvgRtt",
				AutoMerge:   true,
				Align:       text.AlignCenter,
				AlignHeader: text.AlignCenter,
				AlignFooter: text.AlignCenter,
			})
			continue
		}
		c = append(c, table.ColumnConfig{
			Name:        column[i],
			Align:       text.AlignCenter,
			AlignHeader: text.AlignCenter,
			AlignFooter: text.AlignCenter,
		})
	}
	d.T.SetColumnConfigs(c)
}

func (d *Demo) SetWarnColor() {
	// 字体颜色
	WarnColor := text.Colors{text.BgRed}
	warnTransformer := text.Transformer(func(val interface{}) string {
		if val.(float64) > 0 {
			// 统计丢包服务器总数
			return WarnColor.Sprintf("%.2f%%", val)
		}
		return fmt.Sprintf("%v%%", val)
	})

	d.T.SetColumnConfigs([]table.ColumnConfig{
		{
			Name:        "PacketLoss",
			AutoMerge:   true,
			Align:       text.AlignCenter,
			AlignHeader: text.AlignCenter,
			AlignFooter: text.AlignCenter,
			Transformer: warnTransformer,
		},
	})
}

func (d *Demo) Print() {
	fmt.Println(d.T.Render())
}

func main() {
	demo := NewDemo()
	demo.MakeHeader()

	// demo.AddTitle()
	demo.AppendRow()
	demo.AppendRows()
	// demo.ColumnMerge()
	demo.AppendFooter()
	// demo.SetAlignCenter()
	demo.SetWarnColor()
	demo.Print()
}
结语
本文介绍了使用第三方库美化Golang的命令行表格格式化输出,除了table以外,go-pretty库中还包含了进度条、列表等美化方法,感兴趣可以自己看看官方文档。


 4907
4907


 被折叠的 条评论
为什么被折叠?
被折叠的 条评论
为什么被折叠?
 到【灌水乐园】发言


