


一、概念
path 元素是用来绘制各种形状(例如线条、曲线、弧形、圆弧等)的元素。path 元素的 d 属性用来定义绘制的路径。具体来说,d 属性是一个字符串,包含一系列的命令和参数,用来描述路径的形状。
1.1 d属性
| M=moveto(M x,y) | 将画笔移到相对于svg的坐标位置 |
| L=lineto(L x,y) | 画直线到指定的坐标位置 |
| H=horizontal lineto(H x) | 画水平线到指定x坐标位置 |
| V=vertical lineto(V y) | 画垂直线到指定的y坐标位置 |
| Z=closepath() | 关闭路径 |
<svg>
  <path d="M 10 10 L 100 10 L 100 100 L 10 100 Z" />
</svg>
M 10 10表示将画笔移动到坐标为 (10, 10) 的点。L 100 10表示从当前点绘制一条直线到坐标为 (100, 10) 的点。L 100 100和L 10 100依次表示绘制两条直线。Z表示关闭路径,即从当前点绘制一条直线到路径的起点,完成矩形的绘制。
1.2 path生成器
d3.line().x().y()//折线图

d3.geoPath().projection()//用于地图

d3.area()// 绘制平面

d3.arc().innerRadius().outerRadius() //饼图

d3.lineRadial().angle().radius() //极坐标系
文档:https://github.com/d3/d3-shape/tree/v1.3.7
案例
调试的时候把定时器的时间设置的比transition短很多,感觉图像每次都没画到位,在这停了好久。。太蠢了。。
最后那个所有折线的汇总和颜色标签是修改了源代码自己添加的效果,学有成效就好~
<!DOCTYPE html>
<html>
  <head>
    <title>Line</title>

  </head>
  <body>
    <svg width="1600" height="800" id="mainsvg" class="svgs"></svg>
    <script src="/static/js/d3.min.js"></script>
    <script src="https://d3js.org/d3.v7.min.js"></script>
    <script>
      const svg = d3.select('#mainsvg');
      const width = +svg.attr('width');
      const height = +svg.attr('height');
      const margin = {top: 120, right: 160, bottom: 50, left: 150};
      const innerWidth = width - margin.left - margin.right;
      const innerHeight = height - margin.top - margin.bottom;
      const g = svg.append('g').attr('id', 'maingroup')
      .attr('transform', `translate(${margin.left}, ${margin.top})`);
      const xValue = (datum) => {return datum['日期']};
      const yValue = (datum) => {return datum['现有确诊']};
      let xScale, yScale;
      let alldates;
      let allkeys;
      const yAxisLabel = '现有确诊人数';

      const colors = [
        '#FF0000', '#FFA500', '#FFFF00', '#008000', '#00FFFF', '#0000FF', '#FF00FF',
        '#800080', '#C0C0C0', '#808080', '#800000', '#FFD700', '#00FF00', '#00CED1',
        '#1E90FF', '#ADD8E6', '#FFC0CB', '#FA8072', '#FFA07A', '#FF69B4', '#8B008B',
        '#EE82EE', '#8FBC8F', '#3CB371', '#BDB76B', '#CD5C5C', '#F0E68C', '#7B68EE',
        '#4169E1', '#A0522D', '#2F4F4F', '#D3D3D3', '#4682B4'
      ];

      const provinces1 = ["安徽","澳门","北京","福建","甘肃","广东","广西","贵州",
        "海南","河北" ,"河南","黑龙江","湖南" ,"吉林","江苏","江西","辽宁","内蒙古",
        "宁夏","青海","山东","山西","陕西","上海","四川","台湾","天津","西藏","香港",
        "新疆","云南","浙江","重庆"
      ]


      const render_init = function(data){
        xScale = d3.scaleTime() //与scaleLiner()相似,但是domain必须是日期
        .domain(d3.extent(data, xValue))
        .range([0, innerWidth])
        .nice();

        yScale = d3.scaleLinear()
        .domain([d3.max(data, yValue), d3.min(data, yValue)])
        .range([0, innerHeight])
        .nice();

        // Adding axes
        const xAxis = d3.axisBottom(xScale)
        .ticks(Math.floor(alldates.length) / 4)
        //.tickFormat(d3.timeFormat('%b-%d'))
        .tickSize(-innerHeight)
        const xAxisGroup = g.append('g').call(xAxis)
        .attr('transform', `translate(0, ${innerHeight})`);

        const yAxis = d3.axisLeft(yScale).tickSize(-innerWidth);
        const yAxisGroup = g.append('g')
        .call(yAxis)
        .append('text')
        .attr('font-size', '2em')
        .attr('transform', `rotate(-90)`)
        .attr('x', -innerHeight / 2)
        .attr('y', -60)
        .attr('fill', '#333333')
        .text(yAxisLabel)
        .attr('text-anchor', 'middle') // Make label at the middle of axis.
        yAxisGroup.selectAll('.domain').remove(); // we can select multiple tags using comma to seperate them and we can use space to signify nesting;


        g.selectAll('.tick text').attr('font-size', '2em');
        g.append('path').attr('id', 'alterPath');


        let legend = d3.select('#maingroup').selectAll(".legend")
        .data(provinces1)
        .enter().append("g")
        .attr("class", "legend")
        .attr("transform", function(d, i) {
          if(i >= 20)return "translate(" + (innerWidth + 90) + "," + ((i - 20) * 25) + ")"
          return "translate(" + (innerWidth + 10) + "," + (i * 25) + ")"; });

        // draw legend colored rectangles
        legend.append("rect")
        .datum(provinces1)
        .attr("x", 0)
        .attr("y", 0)
        .attr("width", 20)
        .attr("height", 20)
        .style("fill", function (d,i) {return colors[i]});

        // draw legend text
        legend.append("text")
        .datum(provinces1)
        .attr('class', 'legend_text')
        .attr("x", 30)
        .attr("y", 9)
        .attr("dy", ".5em")
        .style("text-anchor", "start")
        .text(function (d,i) { return provinces1[i]});
      };

      // const render_update = function(data){
      //     const line = d3.line()
      //     .x(d => {return xScale(xValue(d))})
      //     .y(d => {return yScale(yValue(d))})
      //     .curve(d3.curveCardinal.tension(0.5))

      //     // lineEmpty is typically used for the first animation that raise the line up;
      //     const lineEmpty = d3.line()
      //     .x(d => {return xScale(xValue(d))})
      //     .y(d => {return yScale(0)})
      //     .curve(d3.curveCardinal.tension(0.5))

      //     const maingroup = d3.select('#maingroup');
      //     const pathupdate = maingroup.selectAll('.datacurve').data([data])

      //     const pathenter = pathupdate.enter().append('path')
      //     .attr('class', 'datacurve')
      //     .attr("fill", "none")
      //     .attr("stroke", "steelblue")
      //     .attr("stroke-width", 2.5)
      //     .attr("d", lineEmpty)

      //     pathupdate.merge(pathenter)
      //     .transition().duration(2000).ease(d3.easeLinear)
      //     .attr("d", line)
      // };

      const render_update_alter = function(data, color){
        console.log(data)
        const line1 = d3.line()
          .x(d => {return xScale(xValue(d))})
          .y(d => {return yScale(yValue(d))})
          //.curve(d3.curveBasis)
          .curve(d3.curveCardinal.tension(0.5)) //把离散点连成线

        // See https://github.com/d3/d3-shape/blob/v1.3.7/README.md#curves
        d3.select('#alterPath').datum(data) //data()绑定的是数组 datum()绑定的是单个数据
        .attr('class', 'datacurve')
        .attr("fill", "none") //设置填充为无
        .attr("stroke", color) //画笔颜色
        .attr("stroke-width", 1.5) //画笔宽度
        .transition().duration(2000) //这个要设置的比定时器时间短
        .attr("d", line1) //line的输入就是数据绑定的图元

        province = data[0]['省份'];
        g.selectAll('.province_text').remove();
        g.append("text")
        .data(data)
        .attr('class', 'province_text')
        .attr("x", innerWidth / 4)
        .attr("y", - 20)
        .style("text-anchor", "end")
        .attr("fill", "lightskyblue")
        .attr('font-size', '4em')
        .attr('font-weight', 'bold')
        .text('省份:'+province);
      }

      const renderEnd = function(data, color){
        const line = d3.line()
          .x(d => {return xScale(xValue(d))})
          .y(d => {return yScale(yValue(d))})
          //.curve(d3.curveBasis)
          .curve(d3.curveCardinal.tension(0.5))

        g.append('path').datum(data) //data()绑定的是数组 datum()绑定的是单个数据
        .attr("class", "datacurve")
        .attr("fill", "none") //设置填充为无
        .attr("stroke", color) //画笔颜色
        .attr("stroke-width", 1.5) //画笔宽度
        .attr("d", line) //line的输入就是数据绑定的图元


      }

      d3.csv('./province.csv').then(function(data){

        //暂时删除湖北 数据太大会影响比例
        data = data.filter(datum => {return datum['省份'] !== '总计'});
        data = data.filter(datum => {return datum['省份'] !== '湖北'});
        //日期要单独拿出来做横轴的比例尺
        alldates = Array.from(new Set( data.map( d => xValue(d) ) ));

        //数据类型转换
        data.forEach( datum => {
          datum['现有确诊'] = +(datum['现有确诊']);
          datum['日期'] = new Date(datum['日期']);
        } );

        let provinces = {};
        allkeys = Array.from(new Set( data.map( d => d['省份'] ) ))
        console.log(allkeys)
        allkeys.forEach( key => {provinces[key] = []} );
        //数据按照省份归类
        data.forEach( d => { provinces[d['省份']].push(d) } )
        //确保每个省份的数据按照日期顺序排序
        allkeys.forEach( key => provinces[key].sort(function(a,b){
              return a['日期'] - b['日期'];
        }));
        render_init(data);
        let c = 0;
        let intervalId = setInterval(() => {
            if(c >= allkeys.length){
                clearInterval(intervalId);
                g.selectAll('.province_text').remove();
                g.selectAll('#alterPath').remove();
                let i = 0
                allkeys.forEach(item => {
                  renderEnd(provinces[item],colors[i])
                  i++
                })
            }else{
                let key = allkeys[c];
                render_update_alter(provinces[key], colors[c]);
                c = c + 1;
            }
        }, 3000);
      });

    </script>
  </body>
</html>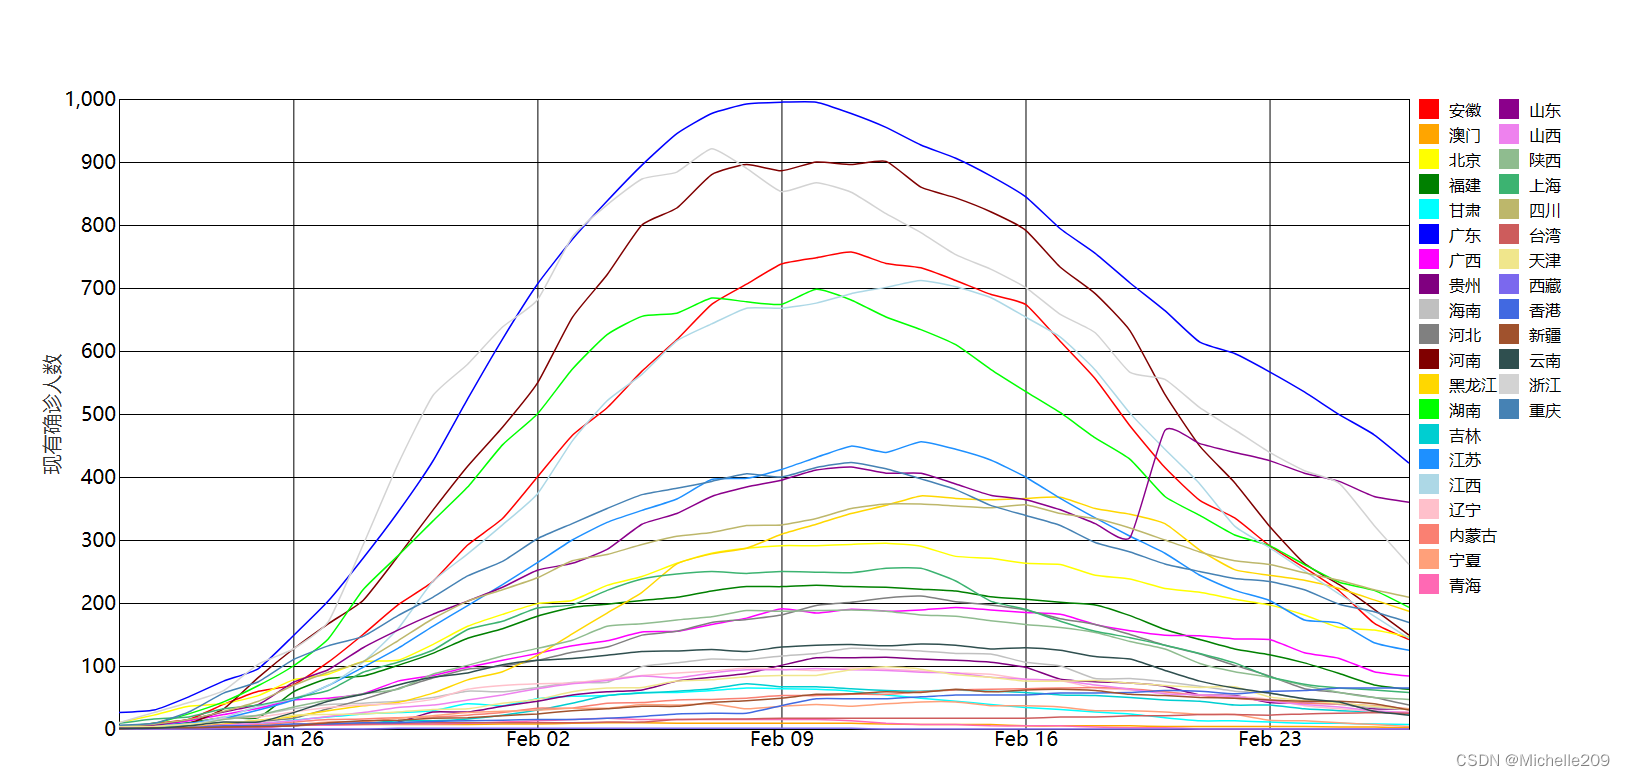


 3123
3123


 被折叠的 条评论
为什么被折叠?
被折叠的 条评论
为什么被折叠?
 到【灌水乐园】发言


