Openpyxl 模块
1. 面积图 Area Chart
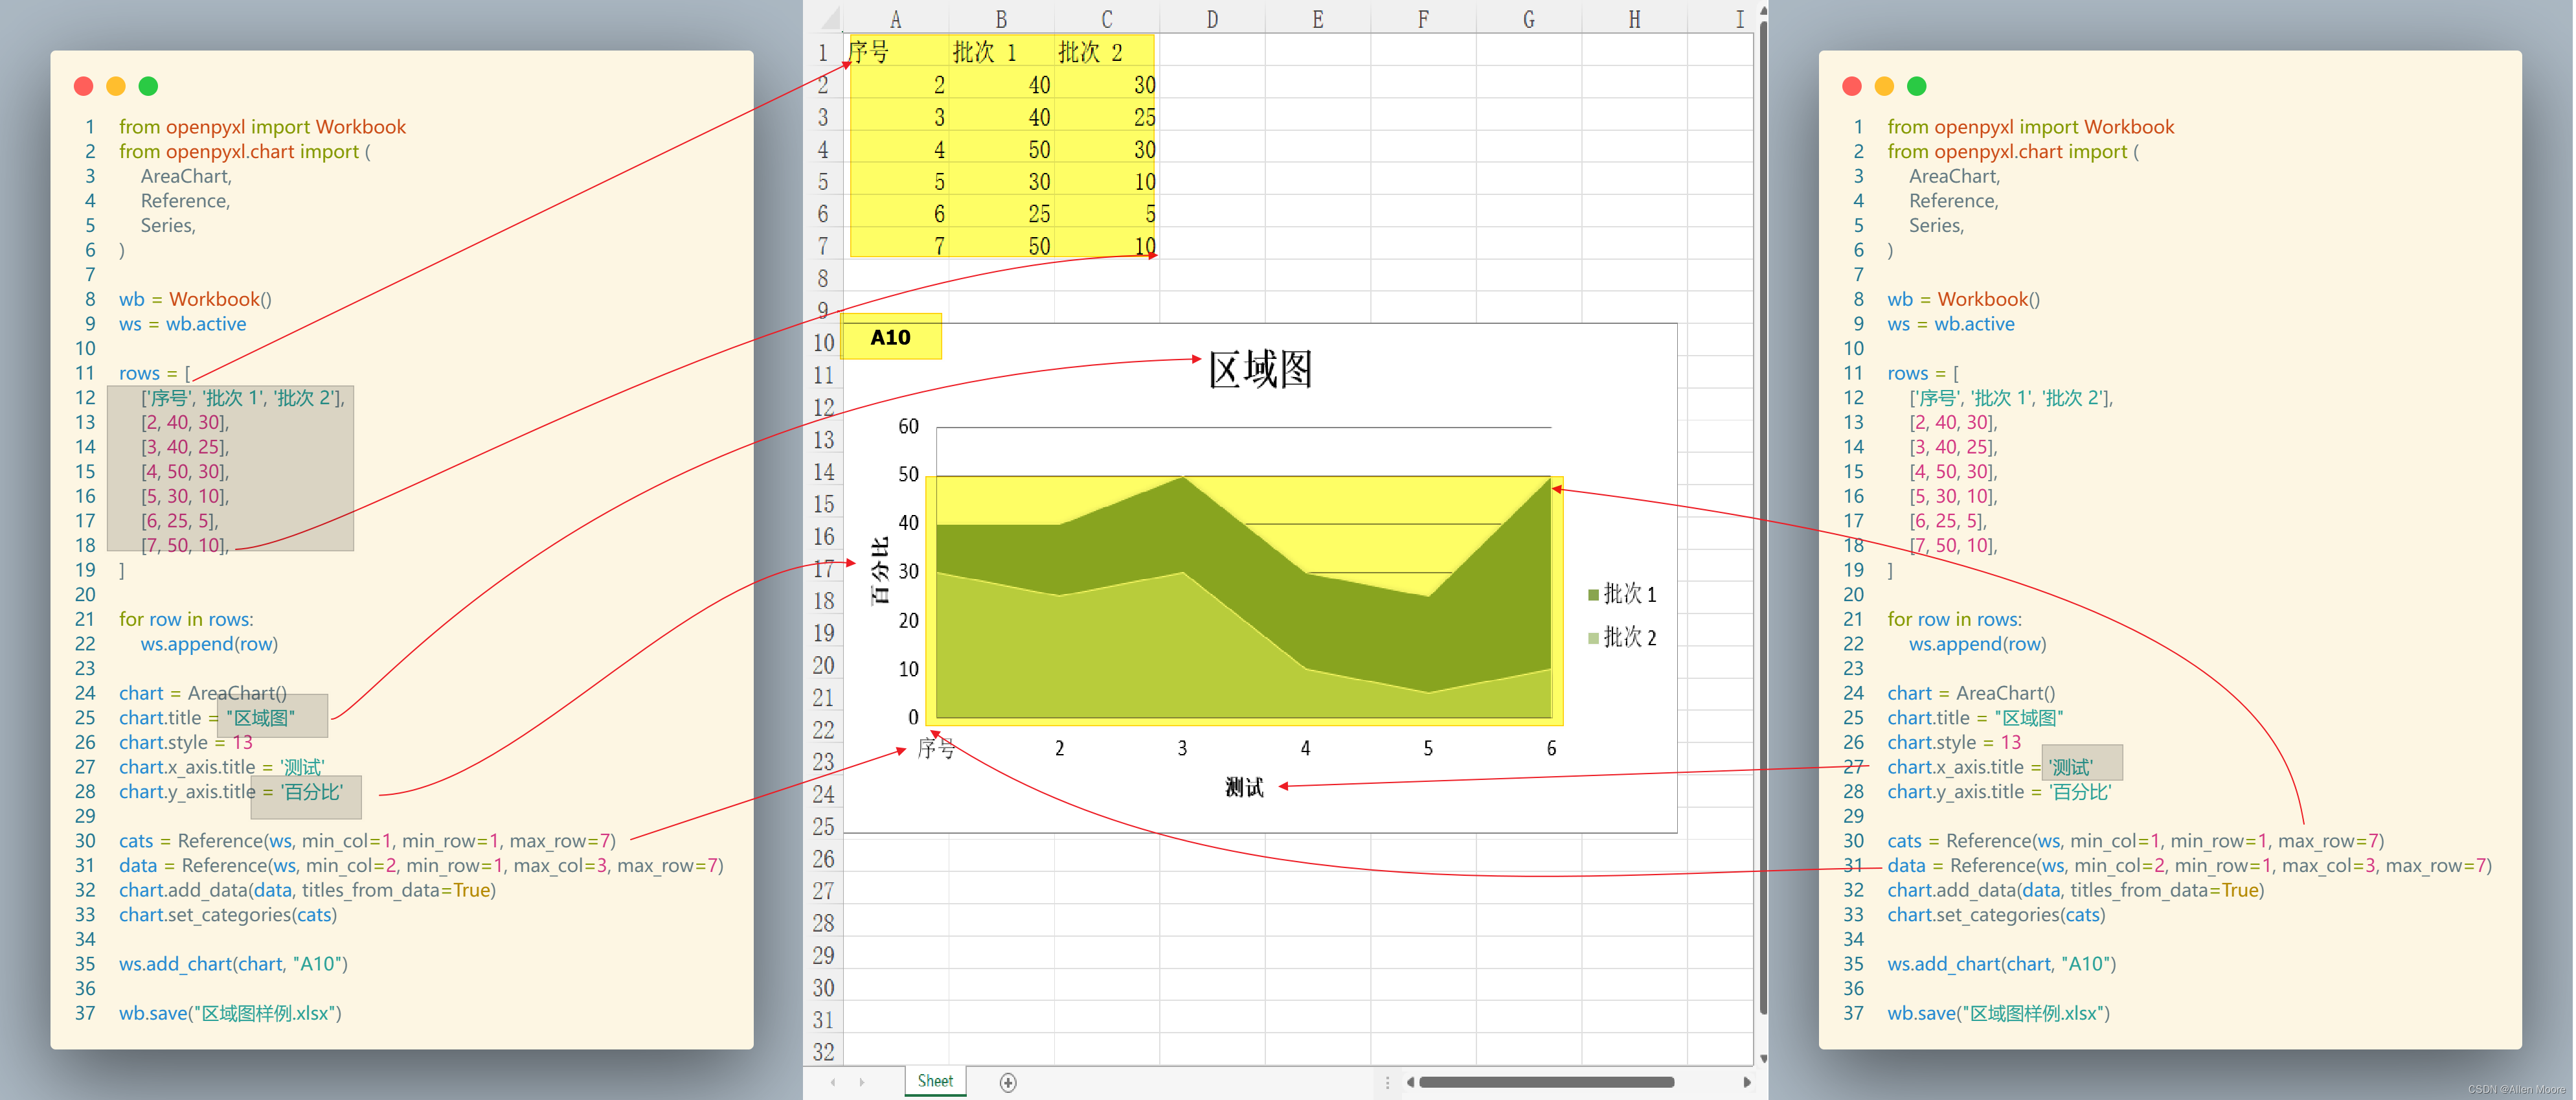
from openpyxl import Workbook
from openpyxl.chart import (
    AreaChart,
    Reference,
    Series,
)

wb = Workbook()
ws = wb.active

rows = [
    ['序号', '批次 1', '批次 2'],
    [2, 40, 30],
    [3, 40, 25],
    [4, 50, 30],
    [5, 30, 10],
    [6, 25, 5],
    [7, 50, 10],
]

for row in rows:
    ws.append(row)

chart = AreaChart()
chart.title = "区域图"
chart.style = 13
chart.x_axis.title = '测试'
chart.y_axis.title = '百分比'

cats = Reference(ws, min_col=1, min_row=1, max_row=7)
data = Reference(ws, min_col=2, min_row=1, max_col=3, max_row=7)
chart.add_data(data, titles_from_data=True)
chart.set_categories(cats)

ws.add_chart(chart, "A10")

wb.save("区域图样例.xlsx")


 3349
3349


 被折叠的 条评论
为什么被折叠?
被折叠的 条评论
为什么被折叠?
 到【灌水乐园】发言


