


文章目录
【-1】效果展示
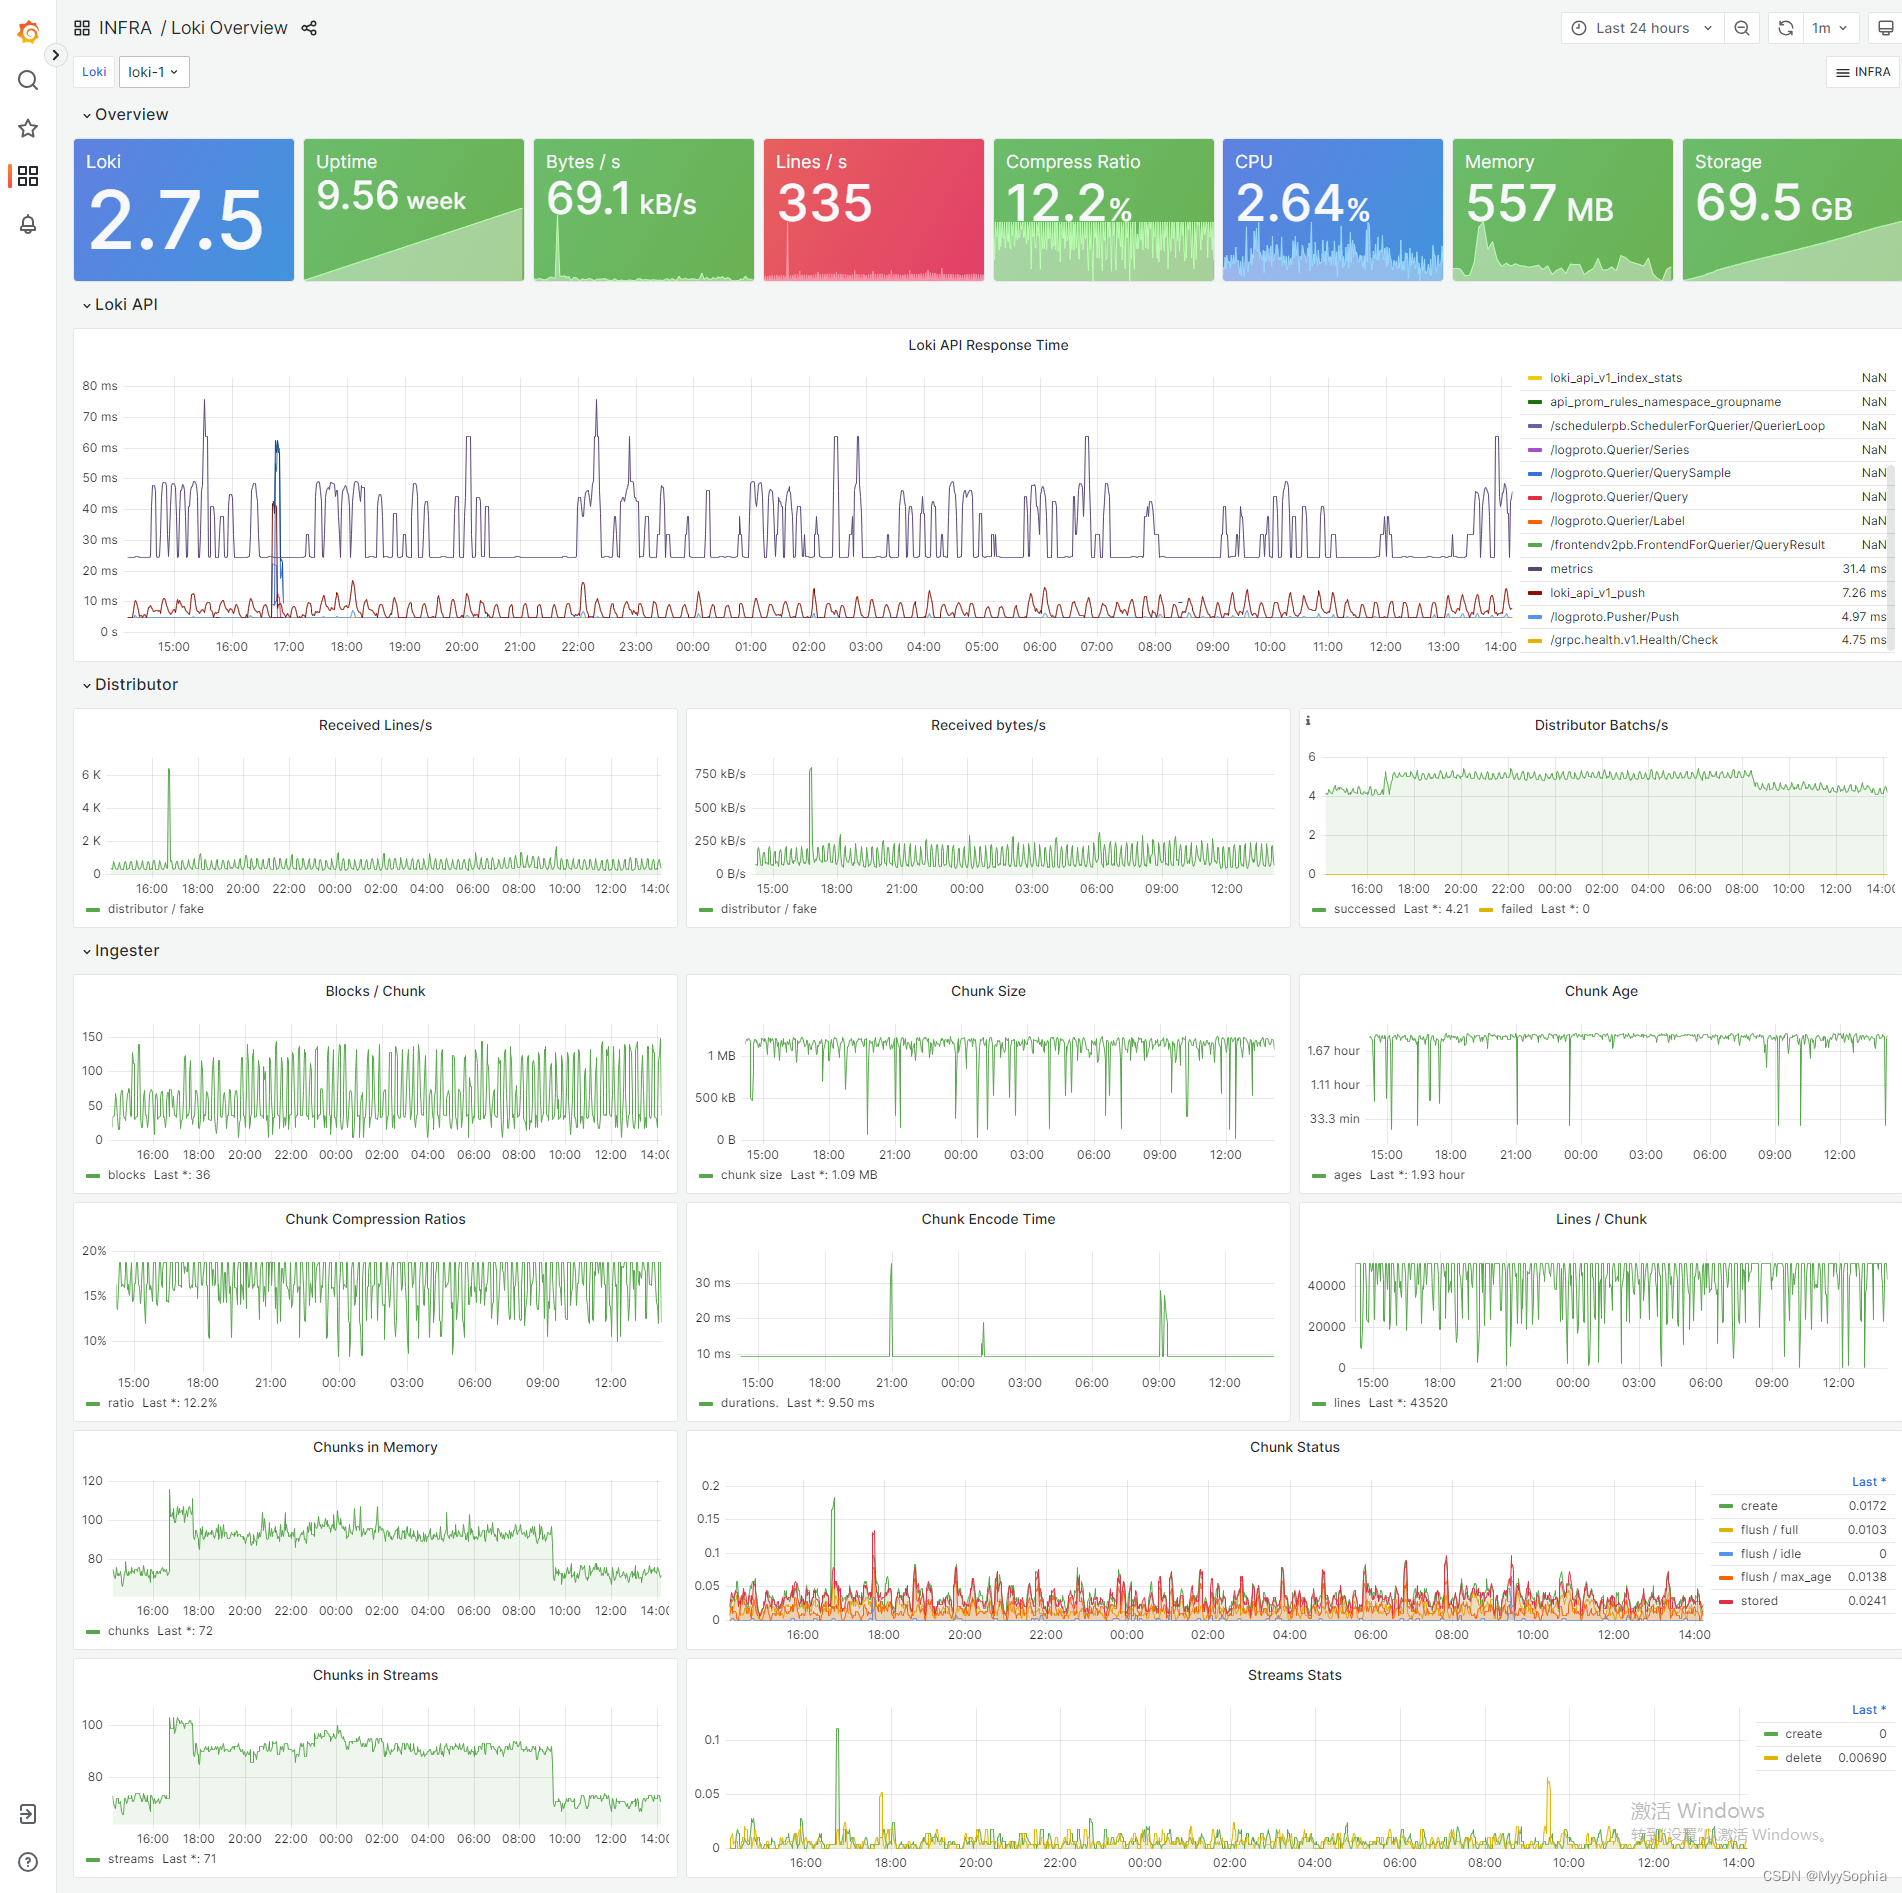
Loki 指标展示
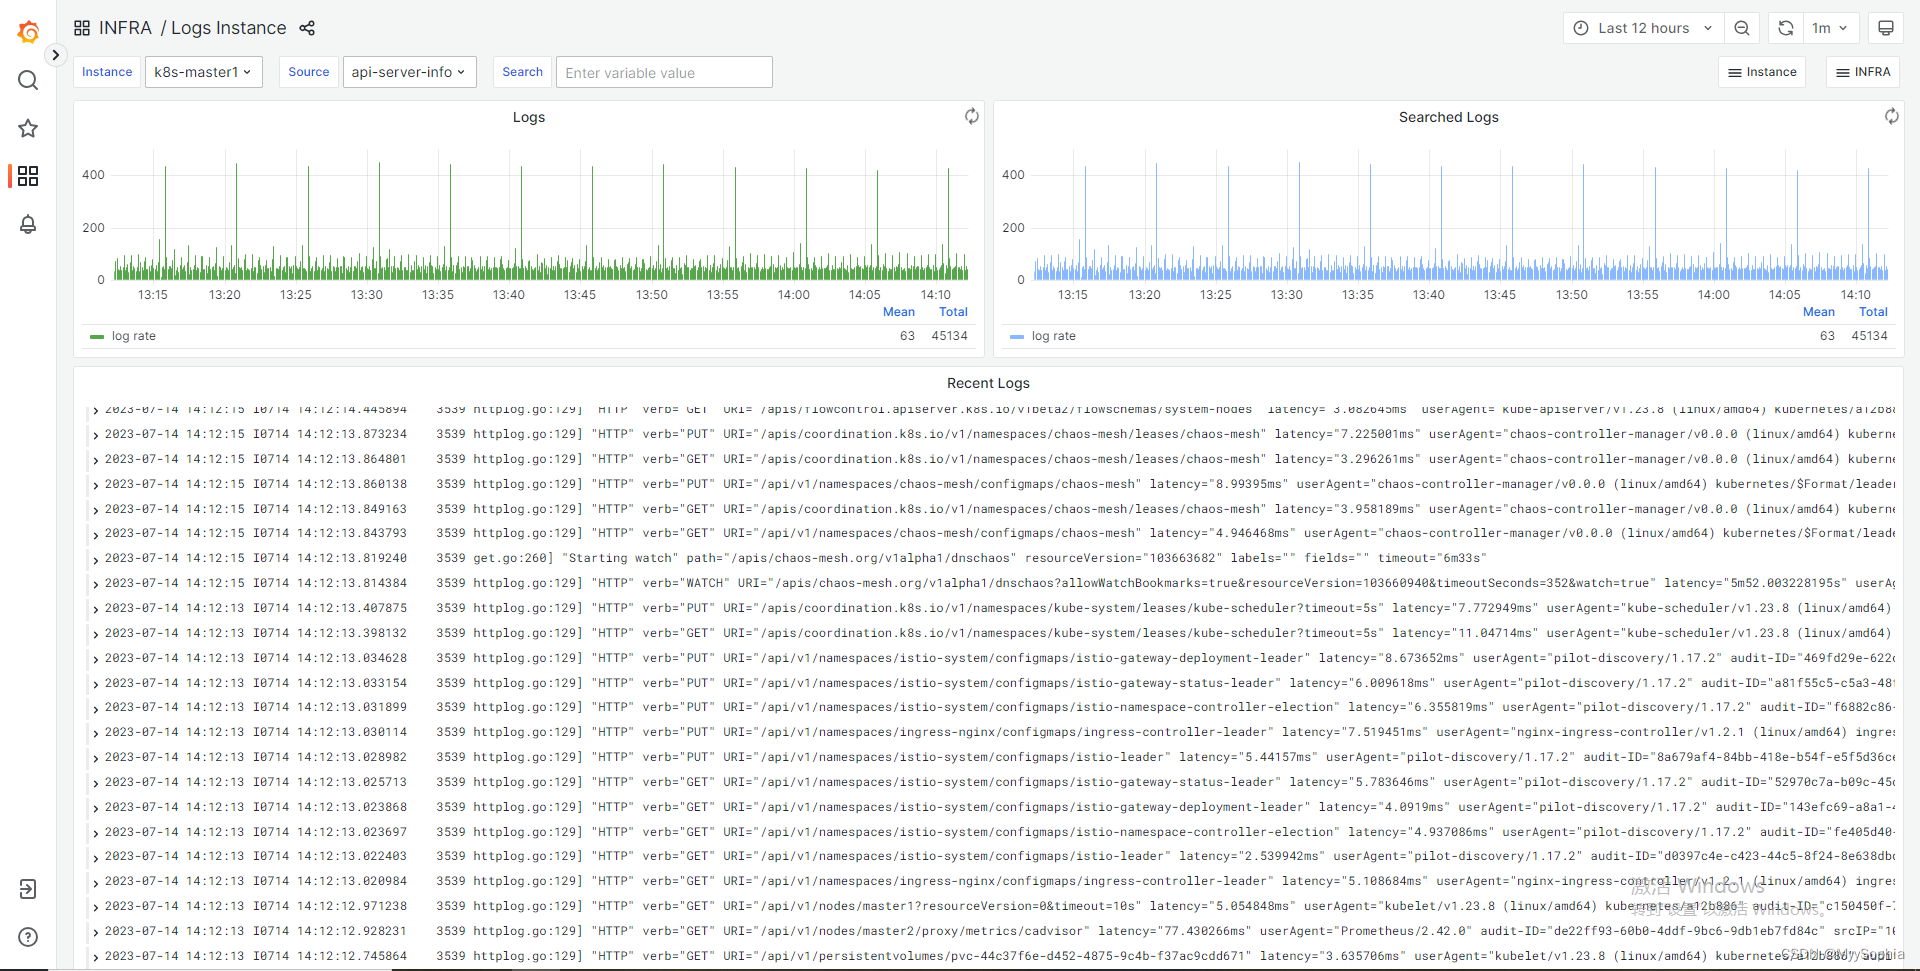
日志展示
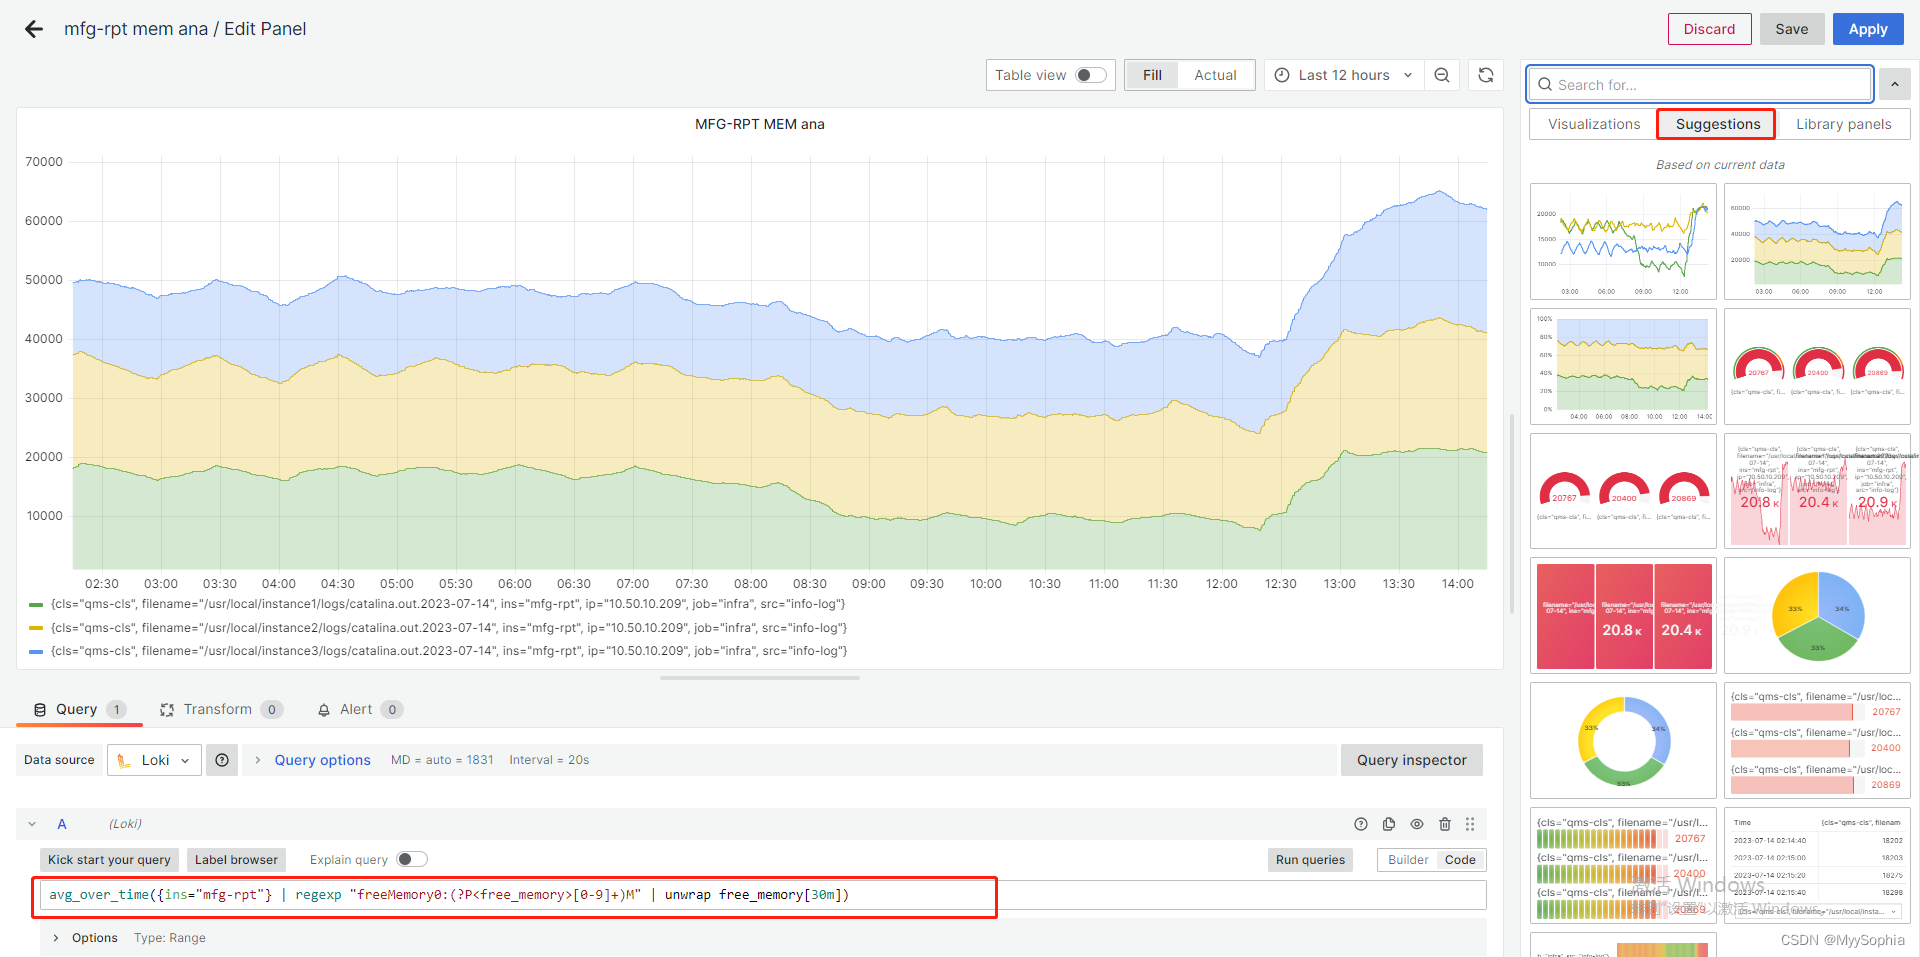
内存分析案例
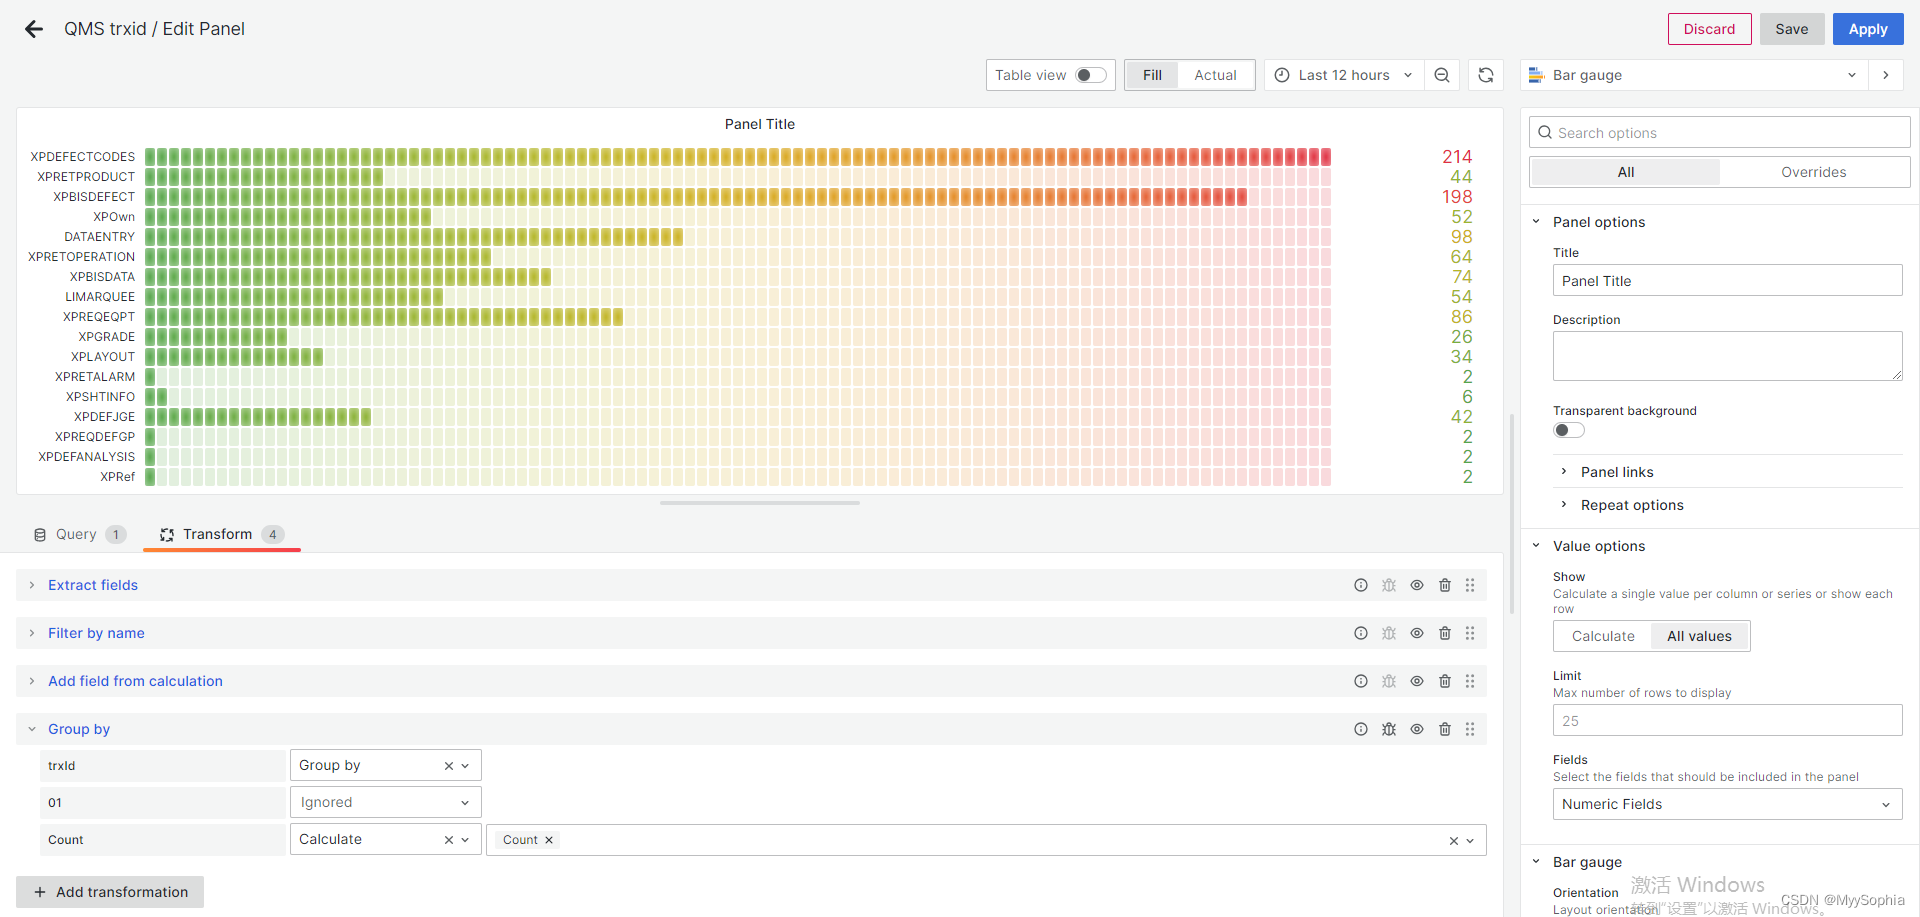
业务请求量分析统计
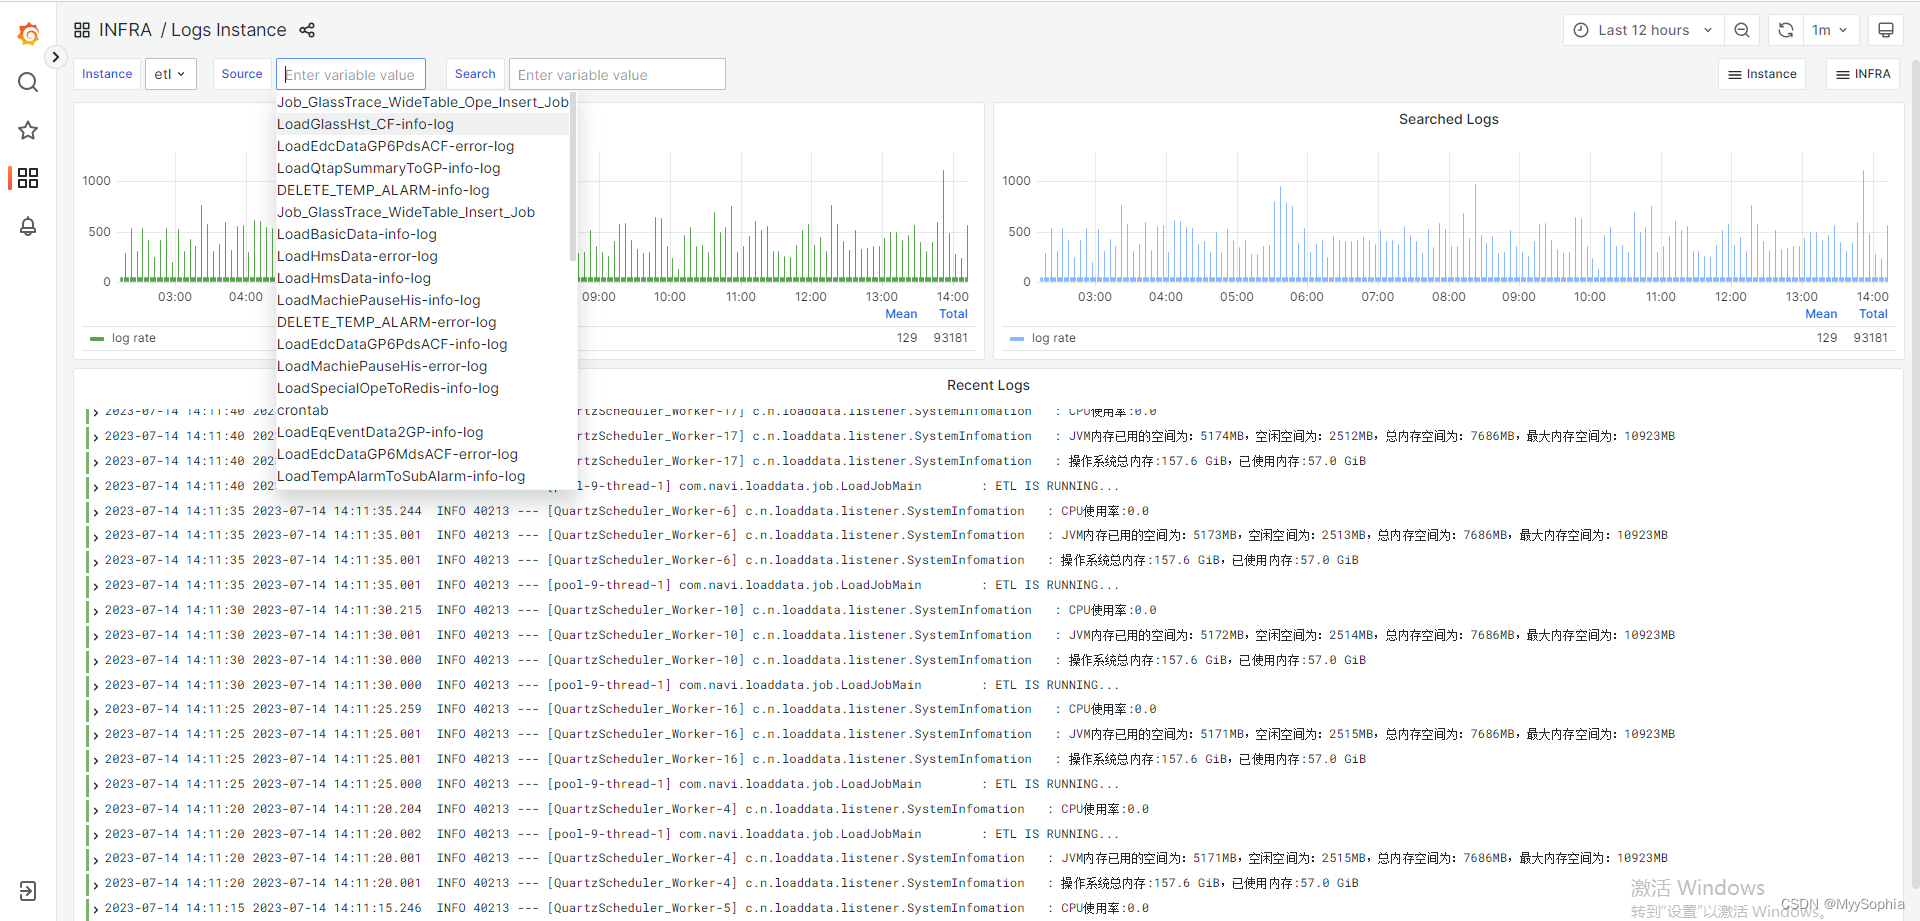
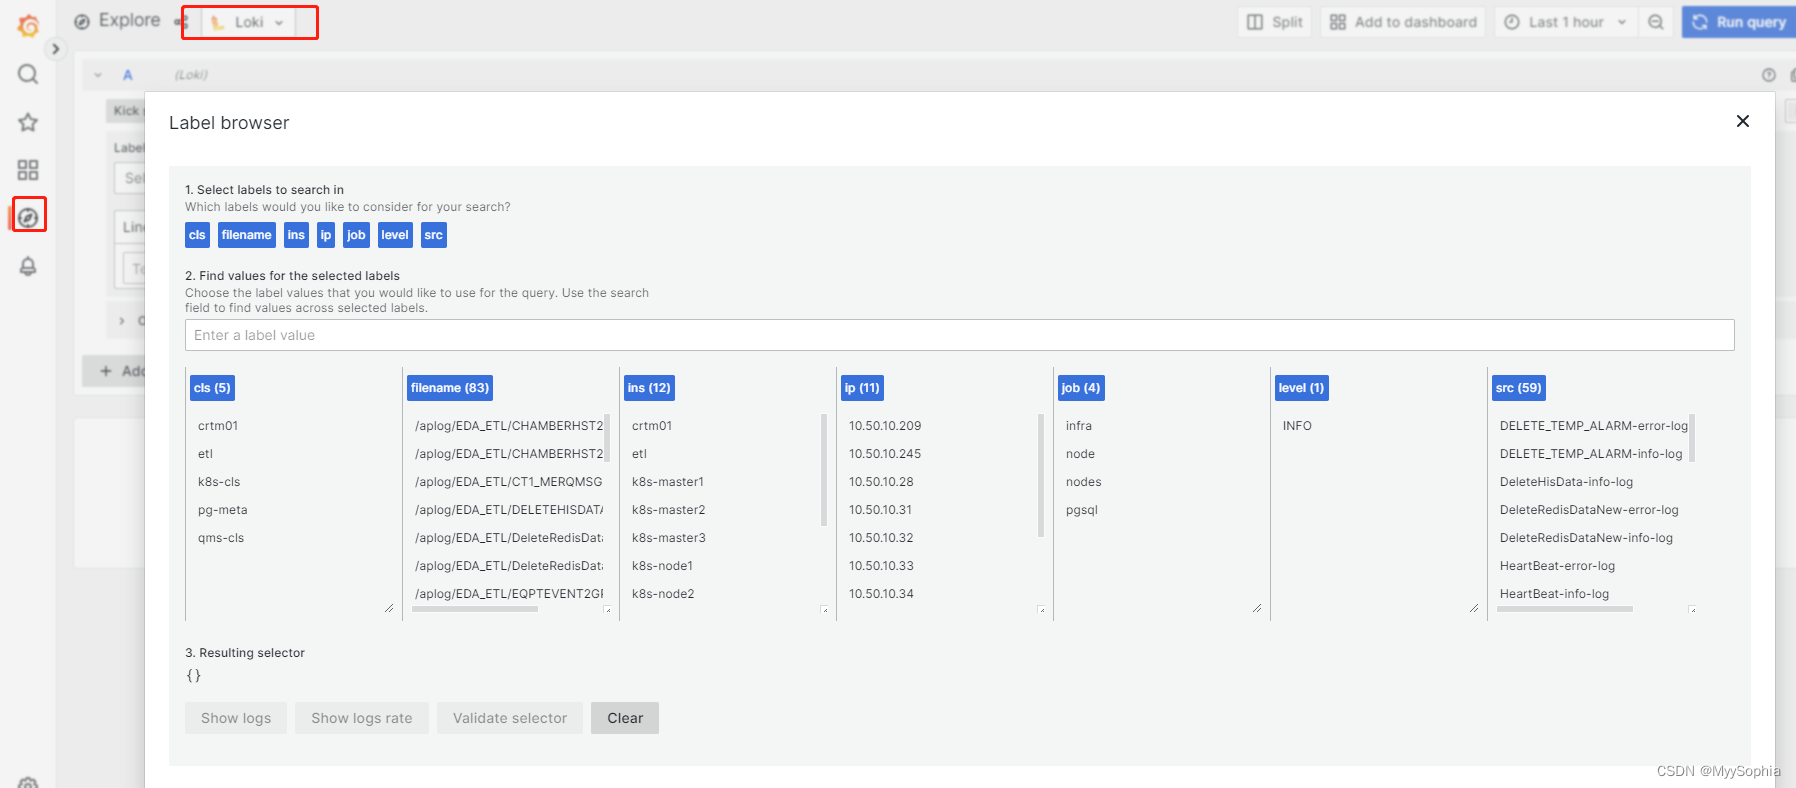
自由探索日志
【0】简介
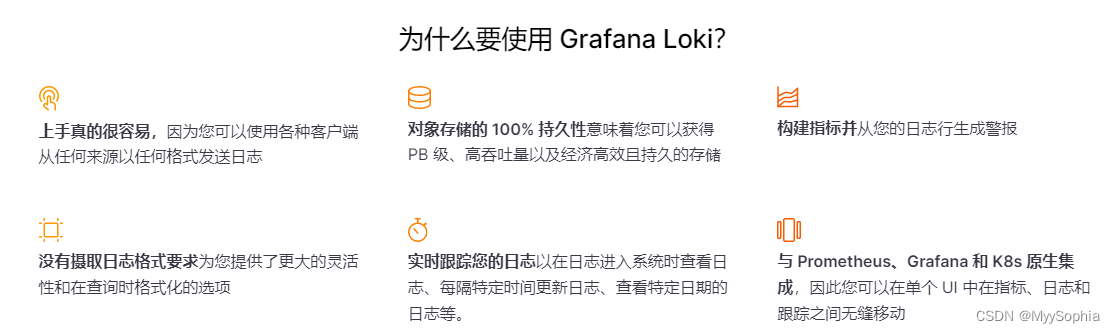
GLP全称: grafana loki promtail, 一个轻量级的云原生日志检索系统。
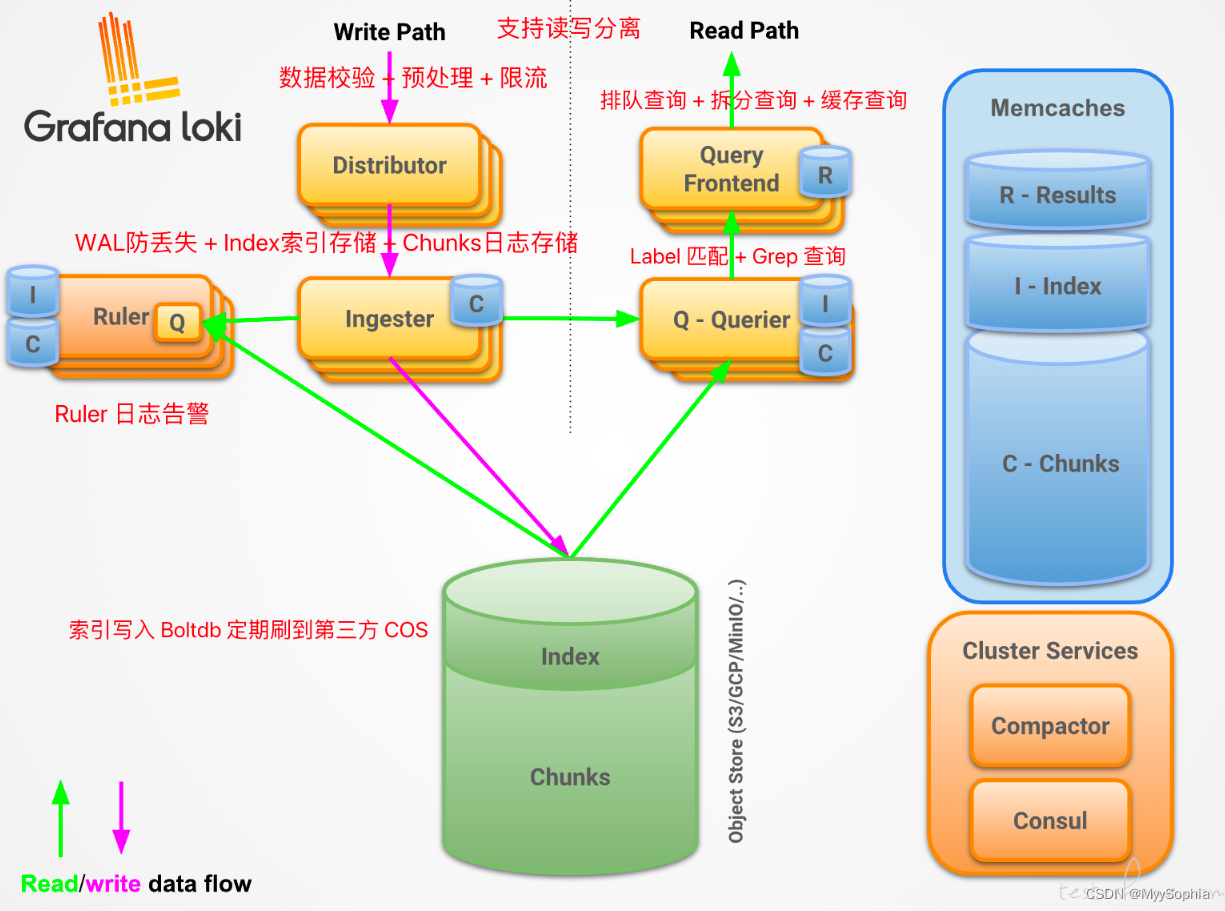
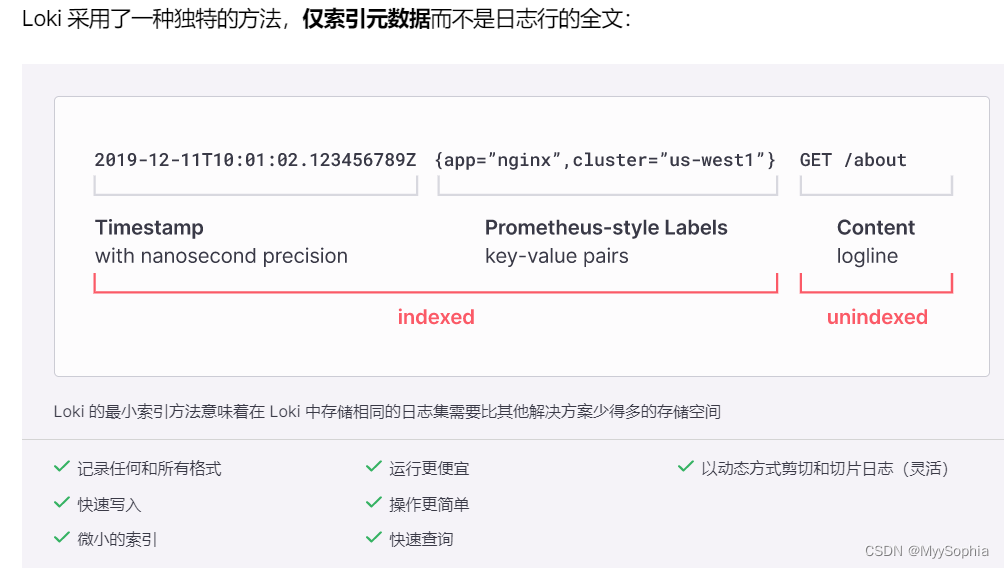
对于数据,Loki 不会构建全文索引,而是通过 Label 的方式去构建索引,并通过 Grep 查询匹配对应的 COS。
对于存储,Index 和 Chunks,是可以刷到廉价的第三方 COS 对象存储中。
这样跟 ELK 一对比,成本的优化是巨大的。
且在 Loki 2.0 版本之后,对于 Boltdb 存储索引做了较大的升级,采取 Boltdb-shipper 模式,可以直接让 Loki 索引存储在 S3 中,无需 Cassandra。
考虑到当前压测日志业务场景无需支撑 TB 级别的检索,所以设计一套读写分离架构的非分布式 Loki 服务即可。
架构如下
grafana学习
自定义查询按钮
每个查询按钮都定义在setting的JsonModel,如下图.
![[外链图片转存失败,源站可能有防盗链机制,建议将图片保存下来直接上传(img-4LcwBNas-1689312698415)(E:\book\Kubernetes\GLP技术栈学习\assets\image-20221017112236336.png)]](https://img-blog.csdnimg.cn/9678bb3ca0514c9dad5f431e819d4abb.png)
如果需要自定义查询条件在这里添加。
![[外链图片转存失败,源站可能有防盗链机制,建议将图片保存下来直接上传(img-YMj50erM-1689312698415)(E:\book\Kubernetes\GLP技术栈学习\assets\image-20221017112122769.png)]](https://img-blog.csdnimg.cn/495e088ba8fa4c97ba7009611c99b77f.png)
为什么不是ELK
Elasticsearch 是个开源分布式搜索引擎,对非结构化的数据,也能进行分词,倒排索引,从而提供快速的全文搜索。
所以这里存储的索引,是一个巨大的量级。
更关键的是,Elasticsearch 需要的是内存!
Elasticsearch 底层存储引擎是基于 Lucene,Lucene 的倒排索引,需要先在内存里生成,然后定期以段文件的形式刷到硬盘里。
所以 Elasticsearch 的堆内存最好不要超过物理机内存的一半,需要预留一半的内存给 Lucene 使用。
好用是好用,就是真的贵,构建一个 ELK 成本高。
所以在降本增效的主题下,PLG 成为了新贵!
ELK
优势:
1、功能丰富,允许复杂的操作
劣势:
1、主流的ELK(全文检索)或者EFK比较重
2、ES复杂的搜索功能很多都用不上 规模复杂,资源占用高,操作苦难
大多数查询只关注一定时间范围和一些简单的参数(如host、service等)
3、Kibana和Grafana之间切换,影响用户体验
4、倒排索引的切分和共享的成本较高
Loki
1、最小化度量和日志的切换成本
有助于减少异常事件的响应时间和提高用户的体验
2、在查询语言的易操作性和复杂性之间可以达到一个权衡
3、更具成本效益
【1】loki聚合组件
架构
![[外链图片转存失败,源站可能有防盗链机制,建议将图片保存下来直接上传(img-2wmB19NM-1689312698420)(E:\book\Kubernetes\GLP技术栈学习\assets\image-20221201085616885.png)]](https://img-blog.csdnimg.cn/95f26448f48b4aa2bafdce0882663178.png)
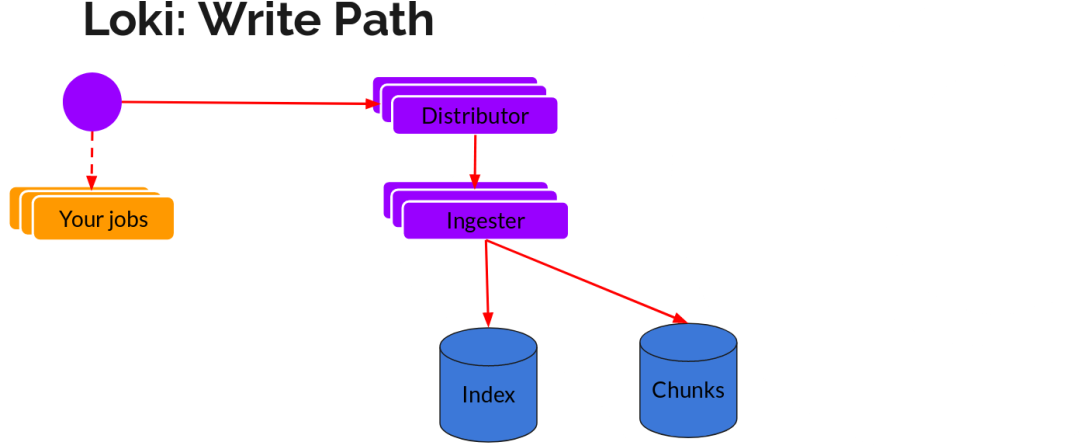
- Promtail开源客户端负责采集并上报日志;
- Distributor:日志写入入口,将数据转发到Ingester;
- Ingester:日志的写入服务,缓存并写入日志内容和索引到底层存储;
- Querier:日志读取服务,执行搜索请求。
读写
日志数据的写主要依托的是Distributor和Ingester两个组件,整体的流程如下:
Distributor
一旦promtail收集日志并将其发送给loki,Distributor就是第一个接收日志的组件。由于日志的写入量可能很大,所以不能在它们传入时将它们写入数据库。这会毁掉数据库。我们需要批处理和压缩数据。
Loki通过构建压缩数据块来实现这一点,方法是在日志进入时对其进行gzip操作,组件ingester是一个有状态的组件,负责构建和刷新chunck,当chunk达到一定的数量或者时间后,刷新到存储中去。每个流的日志对应一个ingester,当日志到达Distributor后,根据元数据和hash算法计算出应该到哪个ingester上面。
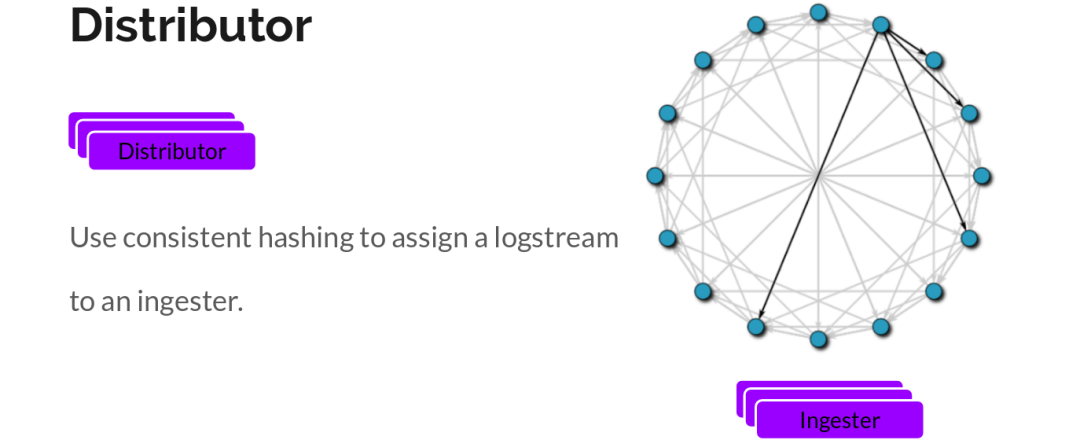
此外,为了冗余和弹性,我们将其复制n(默认情况下为3)次。
Ingester
Ingester接收到日志并开始构建chunk:
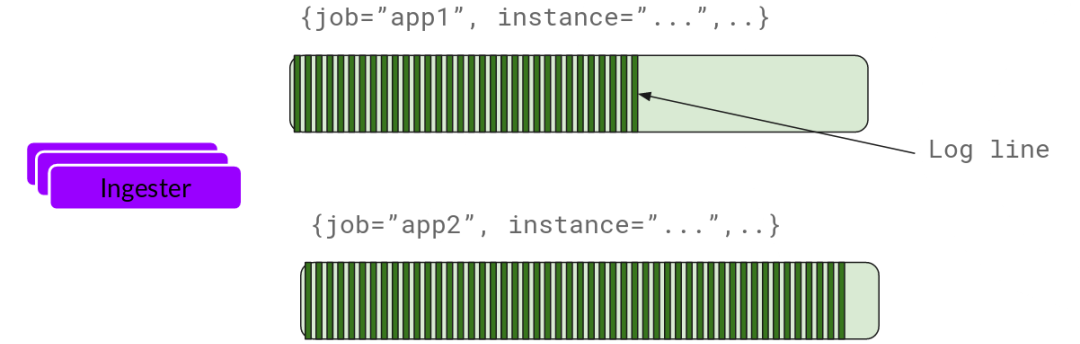
基本上就是将日志进行压缩并附加到chunk上面。一旦chunk“填满”(数据达到一定数量或者过了一定期限),ingester将其刷新到数据库。我们对块和索引使用单独的数据库,因为它们存储的数据类型不同。
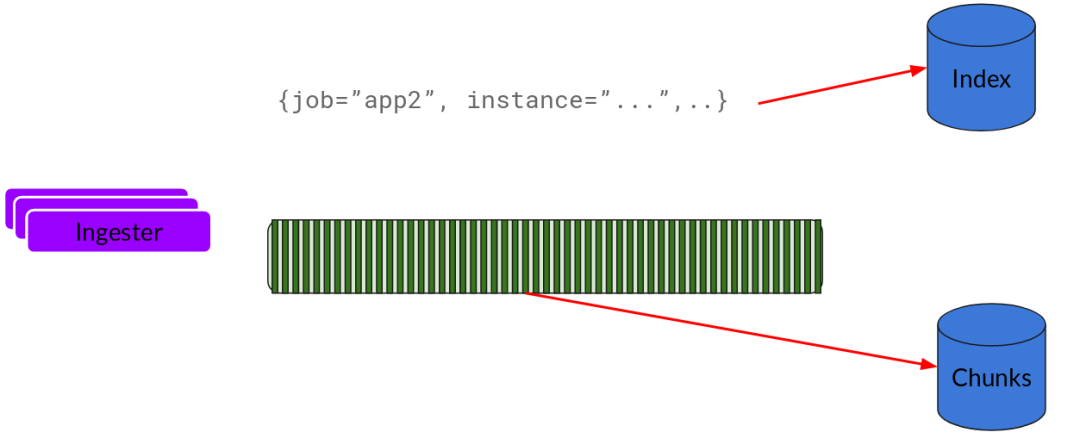
刷新一个chunk之后,ingester然后创建一个新的空chunk并将新条目添加到该chunk中。
Querier
读取就非常简单了,由Querier负责给定一个时间范围和标签选择器,Querier查看索引以确定哪些块匹配,并通过greps将结果显示出来。它还从Ingester获取尚未刷新的最新数据。
对于每个查询,一个查询器将为您显示所有相关日志。实现了查询并行化,提供分布式grep,使即使是大型查询也是足够的。

可以参考官方文档 Loki’s Architecture 进一步深入了解。最后,一句话形容下Loki就是like Prometheus, but for logs。
检查loki配置文件
loki -verify-config -config.file /etc/loki.yml

level=error ts=2022-11-15T09:12:09.045289153Z caller=main.go:52 msg="validating config" err="invalid queryrange config: the yaml flag `split_queries_by_interval` must now be set in the `limits_config` section instead of the `query_range` config section"
修改loki 的数据默认路径
生产中的log比较多,粗略估计日均50GB的日志. 需要将loki的数据目录更换至大的存储.
使用pigsty安装loki只需要修改pigsty.yml 中的统一配置即可.
    #-----------------------------------------------------------------
    # LOKI 2022年11月15日17:21:59
    #-----------------------------------------------------------------
    loki_enabled: true                # enable loki? only works on meta nodes
    loki_clean: false                 # whether remove existing loki data
    loki_endpoint: http://10.10.10.10:3100/loki/api/v1/push # where to push data
    loki_options: '-config.file=/etc/loki.yml -config.expand-env=true'
    loki_data_dir: /data/loki         # default loki data dir
    loki_retention: 15d               # log retention period
如果是自定义安装要修改loki的默认默认路径,需要搞清楚loki存储分两部分,日志原始文件和日志索引文件
按照Loki数据的设计思路,日志原始文件可以存放在任何文件系统中,可以是filesystem,对象存储等。而日志的索引则专门存储到索引服务当中,这里面包含Loki内置的BoltDB当中。其数据存储主要的思想也是让用对象存储负责廉价地存储压缩日志,而索引则负责以快速,有效的查询方式存储这些标签。
当前Loki1.6版本支持的数据存储如下:
- Chunks 日志原始文件
- Cassandra
- GCS
- File System
- S3
- 任何实现S3标准接口的服务,如Minio,Ceph RGW
- Index 日志索引
- Cassandra
- BigTable
- DynamoDB
- BoltDB
将loki.yml 中的配置路径修改为新的位置后,重启loki即可。
可以看到注意是chunk比较大。
![[外链图片转存失败,源站可能有防盗链机制,建议将图片保存下来直接上传(img-bc3ZOmKU-1689312698426)(E:\book\Kubernetes\GLP技术栈学习\assets\image-20221111152507740.png)]](https://img-blog.csdnimg.cn/605a172d4cf6408e81630eeb9e6492fd.png)
storage_config:
  boltdb_shipper:
    active_index_directory: /nfs/data/prometheus/lokidata/data/loki/data/boltdb-shipper-active
    cache_location: /nfs/data/prometheus/lokidata/data/loki/data/boltdb-shipper-cache
    cache_ttl: 336h   # Can be increased for faster performance over longer query periods, uses more disk space
    shared_store: filesystem

  filesystem: # 修改chunks存储的位置的位置,这里使用nfs 存储.
    directory: /nfs/data/prometheus/lokidata/data/loki/chunks
loki 生产配置
经过调优版本的loki配置(2022年11月16日09:06:38)
cat /etc/loki.yml
#==============================================================#
# File      :   loki.yml
# Ctime     :   2021-04-03
# Mtime     :   2022-11-11
# Desc      :   Loki configuration file
# Path      :   /etc/loki.yml
#==============================================================#

auth_enabled: false

server:
  http_listen_port: 3100
  grpc_listen_port: 9096
  grpc_server_max_recv_msg_size: 1079741824 # 远程调用最大接受的大小
  grpc_server_max_send_msg_size: 1079741824 # 远程调用最大发送的大小
ingester:
  wal:
    enabled: true
    dir: /nfs/data/prometheus/lokidata/data/loki
  lifecycler:
    address: 127.0.0.1
    ring:
      kvstore:
        store: inmemory
      replication_factor: 1
    final_sleep: 0s
  chunk_idle_period: 1h       # Any chunk not receiving new logs in this time will be flushed
  max_chunk_age: 1h           # All chunks will be flushed when they hit this age, default is 1h
  chunk_target_size: 1048576  # Loki will attempt to build chunks up to 1.5MB, flushing first if chunk_idle_period or max_chunk_age is reached first
  chunk_retain_period: 30s    # Must be greater than index read cache TTL if using an index cache (Default index read cache TTL is 5m)
  max_transfer_retries: 0     # Chunk transfers disabled


schema_config: # 这里面主要定义的是Loki数据存储的策略。从默认的配置里面可以得到的信息是Loki里面保存的是2022年2月22日之后的数据,同时原始文件存在filesystem中,index存在boltdb当中且保存的周期是168小时
  configs:
    - from: 2022-02-22
      store: boltdb-shipper
      object_store: filesystem
      schema: v11
      index:
        prefix: index_
        period: 168h

storage_config: # Loki的存储引擎配置,这个区块里面,主要定义的是各类存储的一些基本信息。只要你愿意,甚至可以把Loki支持的数据存储都加上?,拿filesystem做原始日志存储,boltdb做index存储
  boltdb_shipper:
    active_index_directory: /nfs/data/prometheus/lokidata/data/loki/data/boltdb-shipper-active
    cache_location: /nfs/data/prometheus/lokidata/data/loki/data/boltdb-shipper-cache
    cache_ttl: 336h   # Can be increased for faster performance over longer query periods, uses more disk space
    shared_store: filesystem

  filesystem:
    directory: /nfs/data/prometheus/lokidata/data/loki/chunks

compactor:
  working_directory: /nfs/data/prometheus/lokidata/data/loki/tmp/boltdb-shipper-compactor
  shared_store: filesystem

limits_config:
  enforce_metric_name: false
  reject_old_samples: true
  reject_old_samples_max_age: 72h
  per_stream_rate_limit: 1GB # 设置太小会报错: error sending batch, will retry" status=429 error="server returned HTTP status 429 Too Many Requests (429): Ingestion rate limit exceeded for user fake
  per_stream_rate_limit_burst: 3GB #
  ingestion_rate_mb: 10
  ingestion_burst_size_mb: 15
  split_queries_by_interval: 15m
chunk_store_config:
  max_look_back_period: 0s

table_manager: # Table Manager是Loki的一个组件,主要负责在其时间段开始之前创建周期表,并在其数据时间范围超出保留期限时将其删除。
  index_tables_provisioning:
    enable_ondemand_throughput_mode: true
    enable_inactive_throughput_on_demand_mode: true
  chunk_tables_provisioning:
    enable_ondemand_throughput_mode: true
    enable_inactive_throughput_on_demand_mode: true
  retention_deletes_enabled: true
  retention_period: 15d # 注意按照官方说法table_manager和storage_config中的数据周期时间必须为24h的倍数才能获得正确的生效

frontend:
  max_outstanding_per_tenant: 2048

query_range:
  align_queries_with_step: true
  parallelise_shardable_queries: false
  max_retries: 5
  cache_results: true
  results_cache:
    cache:
      enable_fifocache: true
      fifocache:
        max_size_items: 1024
        validity: 24h

ruler:
  storage:
    type: local
    local:
      directory: /nfs/data/prometheus/lokidata/data/loki/data/rules
  rule_path: /nfs/data/prometheus/lokidata/data/loki/data/rules-temp
  # alertmanager_url: http://127.0.0.1:9093
  ring:
    kvstore:
      store: inmemory
  enable_api: true
配置优化
1、grpc 优化
grpc_server_max_recv_msg_size: 1079741824 # 远程调用最大接受的大小
grpc_server_max_send_msg_size: 1079741824 # 远程调用最大发送的大小
per_stream_rate_limit: 1GB

per_stream_rate_limit设置太小会报错: error sending batch, will retry" status=429 error="server returned HTTP status 429 Too Many Requests (429): Ingestion rate limit exceeded for user fake
2、优化error 日志显示多行的问题.
参考MFG 配置
3、使用s3存储 loki数据
server:
  http_listen_port: 3100
  grpc_listen_port: 9095
storage_config:
  boltdb_shipper:
    active_index_directory: /data/loki/boltdb-shipper-active
    cache_location: /data/loki/boltdb-shipper-cache
    cache_ttl: 24h        # 将缓存存储时间设置为24小时
    shared_store: s3      # 设置Loki的存储后端为s3
    shared_store_config:
      endpoint: http://s3.example.com
      access_key_id: YOUR_ACCESS_KEY
      secret_access_key: YOUR_SECRET_KEY
index:
  prefix: /data/loki/index
  period: 24h        # 设置索引段(块)的持久周期为24小时
  queue_config:
    enabled: true     # 启用索引转发
    wait_time: 10ms   # 设置队列的等待时间
    capacity: 10000   # 用于配置索引队列的容量
  properties:
    wal:
      compress: true   # 启用WAL压缩
    storage:
      type: boltdb
      boltdb:
        open_options:
          timeout: 10s  # 设置BoltDB打开时间的透明超时
4、loki的index_gateway 为什么可以提高性能
Loki 是一个开源的日志聚合和查询系统,用于管理大规模分布式日志数据。Loki 的索引网关(index_gateway)使用了一个可扩展的分布式缓存来存储最近访问的索引数据以及查询元数据,从而提高了查询性能。
Loki 的索引网关使用了一个三层缓存架构,包括本地缓存、索引网关缓存和远程存储缓存。当一个查询请求到达索引网关时,索引网关将会首先检查本地缓存中是否有相应的索引数据,如果有,则立即返回结果。如果本地缓存中没有数据,索引网关将查询它的分布式缓存服务器,以查找最近访问的索引数据。这些缓存服务器可以运行在不同的主机中,并且它们之间可以相互同步,从而实现真正的高可用性和可扩展性。
如果索引网关缓存中也没有符合要求的数据,则索引网关会将查询发送到远程存储引擎,例如 Object Storage、Cassandra 等。在这里,Loki 可以利用存储引擎的横向扩展能力,可以轻松地适应不断增长的日志数据量。
通过这个三层缓存架构,Loki 的索引网关能够确保最近访问的索引数据始终处于高速缓存中,并且可以快速响应查询请求,提高了查询性能。此外,Loki 的索引网关具有可扩展性和容错性,可以轻松地适应不断增长的日志数据量和查询请求量,从而支持高性能和高可用的日志分析和查询。
假设我们有一个 Loki 集群,其中包含多个 LRU 缓存服务器和一些 Object Storage 存储引擎。当用户发出一个日志查询请求时,Loki 索引网关会使用以下步骤来响应该请求:
- 在本地缓存中查找:Loki 的索引网关使用本地缓存来存储最近访问的索引数据和查询元数据。首先,索引网关会在本地缓存中查找是否存在符合当前查询的索引数据。如果有,则立即返回查询结果。
- 在索引网关缓存中查找:如果本地缓存中没有符合查询条件的索引数据,则索引网关会查询它的分布式缓存服务器,以寻找最近访问的索引数据。如果索引网关缓存中有符合查询条件的索引数据,则将结果返回给用户。
- 在远程存储缓存中查找:如果索引网关缓存中没有符合查询条件的索引数据,则索引网关会将查询请求发送到远程存储引擎,例如 Object Storage、Cassandra 等。在这里,Loki 可以利用存储引擎的横向扩展能力,以快速响应查询请求,并将结果返回给用户。同时,索引网关会将查询结果缓存到索引网关缓存中,以便下次查询时可以快速响应。
举个例子来说,假设有一个 Loki 集群,其中包含 3 个 LRU 缓存服务器和 2 个 Object Storage 存储引擎。每个 LRU 缓存服务器都具有 16 GB 的缓存容量,而每个 Object Storage 存储引擎都能处理 1000 个并发查询请求。
现在,有一个用户发出一个查询请求,该请求需要访问 50 GB 的日志数据。在此查询之前,索引网关上没有任何日志数据的缓存。在这种情况下,Loki 的索引网关会先尝试在本地缓存中查找是否有符合条件的索引数据。如果本地缓存中没有任何数据,则索引网关将转向索引网关缓存,查询最近访问的索引数据。如果索引网关缓存中没有任何数据,则索引网关将向远程存储缓存发送查询请求。
由于 Loki 可以利用 Object Storage 的横向扩展能力,它们可以轻松地处理大量并发查询请求,并在 k8s 集群中实现高性能和高可用性。由此可见,Loki 的索引网关是如何优化大流量的查询请求以提高性能。
测试loki
就像k8s中空跑一样不像loki推送,只是空跑一次
cat info.log | promtail --stdin --dry-run --client.url http://10.50.10.25:3100/loki/api/v1/push
启动loki
systemd 不知为何无法启动,先使用loki 命令行启动.
nohup loki -config.file /etc/loki.yml > /nfs/data/prometheus/lokidata/log/loki.log &
参考
loki 原理: https://cloud.tencent.com/developer/article/1915207
【2】promtail 收集组件
promtail是什么?
Promtail is a logging collector agent
Promtail 是负责收集日志发送给 loki 的代理程序。Promtail 默认通过一个 config.yaml 文件进行配置,其中包含 Promtail 服务端信息、存储位置以及如何从文件中抓取日志等配置。
部署
os version :Centos 7
curl -O 10.50.10.25/pigsty/promtail-2.4.2-1.el7.x86_64.rpm && yum -y install promtail-2.4.2-1.el7.x86_64.rpm && rm -rf ./promtail-2.4.2-1.el7.x86_64.rpm
配置
配置为收集node上的三大log(message、cron、dmesg) 和nginx日志
# cat /etc/promtail.yml
#==============================================================#
# File      :   promtail.yml
# Ctime     :   2022-10-03
# Mtime     :   2022-10-13
# Desc      :   Promtail logging collector agent
# Path      :   /etc/promtail.yml
# Copyright (C) 2018-2022 ninesun 注释版本
#==============================================================#
server:# server 属性配置了 Promtail 作为 HTTP 服务器的行为。
  http_listen_port: 9080
  grpc_listen_port: 9097

positions:                     # positions 属性配置了 Promtail 保存文件的位置,表示它已经读到了文件什么程度。当 Promtail 重新启动时需要它,以允许它从中断的地方继续读取日志。
  filename: ${PROMTAIL_POSITIONS:/var/log/positions.yaml}
  sync_period: 10s             # How often to update the positions file
  ignore_invalid_yaml: true    # Whether to ignore & later overwrite positions files that are corrupted

clients: # client 属性配置了 Promtail 如何连接到 Loki 的实例。
  - url: http://10.50.10.25:3100/loki/api/v1/push
    external_labels: # 添加到所有发送到 Loki 的日志中的静态标签
      ip:  10.50.10.204
      cls: qms-cls
      #ins: qms1
scrape_configs: # scrape_configs 属性配置了 Promtail 如何使用指定的发现方法从一系列目标中抓取日志。
  ################################################################
  #                        Nodes Logs                            #
  ################################################################
   # collect /var/log/messages dmesg cron logs on all nodes
  - job_name: nodes # 用于在 Promtail 中识别该抓取配置的名称。
    static_configs: # 抓取日志静态目标配置
      - targets: # 配置发现在当前节点上查找这是 Prometheus 服务发现代码所要求的,但并不适用于Promtail,它只能查看本地机器上的文件。因此,它应该只有 localhost 的值,或者可以完全移除它,Promtail 会使用 localhost 的默认值。
          - localhost
        labels: # 定义一个要抓取的日志文件和一组可选的附加标签,以应用于由__path__定义的文件日志流。
          src: syslog
          ins: qms
          job: nodes
          __path__: /var/log/messages  # 要加载日志的路径,可以使用 glob 模式(e.g., /var/log/*.log).

      - targets:
          - localhost
        labels:
          src: crontab
          ins: qms
          job: nodes
          __path__: /var/log/cron

      - targets:
          - localhost
        labels:
          src: dmesg
          ins: qms
          job: nodes
          __path__: /var/log/dmesg
  ################################################################
  #                       infra Log                              #
  ################################################################
  # collect nginx & qms ap logs on 204 nodes
      - targets:
          - localhost
        labels:
          ins: qms
          src: info-log
          job: infra
          __path__: /aplog/qms/8086/info.log
      - targets:
          - localhost
        labels:
          src: error-log
          ins: qms
          job: infra
          __path__: /aplog/qms/8086/error.log

      - targets:
          - localhost
        labels:
          src: info-log
          ins: qms
          job: infra
          __path__: /aplog/qms/8087/info.log
      - targets:
          - localhost
        labels:
          ins: qms
          src: error-log
          job: infra
          __path__: /aplog/qms/8087/error.log

  # collect rpt ap logs on 204 nodes
      - targets:
          - localhost
        labels:
          ins: rpt
          src: info-log
          job: infra
          __path__: /lichkin-logs/chot-report_*.debug.log
      - targets:
          - localhost
        labels:
          src: error-log
          ins: rpt
          job: infra
          __path__: /lichkin-logs/chot-report_*.error.log
 # collect fileloader log
      - targets:
          - localhost
        labels:
          ins: fileLoader
          src: info-log
          job: infra
          __path__: /aplog/file-loader/current/info.log
      - targets:
          - localhost
        labels:
          src: error-log
          ins: fileLoader
          job: infra
          __path__: /aplog/file-loader/current/error.log
配置优化
file 动态发现机制
修改配置而不需要重启promtail,基于文件的服务发现提供了一种更通用的方式来配置静态目标。它读取一组包含零个或多个 <static_config> 列表的文件。对所有定义文件的改变通过监视磁盘变化来应用。文件可以以 YAML 或 JSON 格式提供。JSON 文件必须包含一个静态配置的列表,使用这种格式。
启动
systemctl start promtail
参考
https://grafana.com/docs/loki/latest/clients/promtail/configuration/
【3】接入qms ap log 和nginx日志
1、安装promtail
2、准备接入nginx和qms的配置只需要修改promtail配置文件
适用于其他ap log
#==============================================================#
# File      :   promtail.yml
# Ctime     :   2022-10-03
# Mtime     :   2022-10-13
# Desc      :   Promtail logging collector agent
# Path      :   /etc/promtail.yml
# Copyright (C) 2018-2022 ninesun
#==============================================================#
server:
  http_listen_port: 9080
  grpc_listen_port: 9097

positions:                     # location of position status file
  filename: ${
   PROMTAIL_POSITIONS:/var/log/positions.yaml}
  sync_period: 10s             # How often to update the positions file
  ignore_invalid_yaml: true    # Whether to ignore & later overwrite positions files that are corrupted

clients:
  - url: http://10.50.10.25:3100/loki/api/v1/push
    external_labels:
      ip:  10.50.10.209
      cls: qms-cls
      ins: qms1
scrape_configs:
  ################################################################
  #                        Nodes Logs                            #
  ################################################################
   # collect /var/log/messages dmesg cron logs on all nodes
  - job_name: nodes
    static_configs:
      - targets:
          - localhost
        labels:
          src: syslog
          job: nodes
          __path__: /var/log/messages

      - targets:
          - localhost
        labels:
          src: crontab
          job: nodes
          __path__: /var/log/cron

      - targets:
          - localhost
        labels:
          src: dmesg
          job: nodes
          __path__: /var/log/dmesg
  ################################################################
  #                       infra Log                              #
  ################################################################
  # collect nginx & qms ap logs on 209 nodes

  - job_name: infra
    static_configs:
      - targets:
          - localhost
        labels:
          src: nginx-access
          job: infra
          __path__: /usr/local/nginx/logs/access.log

      - targets:
          - localhost
        labels:
          src: nginx-error
          job: infra
          __path__: /usr/local/nginx/logs/error.log

      - targets:
          - localhost
        labels:
          src: 209-8086-info
          job: infra
          __path__: /aplog/qms/8086/info.log
      - targets:
          - localhost
        labels:
          src: 209-8086-error
          job: infra
          __path__: /aplog/qms/8086/error.log

      - targets:
          - localhost
        labels:
          src: 209-8087-info
          job: infra
          __path__: /aplog/qms/8087/info.log
      - targets:
          - localhost
        labels:
          src: 209-8087-error
          job: infra
          __path__: /aplog/qms/8087/error.log


# 204
#====================
最低0.47元/天 解锁文章


 3371
3371


 被折叠的 条评论
为什么被折叠?
被折叠的 条评论
为什么被折叠?
 到【灌水乐园】发言


