


Visual Wordnet
Editor: Zhang GuiGuan
Kyle Scholz has created a Visual Wordnet based on his Force Directed Graph engine written in JavaScript.
Force Directed Graphs are self-organizing, visually appealing tools for representing relational data. The look is organic, because algorithms simulate the way charged particles arrange in space. They work great in user interfaces because the user has access to data nodes while the graph is being organized.

Figure 1-1 A short of search word "void"
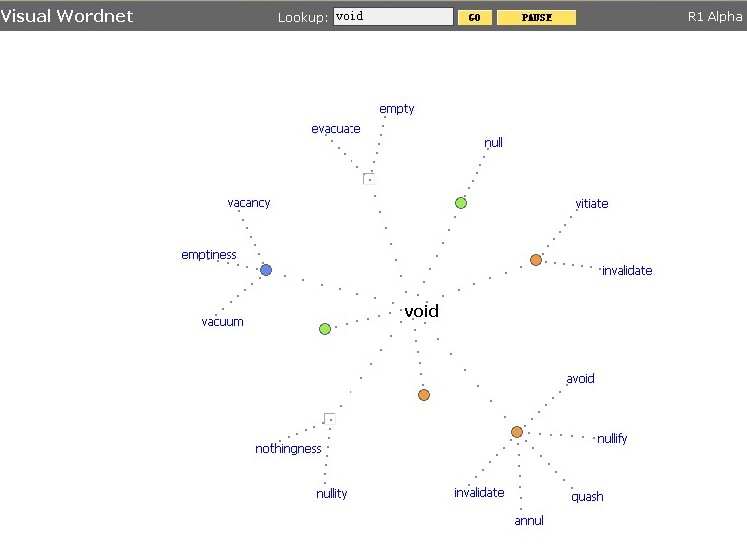
Figure 1-2 Search void
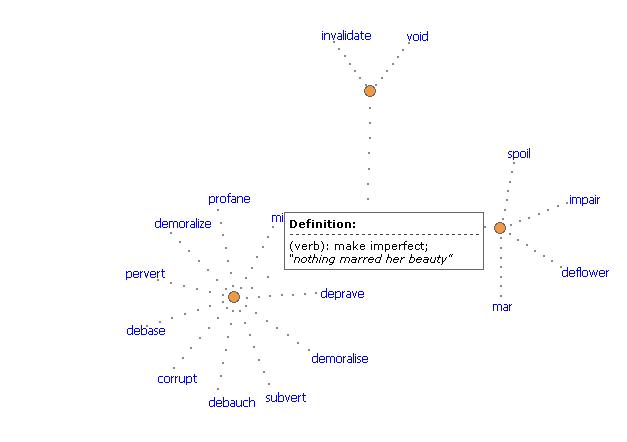
Figure 1-3 The visual relationalship between the words for the wordnet
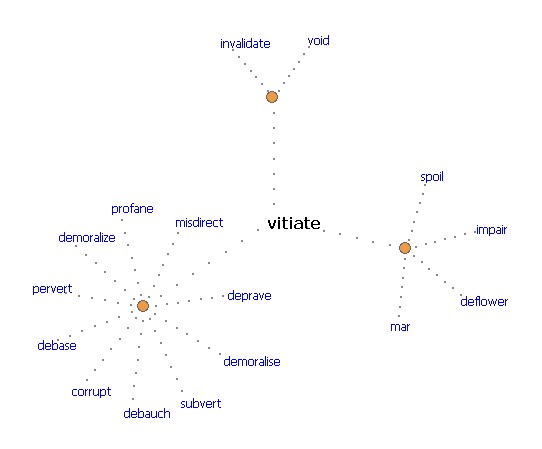
Figure 1-4 The visual relationalship
Figure 1-5 The dynamic description of the relationship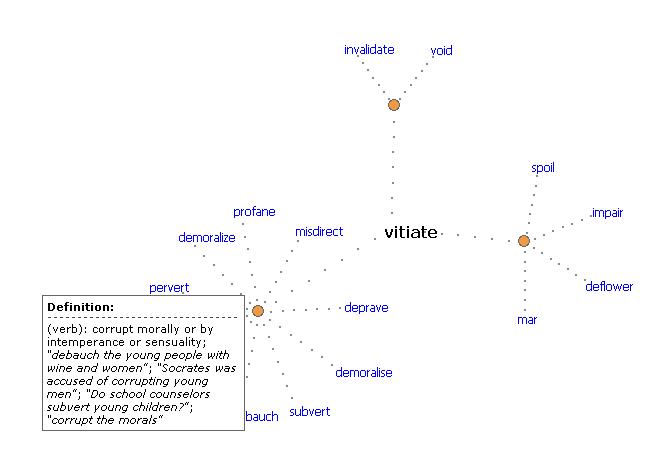
Figure 1-6 The visual relationalship
Force Directed Graphs are self-organizing, visually appealing tools for representing relational data. The look is organic, because algorithms simulate the way charged particles arrange in space. They work great in user interfaces because the user has access to data nodes while the graph is being organized.
<script language="javascript" type="text/javascript"> function show_example_0528( url ) { var frame = document.getElementById('examples_0528_frame'); frame.src=url; } function toggle_example_0528() { var examples = document.getElementById('examples_0528'); var link = document.getElementById('link_example_0528'); if ( examples.style.display == 'none' ) { examples.style.display='block'; show_example_0528( '/projects/force/example01.html' ); link.innerHTML="Hide Example"; } else { examples.style.display='none'; show_example_0528( 'about:blank' ); link.innerHTML="Show Example"; } } </script>
So, what am I using these for?
Recently, I've been considering alternatives to the traditional list and tree views used in search result user interfaces. I'm looking for display tools that can show relationships among results, rather than simply ranking them by score. Force Directed Graphs looked promising, so I started writing this library to determine if a client-resident implementation in Javascript is a viable option.
Initial Findings
- Performance: As currently implemented, the graphing engine consumes a lot of processing power, even after the graph has settled. An entropy-based throttle would help.
- Scaling: The layout algorithm has a complexity of On2 :(. It just doesn't scale very well.
Next Steps
I need to produce some functional user interfaces. Lists make very efficient use of space. Users greatly benefit from lengthy titles, annotations, urls, and even thumbnail images in results. It'll certainly be a challenge to incorporate large amounts of text in a user interface based on force directed graphs. Please please please leave a comment if you've seen examples in the wild or have some suggestions. I'll be publishing the results here, so be sure to check back.
More information:
Force Directed Graphs
http://www.kylescholz.com/blog/2006/06/force_directed_graphs_in_javas.html
Visual wordnet
http://kylescholz.com/projects/wordnet/?text=vitiate


 3984
3984

 被折叠的 条评论
为什么被折叠?
被折叠的 条评论
为什么被折叠?
 到【灌水乐园】发言


