


API
Slient
当设置slient为true时,echarts就不再会调用相应事件也就是tooltips不会触发
legend
    color: [ // 设置颜色可以让legend和line的颜色保持此颜色顺序
        '#4F70D9',
        '#538DFC',
        '#7585A2',
        '#F7C739',
        '#FF8769',
        '#26D9FF'
    ],
    legend: {

        data: [],
        show: true,
        icon: 'circle',
        inactiveColor: 'rgba(255,255,255,0.1)', // 设置不选中时的颜色
        orient: 'vertical',
        formatter: (params) => {

            let target, percentage
            for (let i = 0; i < this.pieChart.seriesData.length; i++) {

                if (this.pieChart.seriesData[i].name === params) {

                    target = this.pieChart.seriesData[i].value | 0
                    percentage = this.pieChart.seriesData[i].percentage
                }
            }
            // 自定义图例内容
            return `{a|${
     params}}{b|${
     target}}{c|${
     percentage}}`
        },
        left: 500,
        top: 80,
        itemWidth: 12,
        itemGap: 18,
        width: 500,
        height: 160,
        textStyle: {

            fontSize: 14,
            rich: {

                a: {

                    borderWidth: 1,
                    borderColor: 'black',
                    width: 100
                },
                b: {

                    width: 70
                },
                c: {

                    width: 70
                }
            }
        }
    }
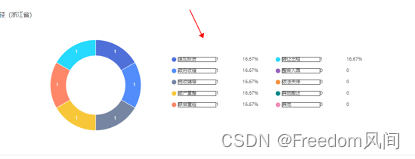
rich
axisLabel: {

    formatter: (value, index) => {

    const length = this.waterQualityData.data.length;
    if (index !== length - 1 || value.length <= 6 || length === 1) return value;
             return `{a|${
     value}}`;
         },
         textStyle: {

             rich: {
    // rich不能设置绝对定位
                 a: {

                     align: 'left',
                     width: 150
                 }
             }
         }
     },
formatter
formatter: (value, index) => {
   } 两个回调参数 值和索引
formatter: function(param) {

     param = param[0];
     let color = 'red';
     let span = `<span
		style='display:inline-block;margin-right:5px;border-radius:50%;width:10px;height:10px;background-color:${
     color};'></span>`;
		return [param.seriesName + ' ', param.marker + param.name + ':' + (param.value || '--') + 'mg/L', span + '水质等级:' + (findLevelInfo(that.waterQualityData [param.dataIndex]).name || '--') + '类'].join('<br/>');
}
Line的itemStyle
设置直线拐点小球的样式
Echarts多个图表时使用flex控制图表自适应失效问题
会出现拖拽页面明明监听了变化就调用reseve方法自适应图表但是会发现div不会变化,后来发现原来是flex失效了,所以只需要强行设置flex子的宽度/width: 25%;/
就可以了
.welbody {

  height: 100%;
  width: 100%;
  display: flex;
  justify-content: center;
  align-items: center;
}
.bodyleft,
.bodyright {

  flex: 1;
  height: 100%;
  width: 25%;
  /* width: 22%;
  min-width: 22%;
  max-width: 22%; */
}
.bodymid {

  position: relative;
  flex: 2;
  width: 50%;
  height: 100%;
}
文字倾斜柱形折线
仪表盘
仪表盘 4.7echarts版本不能支持进度条 只能颜色叠加
axisLine: {

	lineStyle: {

		color: [
			[44 / 100, '#468EFD'],
			[1, '#111F42']
		],
		width: 8
	}
}
Echart图表绘制报错问题
在this.charts = echarts.init(this.$refs.gaugemid);
获取页面dom时,有时会在页面dom渲染结束之前就调用此方法并往下输入配置信息,从而发生报错所以一般需要在绘制ecahrts方法外用nextTick调用
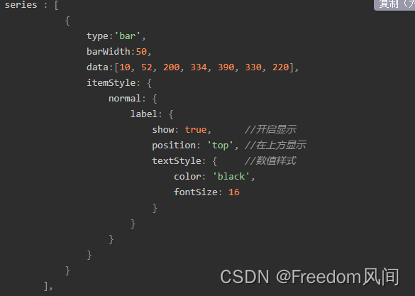
echarts 柱状图 柱顶部显示数字
轴文字倾斜
xAxis: [
    {

        axisLabel: {

            rotate: 40
        },
    }
],
柱形顶部文字
series: [
        {

            itemStyle: {

                normal: {

                    label: {

                        show: true,
                        position: 'top'
                    }
                }
            }
        }
    ]
自定义tooltips位置
tooltip: {

    // trigger: 'axis',
    trigger: 'axis',
    position: function (point, params, dom) {

         let width = dom.clientWidth;
         return [point[0] > 190 ? point[0] - width : point[0],
-150];
     }
}
柱形图tooltips的小球图标
formatter: function(params){
	return params.marker
}
自定义tooltips内dom
formatter: function(params) {

     let str
     str = `
<div style="min-width:80px">
    <div>${
     params[0].seriesName}</div>
    <div style="display:flex;height:20px;align-items:center;">
        <div style="width:8px;height:8px;margin-right:8px;background:${
     params[0].color};border-radius:6px;">
        </div>
        <div>${
     params[0].value}${
     unit}</div>
    </div>
</div>`
     return str
例子
折线图
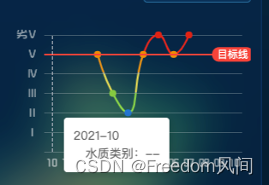
分段颜色+拐点全显示+断线连接
{

    title: {

        text: '',
        left: '0',
        textStyle: {

            color: 'rgba(255,255,255,0.5)',
            fontSize: 12,
            fontFamily: 'TRENDS'
        }
    },
    tooltip: {

        trigger: 'axis',
        axisPointer: {

            type: 'line'
        }
    },
    grid: {

        top: 30,
        left: 40,
        right: 10,
        bottom: 30
    },
    xAxis: [
        {

            type: 'category',
            data: ['2021-10', '2021-11', '2021-12', '2022-01', '2022-02', '2022-03', '2022-04', '2022-05', '2022-06', '2022-07', '2022-08', '2022-09', '2022-10'],
            axisLine: {

                show: false
            },
            axisLabel: {

                textStyle: {

                    fontFamily: 'TRENDS',
                    fontSize: '12',
                    color: 'rgba(255,255,255,0.5)'
                }
            },
            axisTick: {

                show: false
            }
        }
    ],
    yAxis: [
        {

            type: 'value',
            name: '',
            axisLabel: {

                textStyle: {

                    fontFamily: 'TRENDS',
                    fontSize: 12,
                    color: 'rgba(255, 255, 255, 0.5)'
                }
            },
            axisLine: {

                show: false
            },
            splitArea: {

                show: false
            },
            splitLine: {
    // 值分割线
                show: true,
                lineStyle: {

                    color: 'rgba(255, 255, 255, 0.2)'
                }
            },
            axisTick: {

                show: false
            }
        }
    ],
    visualMap: {
    // 分段显示逻辑
        top: 50,
        right: 10,
        show: false,
        seriesIndex: 0,
        pieces: [
            {

                min: 0.050000000000000044,
                max: 1,
                color: '#03A9F4'
            },
            {

                min: 1.05,
                max: 2,
                color: '#1976D2'
            },
            {

                min: 2.05,
                max: 3,
                color: '#85C940'
            },
            {

                min: 3.05,
                max: 4,
                color: '#D9CD4C'
            },
            {

                min: 4.05,
                max: 5,
                color: '#EF8E00'
            },
            {

                min: 5.05,
                max: 6,
                color: '#E12214'
            }
        ],
        outOfRange: {

            color: '#999'
        }
    },
    series: {

        name: '水质类别',
        type: 'line',
        symbol: 'circle',
        symbolSize: 8, // 拐点大小 none 代表不显示
        connectNulls: true, // 断线连接
        showAllSymbol: true, // 显示所有拐点
        smooth: true,
        data: [null, null, null, null, 5, 3, 6, 4, 5, 4, 5, null, null],
        markLine: {

            data: [
                {

                    yAxis: 4,
                    name: '目标线',
                    symbol: 'none',
                    label: {

                        show: true,
                        formatter: '{b}',
                        position: 'end',
                        distance: -35,
                        fontSize: 12,
                        lineHeight: 15,
                        padding: [2, 6, 0, 6],
                        color: '#FFFFFF',
                        backgroundColor: '#F84439',
                        borderRadius: 8
                    },
                    lineStyle: {

                        type: 'solid',
                        color: '#F84439',
                        width: 2
                    }
                }
            ]
        }
    }
}
自定义y轴和拐点
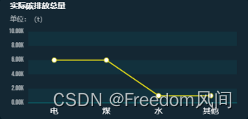
const xData = ['水','煤','电','其他']
const yData = [6000,2000,1000,1000]
const option = {

    tooltip: {

        trigger: 'axis',
        axisPointer: {

            // 坐标轴指示器,坐标轴触发有效
            type: 'shadow' // 默认为直线,可选为:'line' | 'shadow'
        },
        formatter(params: any) {

            const str
                        = `<div><div>${
     params[0].axisValue}</div><div style='display:
                        flex;height:20px;align-items:center;'>${
     params[0].marker}
                        <div>${
     params[0].data}${
     params[0].seriesName}</div></div>`
            return str
        }
    },
    title: {

        text: '实际碳排放总量',
        top: 8,
        padding: [0, 0, 0, 18],
        textStyle: {

            color: 'rgba(255,255,255,1)',
            fontWeight: 700,
            fontSize: 14
        }
    },
    color: ['#e7dd17'],
    grid: {

        top: '60',
        left: '50',
        bottom: '30',
        right: '20'
    },
    xAxis: [
        {

            type: 'category',
            axisTick: {

                show: false
            },
            axisLabel: {

                color: '#ffffff',
                fontSize: 14,
                interval: 0
            },
            axisLine: {

                lineStyle: {

                    color: '#038b8f'
                }
            },
            data: xData
        }
    ],
    yAxis: [
        {

            name: '单位:(t)',
            max: 10000,
            nameTextStyle: {

                color: 'rgba(255,255,255,.6)',
                nameLocation: 'start',
                padding: [5, 0, 0, 0]
            },
            axisLine: {

                show: false
            },
            axisTick: {

                show: false
            },
            splitLine: {

                show: false
            },
            splitArea: {

                show: true,
                areaStyle: {

                    color: ['rgba(3,139,143,0.1)', 'rgba(255,255,255,0)']
                },
                interval: 1
            },
            axisLabel: {

                color: 'rgba(255,255,255,0.6)',
                fontFamily: 'Bebas Neue',
                fontSize: 12,
                formatter: (value: number) => {

                    return `${
     (value / 1000).toFixed(2)}k`
                }
            }
        }
    ],
    series: [
        {

            name: 't',
            type: 'line',
            // symbol: 'circle',     //设定拐点为实心点
            symbolSize: 8,   // 设定拐点的大小
            data: yData,
        }
    ]
}
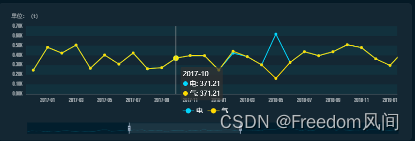
多条折线拖动图
option = {

    dataZoom: [
        {

            backgroundColor: '#021e2d',
            borderColor: '#021e2d',
            dataBackground: {

                areaStyle: {

                    opacity: 0,
                },
                lineStyle: {

                    color: '#03d5fb',
                },
            },
            end: 100,
            fillerColor: 'rgba(255, 255, 255, 0.1)',
            height: 24,
            moveHandleStyle: {
    opacity: 0 },
            realtime: true,
            selectedDataBackground: {

                areaStyle: {
    opacity: 0 },
                lineStyle: {
    color: '#03d5fb' },
            },
            show: true,
            start: 70,
            textStyle: {

                color: 'rgba(255,255,255,0.5)',
                fontFamily: 'Bebas Neue',
            },
            top: '87%',
            type: 'slider',
            // xAxisIndex: [0, 1],
        },
    ],
    tooltip: {

        link: {
    xAxisIndex: 'all' },
        trigger: 'axis',
    },
    legend: {

        top: 220,
        left: 'center',
        textStyle: {

            fontSize: 14,
            color: '#ffffff'
        }
    },
    grid: {

        top: 50,
        left: 60,
        right: 32,
        bottom: 100
    },
    xAxis: {

        axisLabel: {

            show: true,
            fontFamily: 'Bebas Neue',
            fontSize: 12,
            color: 'rgba(255,255,255,.6)'
        },
        axisLine: {

            show: true,
            lineStyle: {

                color: 'rgba(255,255,255,0.2)',
            },
        },
        axisTick: {
    show: false },
        data: ['2015-01','2015-02','2015-03','2015-04','2015-05','2015-06','2015-07','2015-08','2015-09',
            '2015-10','2015-11','2015-12','2016-01','2016-02','2016-03','2016-04','2016-05','2016-06',
            '2016-07','2016-08','2016-09','2016-10','2016-11','2016-12','2017-01','2017-02','2017-03',
            '2017-04','2017-05','2017-06','2017-07','2017-08','2017-09','2017-10','2017-11','2017-12',
            '2018-01','2018-02','2018-03','2018-04','2018-05','2018-06','2018-07','2018-08','2018-09',
            '2018-10','2018-11','2018-12','2019-01','2019-02','2019-03','2019-04','2019-05','2019-06',
            '2019-07','2019-08','2019-09','2019-10','2019-11','2019-12','2020-01','2020-02','2020-03',
            '2020-04','2020-05','2020-06','2020-07','2020-08','2020-09','2020-10','2020-11','2020-12',
            '2021-01','2021-02','2021-03','2021-04','2021-05','2021-06','2021-07','2021-08','2021-09','2021-10','2021-11','2021-12','2022-01'],
        gridIndex: 0,
        type: 'category',
    },
    yAxis: {

        name: '单位:(t)',
        nameTextStyle: {

            color: 'rgba(255,255,255,.6)',
            nameLocation: 'start',
            padding: [5, 0, 0, 0],
        },
        axisLabel: {

            color: 'rgba(255,255,255,0.6)',
            fontFamily: 'Bebas Neue',
            fontSize: 12,
            formatter: (value: number) => {

                return (value / 1000).toFixed(2) + 'k'
            },
        },
        axisLine: {

            show: false,
            lineStyle: {
    color: 'rgba(255,255,255,0.5)' },
        },
        axisTick: {
    show: false },
        gridIndex: 0,
        splitArea: {
    show: true, areaStyle: {
    color: ['rgba(3, 139, 143, 0.1)', 'rgba(0, 0, 0, 0)'] } },
        splitLine: {
    show: false },
        type: 'value',
    },
    color: ['#03d5fb','#ffd902','#00c164','#8c2194','#6dc8ec','#e86452','#479292'],
    series: [
        {

            data: [182.43, 331.93, 280.81, 306.58, 175.65, 255.62, 296.47,
                200.29, 328.7, 362.27, 262.62, 207.44, 293.15, 228.11, 255.78, 201.57,
                343.41, 501.33,498.48, 245.99, 286.61, 376.92, 326.08, 247.09, 482.85,
                423.43, 505.87, 266.3, 403.53, 309.25, 424.08, 261.61, 272.59, 371.21,
                398.12, 396.44,247.97, 422.56, 386.74, 301.53, 619.63, 327.24, 437.38,
                396.34, 437.26, 509.46, 480.18, 364.14, 295.89, 454.31, 446.57, 430.51,
                409.9, 307.79,637.78, 550.48, 525.59, 741.72, 743.59, 1373.45, 705.16,
                564.36, 313.02, 520.78, 321.25, 414.22, 968.89, 988.12, 591.68, 924.52,
                298.81, 975.16,442.93, 378.51, 450.52, 439.35, 466.52, 431.31, 568.86,
                495.26, 453.81, 320.52, 373.43, 294.15, 488.52],
            // itemStyle: {

            //     normal: {

            //         borderColor: '#03d5fb',
            //         color: '#fff',
            //         lineStyle: { color: '#03d5fb' },
            //     },
            // },
            name: '电',
            symbol: 'circle',
            symbolSize: 6,
            type: 'line',
        },
        {

            data: [182.43, 331.93, 280.81, 306.58, 175.65, 255.62, 296.47,
                200.29, 328.7, 362.27, 262.62, 207.44, 293.15, 228.11, 255.78, 201.57,
                343.41, 501.33,498.48, 245.99, 286.61, 376.92, 326.08, 247.09, 482.85,
                423.43, 505.87, 266.3, 403.53, 309.25, 424.08, 261.61, 272.59, 371.21,
                398.12, 396.44,247.97, 442.56, 386.74, 301.53, 161.63, 327.24, 437.38,
                396.34, 437.26, 509.46, 480.18, 364.14, 295.89, 454.31, 446.57, 430.51,
                409.9, 307.79,637.78, 550.48, 525.59, 741.72, 743.59, 373.45, 705.16,
                564.36, 313.02, 320.78, 321.25, 414.22, 968.89, 988.12, 591.68, 924.52,
                298.81, 975.16,442.93, 378.51, 250.52, 439.35, 466.52, 431.31, 568.86,
                495.26, 453.81, 320.52, 373.43, 294.15, 488.52],
            name: '气',
            symbol: 'circle',
            symbolSize: 6,
            type: 'line',
        },
    ]
}
自定义legend
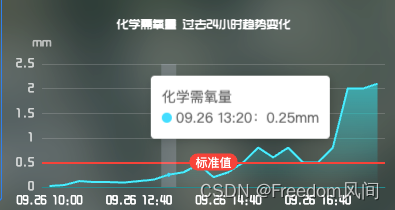
const xData = ["09.26 10:00","09.26 10:20","09.26 10:40","09.26 11:00","09.26 11:20","09.26 11:40","09.26 12:40","09.26 13:00","09.26 13:20","09.26 13:40","09.26 14:00","09.26 14:20","09.26 14:40","09.26 15:00","09.26 15:20","09.26 15:40","09.26 16:00","09.26 16:20","09.26 16:40","09.26 17:00","09.26 17:20","09.26 12:00","09.26 12:20"]
const yData = [0.02,0.04,0.12,0.1,0.1,0.09,0.12,0.15,0.25,0.3,0.46,0.2,0.3,0.5,0.8,0.6,0.8,0.5,0.5,0.8,2,2,2.1]
const option = {

    tooltip: {

        trigger: 'axis',
        axisPointer: {

            // 坐标轴指示器,坐标轴触发有效
            type: 'shadow' // 默认为直线,可选为:'line' | 'shadow'
        },
        formatter(params: any) {

            const str = `<div><div>${
     params[0].seriesName}</div><div
            style='display:
            flex;height:20px;align-items:center;'>${
     params[0].marker}
            <div>${
     params[0].axisValue}:${
     params[0].data}mm</div></div>`
            return str
        }
    },
    title: {

        text: '化学需氧量 过去24小时趋势变化',
        left: 'center',
        textStyle: {

            color: 'white',
            fontFamily: 'TRENDS',
            fontSize: 12
        }
    },
    color: ['#00DDFF'],
    grid: {

        top: '50',
        left: '30',
        bottom: '35',
        right: '10'
    },
    xAxis: [
        {

            type: 'category',
            axisTick: {

                show: false
            },
            axisLabel: {

                color: '#ffffff',
                fontSize: 12,
                // interval: 0, // 强制显示所有x轴标签
                fontFamily: 'TRENDS'
            },
            axisLine: {

                lineStyle: {

                    color: '#038b8f'
                }
            },
            data: xData
        }
    ],
    yAxis: [
        {

            name: 'mm',
            nameTextStyle: {

                fontFamily: 'TRENDS',
                color: 'rgba(255, 255, 255, 0.6)',
                fontSize: '12px',
                align: 'center'
            },
            axisLine: {

                show: false
            },
            axisTick: {

                show: false
            },
            splitLine: {

                // x轴竖线
                lineStyle: {

                    color: 'rgba(255, 255, 255, 0.15)'
                    // type: 'dashed',
                },
            },
            axisLabel: {

                color: 'rgba(255,255,255,0.7)',
                fontFamily: 'TRENDS',
                fontSize: 12,
            }
        }
    ],
    series: [
        {

            name: '化学需氧量',
            type: 'line',
            // smooth: true, // 折线平滑
            data: yData,
            symbolSize: 'none', // 设定拐点的大小
            lineStyle: {

                // 设置折线颜色
                color: '#00DDFF'
            },
            areaStyle: {

                // 阴影颜色渐变
                normal: {

                    color: {

                        x: 0,
                        y: 0,
                        x2: 0,
                        y2: 1,
                        colorStops: [
                            {

                                offset: 0,
                                color: 'rgba(0, 221, 255, 0.7)' // 100% 处的颜色
                            },
                            {

                                offset: 1,
                                color: 'rgba(0, 221, 255, 0)' // 0% 处的颜色
                            }
                        ],
                        globalCoord: false, // 缺省为 false
                    }
                }
            },
            markLine: {

                symbol: 'none', // 去掉箭头
                data: [
                    {

                        yAxis: 0.5,
                        name: '标准值',
                        symbol: 'none',
                        label: {

                            show: true,
                            formatter: '{b}',
                            position: 'middle',
                            distance: -8,
                            fontSize: 12,
                            lineHeight: 15,
                            padding: [2, 6, 0, 6],
                            color: '#FFFFFF',
                            backgroundColor: '#F84439',
                            borderRadius: 8
                        },
                        lineStyle: {

                            type: 'solid',
                            color: '#F84439',
                            width: 2
                        }
                    },
                ]
            }
        }
    ]
}
区域阴影,分割线虚线
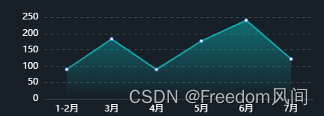
const xAxisData = ['1月', '2月', '3月', '4月', '5月', '6月']
const seriesData = [20, 30, 45, 50, 60, 80]
const lineChart = {

    grid: {

        top: 30,
        bottom: 0,
        right: 0
    },
    legend: {

        show: false,
    },
    tooltip: {

        trigger: 'axis',
        // 设置显示的文字内容
        formatter: (args: any) => {

            return args[0].name + ':' + args[0].value + '万元'
        }
    },
    backgroundColor: 'rgba(23, 31, 39, 1)', // 设置echarts图背景色
    yAxis: {

        splitLine: {

            // 设置y轴分割线为虚线
            lineStyle: {

                type: 'dashed', // y轴分割线类型 虚线
                color: 'rgb(61, 76, 83)'
            }
        },
        axisLine: {

            // 不显示y轴线
            show: false
        },
        // 不显示y轴的小刻度
        axisTick: {

            // 不显示y轴小刻度线
            show: false
        },
        // 把刻度标签里面的文字颜色设置为黑色
        axisLabel: {

            // y轴文本白色
            color: 'white'
        }
    },
    xAxis: {

        data: xAxisData,
        axisLine: {

            lineStyle: {

                color: 'rgb(61, 76, 83)'
            }
        },
        // 不显示y轴的小刻度
        axisTick: {

            show: false
        },
        // 把刻度标签里面的文字颜色设置为黑色
        axisLabel: {

            color: 'white'
        }
    },
    series: [
        {

            name: '张三',
            data: seriesData,
            lineStyle: {

                // 设置折线颜色
                color: 'rgba(12, 170, 174,1)'
            },
            areaStyle: {

                // 阴影颜色渐变
                normal: {

                    color: {

                        x: 0,
                        y: 0,
                        x2: 0,
                        y2: 1,
                        colorStops: [
                            {

                                offset: 0,
                                color: 'rgba(12, 170, 174,0.8)' // 100% 处的颜色
                            },
                            {

                                offset: 1,
                                color: 'rgba(12, 170, 174,0)' // 0% 处的颜色
                            }
                        ],
                        globalCoord: false, // 缺省为 false
                    }
                }
            }
        }
    ]
}
平滑折线阴影+markline
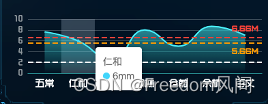
const xData = ['五常', '仁和', '良渚', '闲林', '仓前', '余杭', '百丈']
const yData = [7.66, 6, 2.44, 8, 5, 8.66, 7]
const option = {

    tooltip: {

        trigger: 'axis',
        axisPointer: {

            // 坐标轴指示器,坐标轴触发有效
            type: 'shadow' // 默认为直线,可选为:'line' | 'shadow'
        },
        formatter(params: any) {

            const str = `<div><div>${
     params[0].axisValue}</div><div
            style='display:
            flex;height:20px;align-items:center;'>${
     params[0].marker}
            <div>${
     params[0].data}${
     params[0].seriesName}</div></div>`
            return str
        }
    },
    color: ['#03d5fb'],
    grid: {

        top: '16',
        left: '30',
        bottom: '30',
        right: '10'
    },
    xAxis: [
        {

            type: 'category',
            axisTick: {

                show: false
            },
            axisLabel: {

                color: '#ffffff',
                fontSize: 14,
                interval: 0,
                fontFamily: 'TRENDS'
            },
            axisLine: {

                lineStyle: {

                    color: '#038b8f'
                }
            },
            data: xData
        }
    ],
    yAxis: [
        {

            axisLine: {

                show: false
            },
            axisTick: {

                show: false
            },
            splitLine: {

                // x轴竖线
                lineStyle: {

                    color: 'rgba(255,255,255,.2)'
                    // type: 'dashed',
                },
            },
            axisLabel
最低0.47元/天 解锁文章


 6287
6287


 被折叠的 条评论
为什么被折叠?
被折叠的 条评论
为什么被折叠?
 到【灌水乐园】发言


