


基于中国地图的填色问题动态API
这几天课设需要使用到中国地图来做填色问题,在上了学校的人工智能原理和算法与数据结构两门课后有感而发,于是用里面的一些知识做了这么一个动态版的中国地图API。
主要思路:
使用一个邻接表实现的无向图数据结构作为中国地图,然后使用一个平行的数组来表示结点的颜色。
代码:
#Elwin
import time
import matplotlib.pyplot as plt
import numpy as np
import cv2

class ChinaMap():
    """China map dynamic visualization class"""

    def __init__(self):

        print('[INFO] Try to get China map data...')
        _start = time.time()
        _file = requests.get("https://s3.ax1x.com/2020/12/30/rqxLR0.jpg")
        _img = cv2.imdecode(np.frombuffer(_file.content, np.uint8), 1)
        self.img = cv2.cvtColor(_img,cv2.COLOR_BGR2GRAY)
        print('[INFO] OK! Time: %.3f s' % (time.time() - _start))
        del _start,_img

        self.nameList = np.array(["北京市","天津市","上海市","重庆市","河北省","山西省","辽宁省","吉林省","黑龙江省",
                      "江苏省","浙江省","安徽省","福建省","江西省","山东省","河南省","湖北省","湖南省",
                      "广东省","海南省","四川省","贵州省","云南省","陕西省","甘肃省","青海省","台湾省",
                      "内蒙古自治区","广西壮族自治区","西藏自治区","宁夏回族自治区","新疆维吾尔自治区",
                      "香港特别行政区","澳门特别行政区"])

        self.locList = np.array([[3277,1373],[3340,1444],[3732,2164],[2547,2378],[3155,1560],[3011,1586],
                        [3748,1146],[3845,929],[3909,746],[3519,2105],[3637,2264],[3401,2135],
                        [3506,2622],[3312,2443],[3338,1684],[3100,1881],[3170,2277],[3073,2504],
                        [3115,2977],[2862,3273],[2356,2257],[2557,2658],[2210,2783],[2741,1930],
                        [2367,1750],[2212,1680],[3808,2747],[2937,1300],[2686,3100],[1308,2229],
                        [2558,1529],[1325,855],[3198,3060],[3136,3062]])

        self.adjList = [[1,4],
                        [0,4,14],
                        [9,10],
                        [20,23,16,17,21],
                        [0,1,27,5,15,14,6],
                        [4,27,23,15],
                        [7,27,4],
                        [8,27,6],
                        [27,7],
                        [14,11,10,2],
                        [2,9,11,13,12,26],
                        [9,14,15,16,13,10],
                        [10,13,18,26],
                        [10,11,16,17,18,12],
                        [4,15,11,9,1],
                        [14,4,5,23,16,11],
                        [15,23,3,17,13,11],
                        [16,3,21,28,18,13],
                        [12,13,17,28,19,32,33],
                        [18,28,33],
                        [24,25,29,22,21,3,23],
                        [3,20,22,28,17],
                        [29,20,21,28],
                        [27,30,24,20,3,16,15,5],
                        [27,31,25,20,23,30],
                        [24,31,29,20],
                        [12,10],
                        [31,24,30,23,5,4,6,7,8],
                        [17,21,22,18,19],
                        [31,25,20,22],
                        [27,24,23],
                        [24,25,29,27],
                        [18,33],
                        [18,32,19]]

        self.colorList = np.array([0 for index in range(len(self.nameList))])
        self.color = ["dimgrey","red","orange","#32CD32","#1E90FF"]


    def showMap(self):
        """Show China map separately"""
        plt.axis(False)
        plt.imshow(self.img,cmap='gray')
        plt.show()

    def _getLocation(self,provinceIndex):
        """Get the location information of the province"""
        x,y = self.locList[provinceIndex]
        return x,y

    def changeColor(self,provinceIndex,color):
        self.colorList[provinceIndex] = color

    def getColor(self,provinceIndex):
        return self.colorList[provinceIndex]

    def getProvinceName(self,index):
        return self.nameList[index]

    def draw(self,time=10,showEdge = True,savePath = None):
        """Draw the next frame"""
        plt.cla()
        plt.ion()

        self._imshow(showEdge,savePath)
        plt.plot()

        plt.pause(time)
        plt.ioff()

    def _imshow(self,showEdge = True,savePath = None):
        """Display the map of China and its graphic model"""

        plt.axis(False)
        fig = plt.imshow(self.img,cmap='gray')
        fig.axes.get_xaxis().set_visible(False)
        fig.axes.get_yaxis().set_visible(False)

        _colorList = [self.color[i] for i in self.colorList]

        for provinceIndex in range(len(self.locList)):
            x,y = self._getLocation(provinceIndex)
            plt.scatter(x,y,c = _colorList[provinceIndex],s = 100)

            if showEdge:
                for nebProvince in self.adjList[provinceIndex]:
                    nebX,nebY = self._getLocation(nebProvince)
                    plt.plot((x,nebX),(y,nebY),c = _colorList[nebProvince])

        if savePath:
            plt.savefig(savePath, bbox_inches='tight', pad_inches = 0)

    def reload(self):
        self.colorList = np.array([0 for index in range(len(self.nameList))])
        plt.figure(figsize=(6,6))
        print('[INFO] Successfully reload the Map!')

    def __len__(self):
        return len(self.nameList)

    def adjacency(self,provinceIndex):
        return self.adjList[provinceIndex]

    def stop(self):
        """Stop painting"""
        plt.show()
使用方式:
cnMap = ChinaMap()  #Initialization
print(cnMap.getProvinceName(0))

for i in range(1,20,3):
	cnMap.changeColor(i,1)

cnMap.draw()
cnMap.stop()
[INFO] Try to get China map data...
[INFO] OK! Time: 0.177 s
北京市
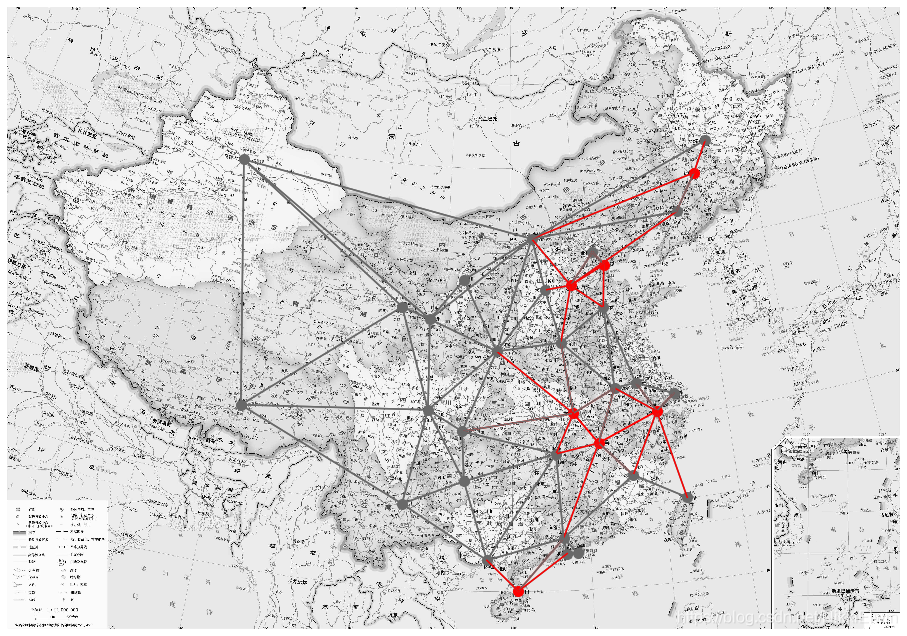
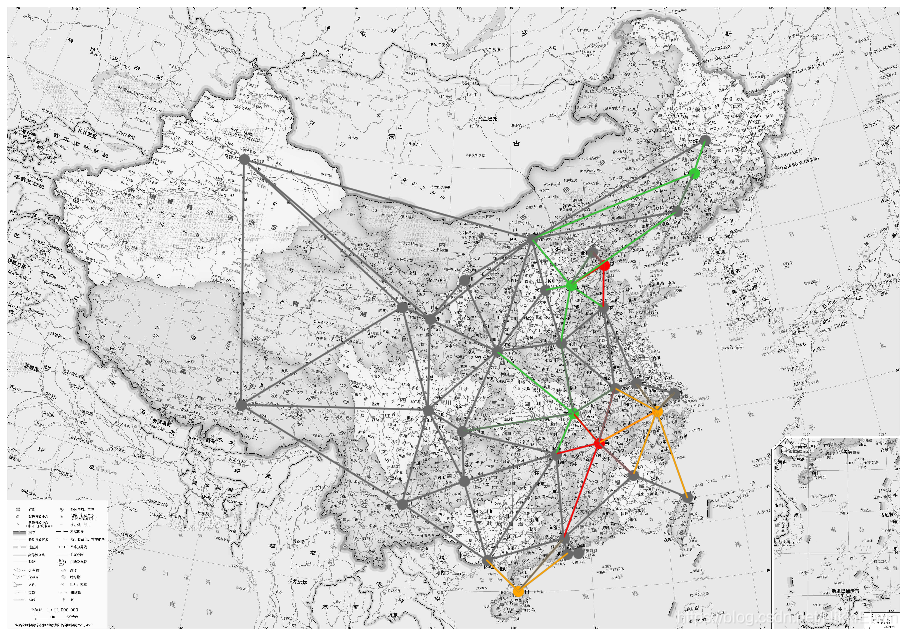
最后放一个使用该API做的一个简单算法可视化~
这个可视化用的是一种变相的启发式搜索算法来实现的,能够适应在任意形状的无向图填色问题之中。


 1603
1603


 被折叠的 条评论
为什么被折叠?
被折叠的 条评论
为什么被折叠?
 到【灌水乐园】发言


