


一、前言
前段时间,老师让设计一个用于插值的GUI界面,便想着用刚学不久的Web框架Flask做一个。
为什么呢?Flask是一个用于Python的轻量级Web框架,简单易用,最适合我这种初学者了。
二、准备工作
开整之前,最好为电脑上的python安装以下库:
pip install scipy flask numpy
三、前端实现
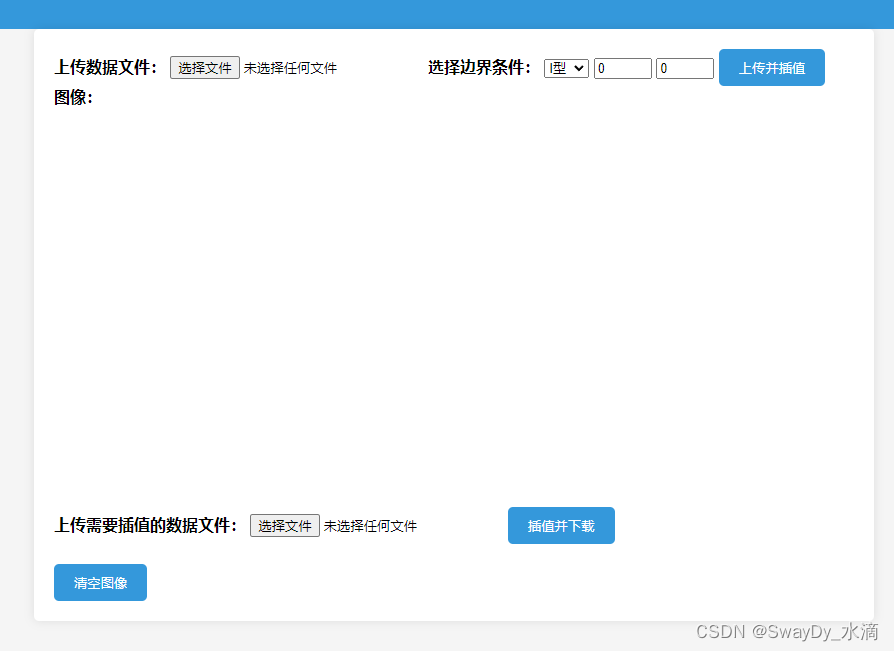
设计一个GUI界面,那肯定得有界面咯,用html先敲一个框架。要有标题、按钮、显示插值图像的图表。。。。。。
<!DOCTYPE html>
<html>
<head>
    <script src="https://cdn.plot.ly/plotly-latest.min.js"></script>
</head>
<body>
    <div id="header">
        <title>三次样条函数插值</title>
    </div>

    <div id="content">
        <label for="dataFile">上传数据文件:</label>
        <input type="file" id="dataFile" accept=".csv">

        <label for="boundary-condition">选择边界条件:</label>

        <select id="boundary-condition">
            <option value="I型">I型</option>
            <option value="II型">II型</option>
        </select>
        <input type="number" , name="left-boundary-condition" ,
         id="leftBoundaryCondition" , placeholder=0 , value=0>
        <input type="number" , name="right-boundary-condition" ,
         id="rightBoundaryCondition" , placeholder=0 , value=0>

        <button onclick="sendInputToPython()">上传并插值</button>
        <div id="chart-container">
            <label for="chart">图像:</label>
            <div id="chart"></div>
        </div>

        <label for="interpDataFile">上传需要插值的数据文件:</label>
        <input type="file" id="interpDataFile" accept=".csv">
        <button onclick="saveInterpDataFile()">插值并下载</button>

        <div class="btn-container">
            <button onclick="clearChart()">清空图像</button>
        </div>
    </div>
</body>
</html>
运行一下吧。

嗯?虽说该有的都有了,但是感觉不太好看。用css修饰一下,加点颜色、改改位置,改改大小。。。。。。
<style>
    body {
        font-family: Arial, sans-serif;
        background-color: #f5f5f5;
        /* background-image: url(../static/2053223.jpg); */
        background-size: cover;
        background-repeat: no-repeat;
        background-attachment: fixed;
        margin: 0;
        padding: 0;
    }

    #header {
        background-color: #3498db;
        color: #fff;
        text-align: center;
        padding: 20px 0;
    }

    #content {
        max-width: 800px;
        margin: 0 auto;
        background-color: #fff;
        padding: 20px;
        border-radius: 5px;
        box-shadow: 0 0 10px rgba(0, 0, 0, 0.1);
    }

    h1 {
        font-size: 24px;
    }

    label {
        font-weight: bold;
    }

    input[type="number"] {
        width: 50px;
    }

    .btn-container {
        margin-top: 20px;
    }

    button {
        padding: 10px 20px;
        background-color: #3498db;
        color: #fff;
        border: none;
        border-radius: 5px;
        cursor: pointer;
        margin-right: 10px;
    }

    #chart {
        width: 100%;
        height: 400px;
    }
</style>
加上css修饰之后,再运行一下。
这就舒服多了。
当然,现在点击那些按钮并不会有任何反应,因为响应函数还没写呢。
四、按钮响应函数实现
先来看第一个按钮,<选择文件>。不同文件有不同的解析方式,这里就仅考虑csv格式的数据文件。因为做的是插值,希望第一行代表自变量,第二行代表因变量,当然有的插值需要用到导数,所以如果有第三行就读取为导数。整体逻辑有了,我们用js来实现一下。
function parseCSVData(csvContent) {
    var lines = csvContent.split('\n');
    var xValues = lines[0] ? lines[0].split(',') : [];
    var yValues = lines[1] ? lines[1].split(',') : [];
    var derivativeValues = lines[2] ? lines[2].split(',') : [];

    var data = {
        x: xValues.map(parseFloat),
        y: yValues.map(parseFloat),
        derivative: derivativeValues.map(parseFloat)
    };

    return data;
}

var fileInput = document.getElementById("dataFile");
var file = fileInput.files[0];
if (!file) {
    alert("请先选择一个数据文件。");
    return;
}

var reader = new FileReader();
reader.onload = function (e) {
    var content = e.target.result;
    // 处理上传的数据文件内容
    // 在这里,你可以解析数据文件(例如CSV文件)
    var data = parseCSVData(content);
    dataPoints = data;
    // 这里进行后续对数据的处理
};
reader.readAsText(file);
再看<上传并插值按钮>。这个按钮做的就是通过数据文件解析得到的数据进行插值,并将插值结果画出来。解析文件功能已经实现了,还差通过数据点插值和展示插值结果两个功能。通过数据点插值通过python实现,需要结合flask,这个后面再说。展示插值结果,本质就是将python处理好的结果画出来,这个简单,导入一个第三方js库Ployly就可以通过少量代码实现了。
function Plot(input) {
    var dataPoints = input.dataPoints
    var interpolatedData = input.interpolatedData
    var interpType = input.interpType
    // 创建图表数据
    chartData = [{
        x: dataPoints.x,
        y: dataPoints.y,
        mode: 'markers',
        type: 'scatter',
        name: '数据点'
    }, {
        x: interpolatedData.x,
        y: interpolatedData.y,
        mode: 'lines',
        type: 'scatter',
        name: '插值曲线'
    }];

    // 创建图表
    var layout = {
        title: interpType,
        xaxis: {
            title: 'X轴'
        },
        yaxis: {
            title: 'Y轴'
        }
    };

    Plotly.newPlot('chart', chartData, layout);
}
<插值并下载>按钮就类似了,这里就不说了。
<清空图像>按钮,顾名思义,把画好的图像清除,这个也简单。
function clearChart() {
    Plotly.purge('chart');
}
最后将函数绑定相应的按钮即可。
五、后端实现
前面也说到了,插值的算法还是得用python来实现,这就涉及到前后端的交互了。大致意思就是将前端数据传到后端,后端处理之后再传回前端。这里主要的问题就是怎么把解析好的数据传到python中,可以用JavaScript和Ajax来实现。先创建一个app.py,写上一些基本的东西。
from flask import Flask, render_template, request, jsonify
import numpy as np
from scipy.interpolate import CubicSpline


app = Flask(__name__)


@app.route('/')
def home_page():
    return render_template("index.html")


@app.route('/index.html')
def index():
    return render_template("index.html")


if __name__ == "__main__":
    app.run(host='0.0.0.0', port=5000, debug=True)
如果将前面的html命名为index.html,js函数命名为show.js,通过以下目录结构来存放:
/主目录
-static
-show.js
-templates
-index.html
-app.py
运行app.py之后,可以得到如下输出:
 * Serving Flask app 'app'
 * Debug mode: on
WARNING: This is a development server. Do not use it in a production deployment. Use a production WSGI server instead.
 * Running on all addresses (0.0.0.0)
 * Running on http://127.0.0.1:5000
 * Running on http://{你的IP地址}:5000
Press CTRL+C to quit
 * Restarting with stat
 * Debugger is active!
* Debugger PIN: 126-643-674这时,如果在浏览器中输入http://127.0.0.1:5000就可以得到我们刚才写好的html界面了。
现在再来实现插值算法的函数。给个路由名/process_input。
@app.route('/process_input', methods=['POST'])
def process_input():
    input = request.get_json()
    dataPoints = input.get('dataPoints', '')
    boundaryCondition = input.get('boundaryCondition', '')
    leftBoundary = float(input.get('leftBoundary', ''))
    rightBoundary = float(input.get('rightBoundary', ''))

    x = dataPoints['x']
    y = dataPoints['y']

    # 使用CubicSpline进行三次样条插值
    if boundaryCondition == "I型":
        cs = CubicSpline(x, y, bc_type=((1, leftBoundary), (1, rightBoundary)))
    elif boundaryCondition == "II型":
        cs = CubicSpline(x, y, bc_type=((2, leftBoundary), (2, rightBoundary)))
    else:
        cs = CubicSpline(x, y)

    # 生成插值点
    x_interp = np.linspace(np.min(x), np.max(x), 100)
    y_interp = cs(x_interp)

    return jsonify({"interpolatedData": {'x': list(x_interp), 'y': list(y_interp)}})
@app.route('/process_input', methods=['POST'])这个就表示函数process_input是在路由/process_input下,仅接受POST请求的函数。
input = request.get_json()这个就表示获取前端发送的数据到input中,是一个字典类型。
return jsonify({"interpolatedData": {'x': list(x_interp), 'y': list(y_interp)}})这个就表示返回处理好的数据,也是一个字典类型。
有了对数据进行插值的函数,接下来才到了如何传数据给后端。用JavaScript和Ajax。
function senDataToPython(input) {
    var dataPoints = input.dataPoints
    var boundaryCondition = document.getElementById("boundary-condition").value;
    var leftBoundary = document.getElementById("leftBoundaryCondition").value;
    var rightBoundary = document.getElementById("rightBoundaryCondition").value;

    if (dataPoints.x.length < 2 | dataPoints.y.length < 2) {
        alert("请提供至少两个数据点。");
        return;
    }

    var xhr = new XMLHttpRequest();
    xhr.open("POST", "/process_input", true);
    xhr.setRequestHeader("Content-Type", "application/json;charset=UTF-8");
    xhr.onreadystatechange = function () {
        if (xhr.readyState === 4 && xhr.status === 200) {
            var response = JSON.parse(xhr.responseText);
            var interpolatedData = response.interpolatedData
            //这里对从后端发送来的数据做进一步处理
        }
    };
    xhr.send(JSON.stringify({ dataPoints: dataPoints, boundaryCondition: boundaryCondition,
                              leftBoundary: leftBoundary, rightBoundary: rightBoundary }));
}
var dataPoints = input.dataPointsdataPoints表示解析csv数据文件得到的数据。
至此呢,所有主体工作就全部完成了!首先上传数据文件,接着解析数据文件,再将数据文件传给后端处理,返回处理结果,最后展示处理后的结果。整个流程下来,基本需要实现的功能都实现了,就差将他们整合在一块了,这就没啥技术含量了,先看看最终效果吧!
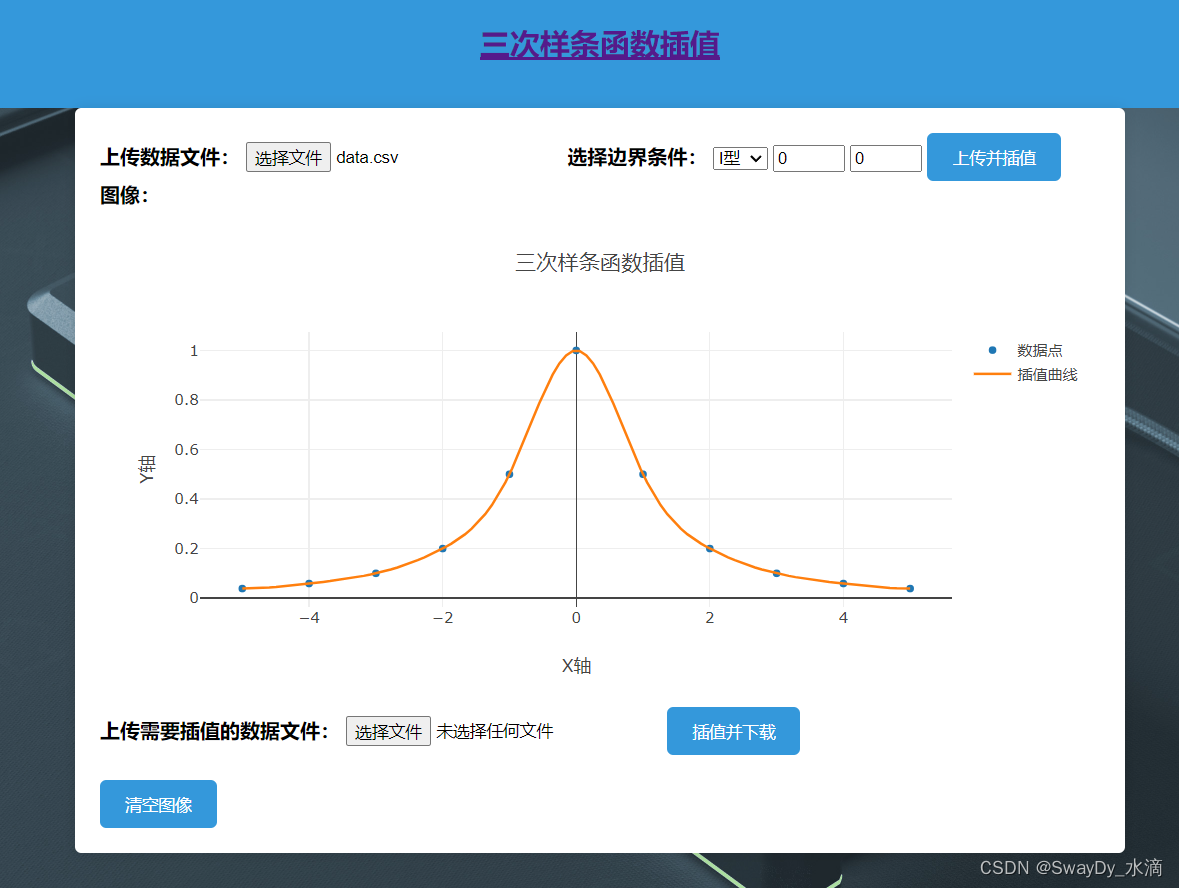
效果还是不错的,能跑(哈哈) 。
六、写在最后
文字还是难以描述清楚,想要进一步了解的可以去下载所有的源码,互相交流学习。


 9819
9819


 被折叠的 条评论
为什么被折叠?
被折叠的 条评论
为什么被折叠?
 到【灌水乐园】发言


