


 该文章展示如何利用Echarts库创建一个具有动态效果的饼图,包括多个环形层和动画旋转的实现,主要涉及自定义渲染函数和定时器来更新角度以产生动画效果。
制作一个有简单动态的饼图
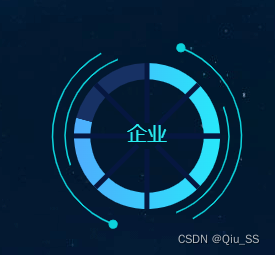
1、渲染饼图
var myChartPie = echarts.init(document.getElementById("myChart-pie"));
window.onresize = myChartPie.resize;
let angle = this.angle1;//角度,用来做简单的动画效果的
let value = 79;
var t = this
let option = {
title: {
text: '{a|' + '企业' + '}',
x: 'center',
y: 'center',
textStyle: {
rich: {
a: {
fontSize: 20,
color: '#29EEF3'
},
c: {
fontSize: 16,
color: '#ffffff',
// padding: [5,0]
}
}
}
},
series: [
{
name: "ring5",
type: 'custom',
coordinateSystem: "none",
renderItem: function (params, api) {
return {
type: 'arc',
shape: {
cx: api.getWidth() / 2,
cy: api.getHeight() / 2,
r: Math.min(api.getWidth(), api.getHeight()) / 2 * 0.65,
startAngle: (0 + angle) * Math.PI / 180,
endAngle: (90 + angle) * Math.PI / 180
},
style: {
stroke: "#0CD3DB",
fill: "transparent",
lineWidth: 1.5
},
silent: true
};
},
data: [0]
},
{
name: "ring5",
type: 'custom',
coordinateSystem: "none",
renderItem: function (params, api) {
return {
type: 'arc',
shape: {
cx: api.getWidth() / 2,
cy: api.getHeight() / 2,
r: Math.min(api.getWidth(), api.getHeight()) / 2 * 0.65,
startAngle: (180 + angle) * Math.PI / 180,
endAngle: (270 + angle) * Math.PI / 180
},
style: {
stroke: "#0CD3DB",
fill: "transparent",
lineWidth: 1.5
},
silent: true
};
},
data: [0]
},
{
name: "ring5",
type: 'custom',
coordinateSystem: "none",
renderItem: function (params, api) {
return {
type: 'arc',
shape: {
cx: api.getWidth() / 2,
cy: api.getHeight() / 2,
r: Math.min(api.getWidth(), api.getHeight()) / 2 * 0.75,
startAngle: (270 + -angle) * Math.PI / 180,
endAngle: (40 + -angle) * Math.PI / 180
},
style: {
stroke: "#0CD3DB",
fill: "transparent",
lineWidth: 1.5
},
silent: true
};
},
data: [0]
},
{
name: "ring5",
type: 'custom',
coordinateSystem: "none",
renderItem: function (params, api) {
return {
type: 'arc',
shape: {
cx: api.getWidth() / 2,
cy: api.getHeight() / 2,
r: Math.min(api.getWidth(), api.getHeight()) / 2 * 0.75,
startAngle: (90 + -angle) * Math.PI / 180,
endAngle: (220 + -angle) * Math.PI / 180
},
style: {
stroke: "#0CD3DB",
fill: "transparent",
lineWidth: 1.5
},
silent: true
};
},
data: [0]
},
{
name: "ring5",
type: 'custom',
coordinateSystem: "none",
renderItem: function (params, api) {
let x0 = api.getWidth() / 2;
let y0 = api.getHeight() / 2;
let r = Math.min(api.getWidth(), api.getHeight()) / 2 * 0.75;
let point = t.getCirlPoint(x0, y0, r, (90 + -angle))
return {
type: 'circle',
shape: {
cx: point.x,
cy: point.y,
r: 4
},
style: {
stroke: "#0CD3DB",//粉
fill: "#0CD3DB"
},
silent: true
};
},
data: [0]
},
{
name: "ring5", //绿点
type: 'custom',
coordinateSystem: "none",
renderItem: function (params, api) {
let x0 = api.getWidth() / 2;
let y0 = api.getHeight() / 2;
let r = Math.min(api.getWidth(), api.getHeight()) / 2 * 0.75;
let point = t.getCirlPoint(x0, y0, r, (270 + -angle))
return {
type: 'circle',
shape: {
cx: point.x,
cy: point.y,
r: 4
},
style: {
stroke: "#0CD3DB", //绿
fill: "#0CD3DB"
},
silent: true
};
},
data: [0]
},
{
name: '覆盖率',
type: 'pie',
radius: ['58%', '45%'],
silent: true,
clockwise: true,
startAngle: 90,
z: 0,
zlevel: 0,
label: {
normal: {
position: "center",
}
},
data: [{
value: value,
name: "",
itemStyle: {
normal: {
color: { // 完成的圆环的颜色
colorStops: [{
offset: 0,
color: '#4FADFD' // 0% 处的颜色
}, {
offset: 1,
color: '#28E8FA' // 100% 处的颜色
}]
},
}
}
},
{
value: 100 - value,
name: "",
label: {
normal: {
show: false
}
},
itemStyle: {
normal: {
color: "#173164"
}
}
}
]
},
{
name: "",
type: "gauge",
radius: "58%",
center: ['50%', '50%'],
startAngle: 0,
endAngle: 359.9,
splitNumber: 8,
hoverAnimation: true,
axisTick: {
show: false
},
splitLine: {
length: 60,
lineStyle: {
width: 5,
color: "#061740"
}
},
axisLabel: {
show: false
},
pointer: {
show: false
},
axisLine: {
lineStyle: {
opacity: 0
}
},
detail: {
show: false
},
data: [{
value: 0,
name: ""
}]
},
]
};
setInterval(() => {
angle = angle + 3
this.angle1 = angle
myChartPie.setOption(option)
}, 500)
myChartPie.setOption(option)
},
2、添加动态
 getCirlPoint(x0, y0, r, angle) {
                let x1 = x0 + r * Math.cos(angle * Math.PI / 180)
                let y1 = y0 + r * Math.sin(angle * Math.PI / 180)
                return {
                    x: x1,
                    y: y1
                }
            },


 467
467

 被折叠的 条评论
为什么被折叠?
被折叠的 条评论
为什么被折叠?
 到【灌水乐园】发言


