


前言
主要内容:
简单地搭建了一个flask页面,自己输入要查找的城市和年份,返回该城市这一年的平均天气情况。
用pyecharts做了一个时间轴的可视化展示,感觉比较美观。
(这次的内容是在以前代码的基础上进行扩展的,这是之前做出来的项目 爬取天气信息,在他的基础上可以自己输入要找的城市和年份,并且用了flask搭建网页)
使用环境:
vscode;
各种python库(如何在vscode中安装python库请参照这篇链接在vscode环境里导入python库(三种方法) | 详细过程)
最终成果
大致效果:
这个是flask进入界面(比较简单,不够美观~~)

p.s. 之后对该页面进行了美化,可以参考我的这篇文章
效果图:

输入查找的城市之后,会像之前一样进行可视化展示(其实就是展示之前生成的html页面)

详细步骤
第一部分:
将得到网页地址,按照地址得到数据,解析数据,把数据写入CSV,将CSV转换成html 这些功能都以函数形式封装,并写到一个文件里 weather.py
1.导入要用的库
解析数据的,生成随机headers的库,可视化要用的库等等
from os import write
import requests  #替代浏览器进行网络请求
from lxml import etree  #进行数据预处理
import csv  #写入csv文件
import pandas as pd


""" 生成随机headers """
from fake_useragent import UserAgent


""" 可视化部分 """
#需要先导入pandas和pyecharts包
import pandas as pd  #pandas主要用于数据分析
#可视化
from pyecharts import options as opts #导入配置项
from pyecharts.charts import Pie,Bar,Timeline #导入图形项

""" 设置爬取时间间隔 """
import time
2.得到地址的函数
2.1.
相比之前,这个函数多了两个参数 city和year,表示要查找的城市和年份
然后在得到weather_time时,年份改成year
for month in range(1,13): #左闭右开
        #某年某月的天气信息
        if month<10:
            weather_time=year+('0'+str(month))
        else:
            weather_time=year+str(month)
2.2.
对应的,传入的网址也要改变,令传入网址为city_url,这里{city}外面的大括号表示city不是字符串,而是传入的变量
city_url=f'https://lishi.tianqi.com/{city}/{weather_time}.html'
#爬虫获取每个月的天气数据
weather=getWeather(city_url)
2.3.
再加上一个休眠时间,防止访问过快封ip
 #设置休眠时间
 time.sleep(1)
所以得到地址的函数全部代码如下:
'''得到url'''
#发现url规律  +年份+月份.html
def getUrl(year,city):

   # print(city)
   # print(year)

    #全年的天气数据
    weathers=[]
    for month in range(1,13): #左闭右开
        #某年某月的天气信息
        if month<10:
            weather_time=year+('0'+str(month))
        else:
            weather_time=year+str(month)

        city_url=f'https://lishi.tianqi.com/{city}/{weather_time}.html'
        #爬虫获取每个月的天气数据
        weather=getWeather(city_url)
        #设置休眠时间
        time.sleep(1)
        #将每月数据汇总
        weathers.append(weather)
3.传入地址后得到数据的函数
上面也用到了getWeather(url)函数来得到数据,相比之前的代码,我只在源代码的基础上改了一下headers的获取,使用python库里面的fake_useragent库,用UserAgent().random函数进行随机获取’User-Agent’,同设置休眠时间一样,也是防反爬。
当然,也可以通过多设置几个headers然后随机获取来达到同样效果,不过我觉得这个更方便
'''得到天气数据'''
def getWeather(url):
    print("getWeather:"+url)
    weather_info=[] #[{'日期':...,'最高气温':...,'天气':...},{'日期':...,'最高气温':...,'天气':...}...]
    #设置一个请求头
    headers={
    'User-Agent': UserAgent().random,
    'content-type':'charst=uft8' #设置接收数据的编码格式
    }
    #发起请求
    res=requests.get(url,headers=headers)
    #数据预处理 xpath
    res_html=etree.HTML(res.text)
    #xpath提前当前页所有数据(每个月)
    res_list=res_html.xpath("//ul[@class='thrui']/li")

    #for循环迭代变量每日数据
    for li in res_list:
        #每天的数据放入字典
        day_weather_info={}

        #日期 {'data time':'2020-05-01'}
        #li.xpath{'./div[1]/text()'}[0]代表“2020-05-01 星期五”这一个首项,又因为中间有空格符,所以要处理
        day_weather_info['data time']=li.xpath('./div[1]/text()')[0].split(' ')[0] #以空格为分隔符,取首项

        #最高气温
        high=li.xpath('./div[2]/text()')[0]
        #对最高气温的数据进行处理,去掉℃符号,将28℃变成28
        #字符串切割 索引
        day_weather_info['high']=high[:high.find('℃')]

        #同理,处理最低气温
        low=li.xpath('./div[3]/text()')[0]
        day_weather_info['low']=low[:low.find('℃')]

        #天气状况
        day_weather_info['weather']=li.xpath('./div[4]/text()')[0]

        #将每日天气添加到每月天气
        weather_info.append(day_weather_info)

    #返回数据
    return weather_info
4.将数据写入CSV
我是直接在getUrl(year,city) 函数里面加的代码,(为什么呢,可能因为我比较懒吧~~)也可以分开写,反正传的参数都一样
改了一下保存CSV的地址和名字
“D:\code\python project\pachong\project\”是我保存的路径,“city+’_’+year+’_weather.csv’”是我保存的名字,比如我要找重庆2020年的数据,得到的CSV文件名就是 chongqing_2020_weather.csv
csv_name='D:\\code\\python project\\pachong\\project\\'+city+'_'+year+'_weather.csv'
其余改动不大,完整代码如下:
def getUrl(year,city):

    print(city)
    print(year)

    #全年的天气数据
    weathers=[]
    for month in range(1,13): #左闭右开
        #某年某月的天气信息
        if month<10:
            weather_time=year+('0'+str(month))
        else:
            weather_time=year+str(month)

        city_url=f'https://lishi.tianqi.com/{city}/{weather_time}.html'
        #爬虫获取每个月的天气数据
        weather=getWeather(city_url)
        #设置休眠时间
        time.sleep(1)
        #将每月数据汇总
        weathers.append(weather)

    csv_name='D:\\code\\python project\\pachong\\project\\'+city+'_'+year+'_weather.csv'
    with open(csv_name,'w',newline='',encoding='utf-8') as csvfile:
        #新建一个写入对象
        writer=csv.writer(csvfile)

        #写入表格列名:column_name
        writer.writerow(['日期','最高气温','最低气温','天气'])
        #一次性写入多行用writerrows(写入的数据是列表,一个列表对应一行)
        list_year=[]
        for month_weather in weathers:
            for day_weather_dict in month_weather:
                list_year.append(list(day_weather_dict.values())) #把日数据的值转换成列表,再放到年数据里面
        #写入年数据
        writer.writerows(list_year)
5.将CSV转换成html,用pyecharts将数据进行可视化展示
5.1.
既然改了CSV的保存地址和名字,那么html读取CSV的对应代码也要进行更改
同样加了一个csv_name
csv_name='D:\\code\\python project\\pachong\\project\\'+city+'_'+year+'_weather.csv'
5.2.
然后在保存html文件的时候有一些改动,这里要注意一下!
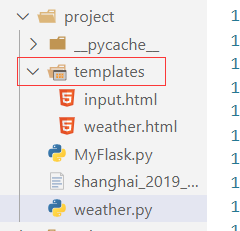
因为之后打算通过flask来显示这个html文件,而flask默认在当前项目的templates文件夹里面找文件,所以这里应该新创建一个templates文件夹,并且把这个html文件保存在这里面
所以把html保存地址改成:
timeline.render('D:\\code\\python project\\pachong\\project\\templates\\weather.html')
这个函数的完整代码如下:
def creat_html(year,city):
    csv_name='D:\\code\\python project\\pachong\\project\\'+city+'_'+year+'_weather.csv'
    #读取数据
    df=pd.read_csv(csv_name,encoding='utf-8')
    #将字符串类型的日期数据转换成日期格式的数据
    df['日期']=df['日期'].apply(lambda x:pd.to_datetime(x))
    #测试数据类型变成了datetime

    df['month']=df['日期'].dt.month #取出月份这个数据,方便后面进行统计
    df_agg=df.groupby(['month','天气']).size().reset_index()

    #设置df_agg列名
    df_agg.columns=['month','weather','count']

    """ 画图 """
    #自动播放的时候的时间序列
    timeline=Timeline()
    #播放设置:设置时间间隔:1s=1000ms
    timeline.add_schema(play_interval=1000) #设置时间间隔是以毫秒ms为单位

    for month in df_agg['month'].unique():
        data=(df_agg[df_agg['month']==month][['weather','count']]
            .sort_values(by='count',ascending=True)
            .values.tolist()
            )

        #绘制柱状图
        bar=Bar()
        # x轴数据:天气名称
        bar.add_xaxis([x[0] for x in data]) #列表推导式
        # y轴数据:出现次数
        #第一个参数为图例,此处不需要但又不能为空,所以用空格代替
        bar.add_yaxis('',[x[1] for x in data])

        #让柱状图横着放
        bar.reversal_axis()
        #将出现的次数放在柱状图右边
        bar.set_series_opts(label_opts=opts.LabelOpts(position='right'))
        #设置下图表的名称
        bar.set_global_opts(title_opts=opts.TitleOpts(title=city+' '+year+'年每月天气变化'))
        #将设置好的bar对象设置到时间轮播图当中,并且标签选择月份  格式:'月份'+'月':12月..
        timeline.add(bar,f'{month}月')

    #html_name=city+'_'+year+'_weather.html'
    #html_name=weather.html
    #将设置好的图表保存为html文件,并保存到指定路径
    timeline.render('D:\\code\\python project\\pachong\\project\\templates\\weather.html')
ok,weather.py文件的所有内容就到此为止了,下一篇将加上flask部分
完整代码
weather.py 文件的全部代码:
from os import write
import requests  #替代浏览器进行网络请求
from lxml import etree  #进行数据预处理
import csv  #写入csv文件
import pandas as pd


""" 生成随机headers """
from fake_useragent import UserAgent


""" 可视化部分 """
#需要先导入pandas和pyecharts包
import pandas as pd  #pandas主要用于数据分析
#可视化
from pyecharts import options as opts #导入配置项
from pyecharts.charts import Pie,Bar,Timeline #导入图形项

""" 设置爬取时间间隔 """
import time


'''得到天气数据'''
def getWeather(url):
    print("getWeather:"+url)
    weather_info=[] #[{'日期':...,'最高气温':...,'天气':...},{'日期':...,'最高气温':...,'天气':...}...]
    #设置一个请求头
    headers={
    'User-Agent': UserAgent().random,
    'content-type':'charst=uft8' #设置接收数据的编码格式
    }
    #发起请求
    res=requests.get(url,headers=headers)
    #数据预处理 xpath
    res_html=etree.HTML(res.text)
    #xpath提前当前页所有数据(每个月)
    res_list=res_html.xpath("//ul[@class='thrui']/li")

    #for循环迭代变量每日数据
    for li in res_list:
        #每天的数据放入字典
        day_weather_info={}

        #日期 {'data time':'2020-05-01'}
        #li.xpath{'./div[1]/text()'}[0]代表“2020-05-01 星期五”这一个首项,又因为中间有空格符,所以要处理
        day_weather_info['data time']=li.xpath('./div[1]/text()')[0].split(' ')[0] #以空格为分隔符,取首项

        #最高气温
        high=li.xpath('./div[2]/text()')[0]
        #对最高气温的数据进行处理,去掉℃符号,将28℃变成28
        #字符串切割 索引
        day_weather_info['high']=high[:high.find('℃')]

        #同理,处理最低气温
        low=li.xpath('./div[3]/text()')[0]
        day_weather_info['low']=low[:low.find('℃')]

        #天气状况
        day_weather_info['weather']=li.xpath('./div[4]/text()')[0]

        #将每日天气添加到每月天气
        weather_info.append(day_weather_info)

    #返回数据
    return weather_info

'''得到url'''
#发现url规律  +年份+月份.html
def getUrl(year,city):

    print(city)
    print(year)

    #全年的天气数据
    weathers=[]
    for month in range(1,13): #左闭右开
        #某年某月的天气信息
        if month<10:
            weather_time=year+('0'+str(month))
        else:
            weather_time=year+str(month)

        city_url=f'https://lishi.tianqi.com/{city}/{weather_time}.html'
        #爬虫获取每个月的天气数据
        weather=getWeather(city_url)
        #设置休眠时间
        time.sleep(1)
        #将每月数据汇总
        weathers.append(weather)

    csv_name='D:\\code\\python project\\pachong\\project\\'+city+'_'+year+'_weather.csv'
    with open(csv_name,'w',newline='',encoding='utf-8') as csvfile:
        #新建一个写入对象
        writer=csv.writer(csvfile)

        #写入表格列名:column_name
        writer.writerow(['日期','最高气温','最低气温','天气'])
        #一次性写入多行用writerrows(写入的数据是列表,一个列表对应一行)
        list_year=[]
        for month_weather in weathers:
            for day_weather_dict in month_weather:
                list_year.append(list(day_weather_dict.values())) #把日数据的值转换成列表,再放到年数据里面
        #写入年数据
        writer.writerows(list_year)


def creat_html(year,city):
    csv_name='D:\\code\\python project\\pachong\\project\\'+city+'_'+year+'_weather.csv'
    #读取数据
    df=pd.read_csv(csv_name,encoding='utf-8')
    #将字符串类型的日期数据转换成日期格式的数据
    #使用匿名函数lambda
    df['日期']=df['日期'].apply(lambda x:pd.to_datetime(x))
    #测试数据类型变成了datetime

    df['month']=df['日期'].dt.month #取出月份这个数据,方便后面进行统计
    #pd.to_datetime(predict_dataset.Date_received, format='%Y-%m-%d')
    #返回一个聚合对象,可以对结果进行分组和统计
    # df_agg=df.groupby(['month','天气']).size()
    #因为groupby后索引是不连续的,需要用reset_index()进行重新排序,得到连续的索引
    df_agg=df.groupby(['month','天气']).size().reset_index()

    #设置df_agg列名
    df_agg.columns=['month','weather','count']

    """ 画图 """

    #自动播放的时候的时间序列
    timeline=Timeline()
    #播放设置:设置时间间隔:1s=1000ms
    timeline.add_schema(play_interval=1000) #设置时间间隔是以毫秒ms为单位

    for month in df_agg['month'].unique():
        data=(df_agg[df_agg['month']==month][['weather','count']]
            .sort_values(by='count',ascending=True)
            .values.tolist()
            )

        #绘制柱状图
        bar=Bar()
        # x轴数据:天气名称
        bar.add_xaxis([x[0] for x in data]) #列表推导式
        # y轴数据:出现次数
        #第一个参数为图例,此处不需要但又不能为空,所以用空格代替
        bar.add_yaxis('',[x[1] for x in data])

        #让柱状图横着放
        bar.reversal_axis()
        #将出现的次数放在柱状图右边
        bar.set_series_opts(label_opts=opts.LabelOpts(position='right'))
        #设置下图表的名称
        bar.set_global_opts(title_opts=opts.TitleOpts(title=city+' '+year+'年每月天气变化'))
        #将设置好的bar对象设置到时间轮播图当中,并且标签选择月份  格式:'月份'+'月':12月..
        timeline.add(bar,f'{month}月')

    #html_name=city+'_'+year+'_weather.html'
    #html_name=weather.html
    #将设置好的图表保存为html文件,并保持与指定路径
    timeline.render('D:\\code\\python project\\pachong\\project\\templates\\weather.html')
补充
第二部分传送门: flask板块


 1589
1589


 被折叠的 条评论
为什么被折叠?
被折叠的 条评论
为什么被折叠?
 到【灌水乐园】发言


