


ps是什么
ps就是最基本,同时也是非常强大的进程查看命令。使用该命令,可以确定有哪些进程正在运行以及其运行的状态、有没有僵尸进程、占用的资源信息等等。总之大部分信息都是可以通过执行该命令得到的。
- ps命令支持三种使用的语法格式
- UNIX 风格,选项可以组合在一起,并且选项前必须有“-”连字符
- BSD 风格,选项可以组合在一起,但是选项前不能有“-”连字符
- GNU 风格的长选项,选项前有两个“-”连字符
在日常生活和工作中,用的较多时前两种风格。本文后面的例子就采用前两种风格。
注意:ps命令能够给出当前系统中进程的快照(即显示某时刻的进程状态),并不是动态连续的。如果想对进程进行实时监控,请用top命令
关于ps的详细信息,请自己查看man手册,本文只介绍一些常用的参数和例子。
ps常用参数
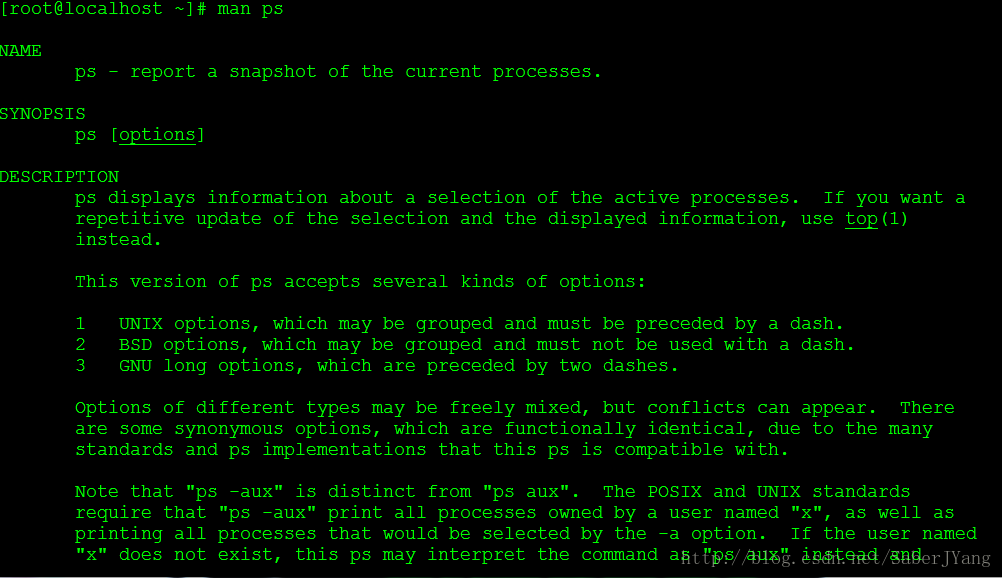
man手册部分英文描述
SIMPLE PROCESS SELECTION
       a      Lift the BSD-style "only yourself" restriction, which is imposed upon the
              set of all processes when some BSD-style (without "-") options are used or
              when the ps personality setting is BSD-like.  The set of processes selected
              in this manner is in addition to the set of processes selected by other
              means.  An alternate description is that this option causes ps to list all
              processes with a terminal (tty), or to list all processes when used
              together with the x option.

       -A     Select all processes.  Identical to -e.

       -a     Select all processes except both session leaders (see getsid(2)) and
              processes not associated with a terminal.

       -d     Select all processes except session leaders.

       --deselect
              Select all processes except those that fulfill the specified conditions
              (negates the selection).  Identical to -N.

       -e     Select all processes.  Identical to -A.

       g      Really all, even session leaders.  This flag is obsolete and may be
              discontinued in a future release.  It is normally implied by the a flag,
              and is only useful when operating in the sunos4 personality.

       -N     Select all processes except those that fulfill the specified conditions
              (negates the selection).  Identical to --deselect.

       T      Select all processes associated with this terminal.  Identical to the t
              option without any argument.

       r      Restrict the selection to only running processes.

       x      Lift the BSD-style "must have a tty" restriction, which is imposed upon the
              set of all processes when some BSD-style (without "-") options are used or
              when the ps personality setting is BSD-like.  The set of processes selected
              in this manner is in addition to the set of processes selected by other
              means.  An alternate description is that this option causes ps to list all
              processes owned by you (same EUID as ps), or to list all processes when
              used together with the a option.
中文描述
a 显示终端上地所有进程,包括其他用户地进程
e 命令之后显示环境(如:ps -d e; ps -a e)
h 不显示标题(即第一行)
l 长格式输出
u 按用户名和启动时间的顺序来显示进程
j 用任务格式来显示进程
f 用树形格式来显示进程
a 显示所有用户的所有进程(包括其它用户)
x 显示无控制终端的进程
r 显示运行中的进程
v 以虚拟存储器格式显示
s 以信号格式显示
U username 显示该用户下的所有进程,且显示各个命令的详细路径。如:ps U zhang
-A 显示所有进程(等价于-e)
-a 显示所有终端机下执行的程序,除了session leaders
-d 显示所有进程,但省略所有的session leaders
-N 选择除满足指定条件的进程之外的所有进程(否定选择)。 等价于–deselect
-x 显示没有控制终端的进程,同时显示各个命令的具体路径。dx不可合用。
-p pid 进程使用cpu的时间
-u uid or username 选择有效的用户id或者是用户名
-g gid or groupname 显示组的所有进程。
-f 全部列出,通常和其他选项联用。如:ps -fa or ps -fx and so on.
-l 长格式(有F,wchan,C 等字段)
-j 作业格式
-o 用户自定义格式。
-w 显示加宽可以显示较多的资讯
-m 显示所有的线程
-H 显示进程的层次(和其它的命令合用,如:ps -Ha)
ps命令常用用法
man手册列举的例子
EXAMPLES
       To see every process on the system using standard syntax:
          ps -e
          ps -ef
          ps -eF
          ps -ely

       To see every process on the system using BSD syntax:
          ps ax
          ps axu

       To print a process tree:
          ps -ejH
          ps axjf

       To get info about threads:
          ps -eLf
          ps axms

       To get security info:
          ps -eo euser,ruser,suser,fuser,f,comm,label
          ps axZ
          ps -eM

       To see every process running as root (real & effective ID) in user format:
          ps -U root -u root u

       To see every process with a user-defined format:
          ps -eo pid,tid,class,rtprio,ni,pri,psr,pcpu,stat,wchan:14,comm
          ps axo stat,euid,ruid,tty,tpgid,sess,pgrp,ppid,pid,pcpu,comm
          ps -Ao pid,tt,user,fname,tmout,f,wchan

       Print only the process IDs of syslogd:
          ps -C syslogd -o pid=

       Print only the name of PID 42:
          ps -q 42 -o comm=
中文描述
1)ps a 显示现行终端机下的所有程序,包括其他用户的程序。
2)ps -A 显示所有程序。
3)ps c 列出程序时,显示每个程序真正的指令名称,而不包含路径,参数或常驻服务的标示。
4)ps -e 此参数的效果和指定”A”参数相同。
5)ps e 列出程序时,显示每个程序所使用的环境变量。
6)ps f 用ASCII字符显示树状结构,表达程序间的相互关系。
7)ps -H 显示树状结构,表示程序间的相互关系。
8)ps -N 显示所有的程序,除了执行ps指令终端机下的程序之外。
9)ps s 采用程序信号的格式显示程序状况。
10)ps S 列出程序时,包括已中断的子程序资料。
11)ps -t<终端机编号> 指定终端机编号,并列出属于该终端机的程序的状况。
12)ps u 以用户为主的格式来显示程序状况。
13)ps x 显示所有程序,不以终端机来区分。
最常用的方法是ps -aux,然后再利用一个管道符号,导向到grep去查找特定的进程,然后再对特定的进程进行操作。
ps Head标头信息
USER 用户名
UID 用户ID(User ID)
PID 进程ID(Process ID)
PPID 父进程的进程ID(Parent Process id)
SID 会话ID(Session id)
%CPU 进程的cpu占用率
%MEM 进程的内存占用率
VSZ 进程所使用的虚存的大小(Virtual Size)
RSS 进程使用的驻留集大小或者是实际内存的大小,Kbytes字节。
TTY 与进程关联的终端(tty)
STAT 进程的状态:进程状态使用字符表示的(STAT的状态码)
START: 启动进程的时间;
TIME: 进程消耗CPU的时间
COMMAND:命令的名称和参数
NI 优先级(Nice)
PRI 进程优先级编号(Priority)
WCHAN 进程正在睡眠的内核函数名称;该函数的名称是从/root/system.map文件中获得的。
FLAGS 与进程相关的数字标识
STAT信息
D 无法中断的休眠状态(通常 IO 的进程);
R 正在运行,在可中断队列中;
S 处于休眠状态,静止状态;
T 停止或被追踪,暂停执行;
W 进入内存交换(从内核2.6开始无效);
X 死掉的进程;
Z 僵尸进程不存在但暂时无法消除;
W: 没有足够的记忆体分页可分配
WCHAN 正在等待的进程资源;
<: 高优先级进程
N: 低优先序进程
L: 有记忆体分页分配并锁在记忆体内 (即时系统或捱A I/O),即,有些页被锁进内存
s 进程的领导者(在它之下有子进程);
l 多进程的(使用 CLONE_THREAD, 类似 NPTL pthreads);
+位于后台的进程组
ps命令举例
环境有2个用户root和saber。root登录两个,saber登录三个,一个执行了man ps命令,一个执行了vim test.txt命令。
1. ps a -a au等例子
[root@localhost ~]# ps a
   PID TTY      STAT   TIME COMMAND
  2193 tty1     Ss+    0:00 /usr/bin/Xorg :0 -background none -noreset -audit 4 -verbose -auth /run/gdm/auth-for-gdm-
  2696 pts/0    Ss+    0:00 -bash
 16510 pts/1    Ss     0:00 -bash
 17911 pts/2    Ss     0:00 -bash
 20682 pts/2    S+     0:00 man ps
 20693 pts/2    S+     0:00 less -s
 21192 pts/3    Ss+    0:00 -bash
 21588 pts/4    Ss     0:00 -bash
 21671 pts/4    S+     0:00 vim test.txt
 22438 pts/1    R+     0:00 ps a
[root@localhost ~]# ps -a
   PID TTY          TIME CMD
 20682 pts/2    00:00:00 man
 20693 pts/2    00:00:00 less
 21671 pts/4    00:00:00 vim
 22439 pts/1    00:00:00 ps
[root@localhost ~]# ps au
USER        PID %CPU %MEM    VSZ   RSS TTY      STAT START   TIME COMMAND
root       2193  0.0  0.7 191040 14044 tty1     Ss+  10:35   0:00 /usr/bin/Xorg :0 -background none -noreset -audit 4
root       2696  0.0  0.1 116688  3548 pts/0    Ss+  10:36   0:00 -bash
root      16510  0.0  0.1 120800  3348 pts/1    Ss   11:19   0:00 -bash
saber     17911  0.0  0.1 116556  3184 pts/2    Ss   12:07   0:00 -bash
saber     20682  0.0  0.1 119496  2244 pts/2    S+   14:29   0:00 man ps
saber     20693  0.0  0.0 110276  1240 pts/2    S+   14:29   0:00 less -s
saber     21192  0.0  0.1 116556  3204 pts/3    Ss+  14:52   0:00 -bash
saber     21588  0.0  0.1 116556  3184 pts/4    Ss   15:03   0:00 -bash
saber     21671  0.0  0.2 153392  4880 pts/4    S+   15:03   0:00 vim test.txt
root      22440  0.0  0.0 139492  1636 pts/1    R+   15:47   0:00 ps au
[root@localhost ~]# ps -au
USER        PID %CPU %MEM    VSZ   RSS TTY      STAT START   TIME COMMAND
root       2193  0.0  0.7 191040 14044 tty1     Ss+  10:35   0:00 /usr/bin/Xorg :0 -background none -noreset -audit 4
root       2696  0.0  0.1 116688  3548 pts/0    Ss+  10:36   0:00 -bash
root      16510  0.0  0.1 120800  3352 pts/1    Ss   11:19   0:00 -bash
saber     17911  0.0  0.1 116556  3184 pts/2    Ss   12:07   0:00 -bash
saber     20682  0.0  0.1 119496  2244 pts/2    S+   14:29   0:00 man ps
saber     20693  0.0  0.0 110276  1240 pts/2    S+   14:29   0:00 less -s
saber     21192  0.0  0.1 116556  3204 pts/3    Ss+  14:52   0:00 -bash
saber     21588  0.0  0.1 116556  3184 pts/4    Ss   15:03   0:00 -bash
saber     21671  0.0  0.2 153392  4880 pts/4    S+   15:03   0:00 vim test.txt
root      22441  0.0  0.0 139492  1636 pts/1    R+   15:48   0:00 ps -au
[root@localhost ~]# ps auf
USER        PID %CPU %MEM    VSZ   RSS TTY      STAT START   TIME COMMAND
saber     21588  0.0  0.1 116556  3184 pts/4    Ss   15:03   0:00 -bash
saber     21671  0.0  0.2 153392  4880 pts/4    S+   15:03   0:00  \_ vim test.txt
saber     21192  0.0  0.1 116556  3204 pts/3    Ss+  14:52   0:00 -bash
saber     17911  0.0  0.1 116556  3184 pts/2    Ss   12:07   0:00 -bash
saber     20682  0.0  0.1 119496  2244 pts/2    S+   14:29   0:00  \_ man ps
saber     20693  0.0  0.0 110276  1240 pts/2    S+   14:29   0:00      \_ less -s
root      16510  0.0  0.1 120800  3352 pts/1    Ss   11:19   0:00 -bash
root      22442  0.0  0.0 139488  1604 pts/1    R+   15:48   0:00  \_ ps auf
root       2696  0.0  0.1 116688  3548 pts/0    Ss+  10:36   0:00 -bash
root       2193  0.0  0.7 191040 14044 tty1     Ss+  10:35   0:00 /usr/bin/Xorg :0 -background none -noreset -audit 4
[root@localhost ~]# ps al
F   UID    PID   PPID PRI  NI    VSZ   RSS WCHAN  STAT TTY        TIME COMMAND
4     0   2193   1091  20   0 191040 14044 poll_s Ss+  tty1       0:00 /usr/bin/Xorg :0 -background none -noreset -au
4     0   2696   2692  20   0 116688  3548 n_tty_ Ss+  pts/0      0:00 -bash
4     0  16510  16507  20   0 120800  3352 wait   Ss   pts/1      0:00 -bash
0  1000  17911  17910  20   0 116556  3184 wait   Ss   pts/2      0:00 -bash
0  1000  20682  17911  20   0 119496  2244 wait   S+   pts/2      0:00 man ps
0  1000  20693  20682  20   0 110276  1240 n_tty_ S+   pts/2      0:00 less -s
0  1000  21192  21189  20   0 116556  3204 n_tty_ Ss+  pts/3      0:00 -bash
0  1000  21588  21585  20   0 116556  3184 wait   Ss   pts/4      0:00 -bash
0  1000  21671  21588  20   0 153392  4880 poll_s S+   pts/4      0:00 vim test.txt
4     0  22547  16510  20   0 137372  1272 -      R+   pts/1      0:00 ps al
[root@localhost ~]# ps aw
   PID TTY      STAT   TIME COMMAND
  2193 tty1     Ss+    0:00 /usr/bin/Xorg :0 -background none -noreset -audit 4 -verbose -auth /run/gdm/auth-for-gdm-vlnJ2G/database
  2696 pts/0    Ss+    0:00 -bash
 16510 pts/1    Ss     0:00 -bash
 17911 pts/2    Ss     0:00 -bash
 20682 pts/2    S+     0:00 man ps
 20693 pts/2    S+     0:00 less -s
 21192 pts/3    Ss+    0:00 -bash
 21588 pts/4    Ss     0:00 -bash
 21671 pts/4    S+     0:00 vim test.txt
 22572 pts/1    R+     0:00 ps aw
[root@localhost ~]#
2. 显示当前所有进程
这个命令的结果或许会很长。为了便于查看,可以结合less命令和管道来使用。
[root@localhost ~]# ps aux | less
USER        PID %CPU %MEM    VSZ   RSS TTY      STAT START   TIME COMMAND
root          1  0.0  0.2 123256  3896 ?        Ss   10:34   0:03 /usr/lib/systemd/systemd --switched-root --system --deserialize 21
root          2  0.0  0.0      0     0 ?        S    10:34   0:00 [kthreadd]
root          3  0.0  0.0      0     0 ?        S    10:34   0:00 [ksoftirqd/0]
root          6  0.0  0.0      0     0 ?        S    10:34   0:00 [kworker/u256:0]
root          7  0.0  0.0      0     0 ?        S    10:34   0:00 [migration/0]
root          8  0.0  0.0      0     0 ?        S    10:34   0:00 [rcu_bh]
root          9  0.0  0.0      0     0 ?        S    10:34   0:00 [rcuob/0]
root         10  0.0  0.0      0     0 ?        S    10:34   0:00 [rcuob/1]
root         11  0.0  0.0      0     0 ?        S    10:34   0:00 [rcuob/2]
root         12  0.0  0.0      0     0 ?        S    10:34   0:00 [rcuob/3]
root         13  0.0  0.0      0     0 ?        S    10:34   0:00 [rcuob/4]
root         14  0.0  0.0      0     0 ?        S    10:34   0:00 [rcuob/5]
root         15  0.0  0.0      0     0 ?        S    10:34   0:00 [rcuob/6]
3. 通过cpu和内存使用来过滤进程
默认的结果集是未排好序的。可以通过 - -sort命令来排序,根据CPU使用率来升序排序。
[root@localhost ~]# ps aux --sort -pcpu | less
USER        PID %CPU %MEM    VSZ   RSS TTY      STAT START   TIME COMMAND
root        820  0.1  0.3 317552  6324 ?        Ssl  10:35   0:21 /usr/bin/vmtoolsd
root          1  0.0  0.2 123256  3896 ?        Ss   10:34   0:03 /usr/lib/systemd/systemd --switched-root --system --deserialize 21
root          2  0.0  0.0      0     0 ?        S    10:34   0:00 [kthreadd]
root          3  0.0  0.0      0     0 ?        S    10:34   0:00 [ksoftirqd/0]
root          6  0.0  0.0      0     0 ?        S    10:34   0:00 [kworker/u256:0]
root          7  0.0  0.0      0     0 ?        S    10:34   0:00 [migration/0]
root          8  0.0  0.0      0     0 ?        S    10:34   0:00 [rcu_bh]
root          9  0.0  0.0      0     0 ?        S    10:34   0:00 [rcuob/0]
root         10  0.0  0.0      0     0 ?        S    10:34   0:00 [rcuob/1]
root 11 0.0 0.0 0 0 ? S 10:34 0:00 [rcuob/2]根据内存使率来升序排序
[root@localhost ~]# ps aux --sort -pmem | less
USER        PID %CPU %MEM    VSZ   RSS TTY      STAT START   TIME COMMAND
gdm        2448  0.0  6.2 1393792 117116 ?      Sl   10:35   0:06 gnome-shell --mode=gdm
root       2856  0.0  1.2 323580 23272 ?        Ssl  10:36   0:00 /usr/bin/python -Es /usr/sbin/firewalld --nofork --nopid
gdm        2417  0.0  1.0 1091488 19088 ?       Sl   10:35   0:00 /usr/libexec/gnome-settings-daemon
gdm        2518  0.0  0.9 787076 18172 ?        Sl   10:35   0:00 /usr/libexec/goa-daemon
root       1081  0.0  0.8 553048 16328 ?        Ssl  10:35   0:03 /usr/bin/python -Es /usr/sbin/tuned -l -P
root        865  0.0  0.8 110524 15828 ?        S    10:35   0:00 /sbin/dhclient -d -q -sf /usr/libexec/nm-dhcp-helper -pf /var/run/dhclient-eno16777736.pid -lf /var/lib/NetworkManager/dhclient-f35d0a44-99d4-4dca-b595-3303ed1ffd09-eno16777736.lease -cf /var/lib/NetworkManager/dhclient-eno16777736.conf eno16777736
root       1085  0.0  0.7 555492 14736 ?        Ssl  10:35   0:00 /usr/sbin/libvirtd
root       2193  0.0  0.7 191040 14044 tty1     Ss+  10:35   0:00 /usr/bin/Xorg :0 -background none -noreset -audit 4 -verbose -auth /run/gdm/auth-for-gdm-vlnJ2G/database -seat seat0 -nolisten tcp vt1
polkitd   22967  0.0  0.6 526464 12124 ?        Ssl  16:10   0:00 /usr/lib/polkit-1/polkitd --no-debug
4. 通过进程名过滤
使用 -C 参数,后面跟你要找的进程的名字。比如想显示一个名为bash的进程的信息,就可以使用下面的命令:
[root@localhost ~]# ps -f -C bash
UID         PID   PPID  C STIME TTY          TIME CMD
root       2696   2692  0 10:36 pts/0    00:00:00 -bash
root      16510  16507  0 11:19 pts/1    00:00:00 -bash
saber     17911  17910  0 12:07 pts/2    00:00:00 -bash
saber     21192  21189  0 14:52 pts/3    00:00:00 -bash
saber     21588  21585  0 15:03 pts/4    00:00:00 -bash
[root@localhost ~]#
5. 根据线程来过滤进程
如果我们想知道特定进程的线程,可以使用-L 参数,后面加上特定的PID。
[root@localhost ~]# ps u -L 2562
USER        PID    LWP %CPU NLWP %MEM    VSZ   RSS TTY      STAT START   TIME COMMAND
gdm        2562   2562  0.0    2  0.1 312512  3296 ?        Sl   10:35   0:00 /usr/libexec/gvfs-mtp-volume-monitor
gdm        2562   2564  0.0    2  0.1 312512  3296 ?        Sl   10:35   0:00 /usr/libexec/gvfs-mtp-volume-monitor
[root@localhost ~]# ps u -L 2566
USER        PID    LWP %CPU NLWP %MEM    VSZ   RSS TTY      STAT START   TIME COMMAND
gdm        2566   2566  0.0    3  0.2 421780  5172 ?        Sl   10:35   0:00 /usr/libexec/gvfs-afc-volume-monitor
gdm        2566   2575  0.0    3  0.2 421780  5172 ?        Sl   10:35   0:00 /usr/libexec/gvfs-afc-volume-monitor
gdm        2566   2577  0.0    3  0.2 421780  5172 ?        Sl   10:35   0:00 /usr/libexec/gvfs-afc-volume-monitor
[root@localhost ~]#
6. 树形显示进程
有时候我们希望以树形结构显示进程,可以使用 f 参数,或pstree命令
[root@localhost ~]# ps auf
USER        PID %CPU %MEM    VSZ   RSS TTY      STAT START   TIME COMMAND
saber     21588  0.0  0.1 116556  3184 pts/4    Ss   15:03   0:00 -bash
saber     21671  0.0  0.2 153392  4880 pts/4    S+   15:03   0:00  \_ vim test.txt
saber     21192  0.0  0.1 116556  3204 pts/3    Ss+  14:52   0:00 -bash
saber     17911  0.0  0.1 116556  3184 pts/2    Ss   12:07   0:00 -bash
saber     20682  0.0  0.1 119496  2244 pts/2    S+   14:29   0:00  \_ man ps
saber     20693  0.0  0.0 110276  1240 pts/2    S+   14:29   0:00      \_ less -s
root      16510  0.0  0.1 120800  3352 pts/1    Ss   11:19   0:00 -bash
root      23431  0.0  0.0 139488  1608 pts/1    R+   16:30   0:00  \_ ps auf
root       2696  0.0  0.1 116688  3548 pts/0    Ss+  10:36   0:00 -bash
root       2193  0.0  0.7 191040 14044 tty1     Ss+  10:35   0:00 /usr/bin/Xorg :0 -background none -noreset -audit 4
[root@localhost ~]# pstree
systemd─┬─ModemManager───2*[{ModemManager}]
        ├─NetworkManager─┬─dhclient
        │                └─2*[{NetworkManager}]
        ├─2*[abrt-watch-log]
        ├─abrtd
        ├─accounts-daemon───2*[{accounts-daemon}]
        ├─alsactl
        ├─at-spi-bus-laun─┬─dbus-daemon
        │                 └─3*[{at-spi-bus-laun}]
        ├─at-spi2-registr───{at-spi2-registr}
        ├─atd
        ├─auditd─┬─audispd─┬─sedispatch
        │        │         └─{audispd}
        │        └─{auditd}
        ├─avahi-daemon───avahi-daemon
        ├─caribou───2*[{caribou}]
        ├─colord───2*[{colord}]
        ├─crond
        ├─cupsd
        ├─2*[dbus-daemon]
        ├─dbus-launch
        ├─dconf-service───2*[{dconf-service}]
        ├─dnsmasq───dnsmasq
        ├─firewalld───{firewalld}
        ├─gdm─┬─Xorg
        │     ├─gdm-session-wor─┬─gnome-session─┬─gnome-settings-───4*[{gnome-settings-}]
        │     │                 │               ├─gnome-shell─┬─ibus-daemon─┬─ibus-dconf───3*[{ibus-dconf}]
7. 显示安全信息
如果想要查看现在有谁登入了你的服务器。可以使用ps命令加上相关参数:
-o 参数控制输出。Pid,User,Args显示PID,运行应用的用户,该应用。
[root@localhost ~]# ps -ao pid,user,args
   PID USER     COMMAND
 20682 saber    man ps
 20693 saber    less -s
 21671 saber    vim test.txt
 23642 root     ps -ao pid,user,args
[root@localhost ~]# ps -ao "%U,%P,%a"
USER    ,  PPID,COMMAND
saber   , 17911,man ps
saber   , 20682,less -s
saber   , 21588,vim test.txt
root    , 16510,ps -ao %U,%P,%a
man手册列出的参数列表如下:
AIX FORMAT DESCRIPTORS
       This ps supports AIX format descriptors, which work somewhat like the formatting
       codes of printf(1) and printf(3).  For example, the normal default output can be
       produced with this: ps -eo "%p %y %x %c".  The NORMAL codes are described in the
       next section.

       CODE   NORMAL   HEADER
       %C     pcpu     %CPU
       %G     group    GROUP
       %P     ppid     PPID
       %U     user     USER
       %a     args     COMMAND
       %c     comm     COMMAND
       %g     rgroup   RGROUP
       %n     nice     NI
       %p     pid      PID
       %r     pgid     PGID
       %t     etime    ELAPSED
       %u     ruser    RUSER
       %x     time     TIME
       %y     tty      TTY
       %z     vsz      VSZ
8. 使用PS实时监控进程状态
ps 命令会显示你系统当前的进程状态,但是这个结果是静态的。
当有一种情况,我们需要像上面第三条提到的通过CPU和内存的使用率来筛选进程,并且我们希望结果能够每5秒刷新一次。为此,我们可以将ps命令和watch命令结合起来。我们可以使用head -20命令来限制输出,只输出前20行。
[root@localhost ~]# watch -n 5 'ps -aux --sort -pmem,-pcpu | head -20'
Every 5.0s: ps -aux --sort -pmem,-pcpu | head -20                                            Sat Apr  8 16:54:27 2017
USER        PID %CPU %MEM    VSZ   RSS TTY      STAT START   TIME COMMAND
gdm        2448  0.0  6.2 1393792 117116 ?      Sl   10:35   0:06 gnome-shell --mode=gdm
root       2856  0.0  1.2 323580 23272 ?        Ssl  10:36   0:00 /usr/bin/python -Es /usr/sbin/firewalld --nofork --
gdm        2417  0.0  1.0 1091488 19088 ?       Sl   10:35   0:00 /usr/libexec/gnome-settings-daemon
gdm        2518  0.0  0.9 787076 18172 ?        Sl   10:35   0:00 /usr/libexec/goa-daemon
root       1081  0.0  0.8 553048 16328 ?        Ssl  10:35   0:03 /usr/bin/python -Es /usr/sbin/tuned -l -P
root        865  0.0  0.8 110524 15828 ?        S    10:35   0:00 /sbin/dhclient -d -q -sf /usr/libexec/nm-dhcp-helpe
root       1085  0.0  0.7 555492 14736 ?        Ssl  10:35   0:00 /usr/sbin/libvirtd
root       2193  0.0  0.7 191040 14044 tty1     Ss+  10:35   0:00 /usr/bin/Xorg :0 -background none -noreset -audit 4
polkitd   22967  0.0  0.6 526644 12344 ?        Ssl  16:10   0:02 /usr/lib/polkit-1/polkitd --no-debug
root        811  0.0  0.5 449240 10448 ?        Ssl  10:34   0:00 /usr/sbin/NetworkManager --no-daemon
gdm        2497  0.0  0.5 469948  9360 ?        Sl   10:35   0:00 /usr/libexec/ibus-x11 --kill-daemon
root       2508  0.0  0.4 487080  9240 ?        Ssl  10:35   0:00 /usr/libexec/packagekitd
gdm        2393  0.0  0.4 562672  8924 ?        Ssl  10:35   0:00 /usr/bin/gnome-session --autostart /usr/share/gdm/g
gdm        2489  0.0  0.4 469996  7668 ?        Sl   10:35   0:00 ibus-daemon --xim --panel disable
gdm        2503  0.0  0.3 395740  7412 ?        Sl   10:35   0:00 /usr/libexec/mission-control-5
gdm        2504  0.0  0.3 575016  7000 ?        Sl   10:35   0:00 /usr/libexec/caribou
root        820  0.1  0.3 317552  6332 ?        Rsl  10:35   0:24 /usr/bin/vmtoolsd
gdm        2459  0.0  0.3 526680  6204 ?        S<l  10:35   0:00 /usr/bin/pulseaudio --start --log-target=syslog
gdm        2574  0.0  0.3 334440  6092 ?        Sl   10:35   0:00 /usr/libexec/goa-identity-service
结论
你也许每天都会使用ps命令来监控你的Linux系统。但是事实上,你可以通过ps命令的参数来生成各种你需要的报表。
ps命令的另一个优势是ps是各种 Linux系统都默认安装的,因此你只要用就行了。
不要忘了通过 man ps来查看更多的参数。(由于 ps 命令古老而重要,所以它在不同的 UNIX、BSD、Linux 等系统中的参数不尽相同,因此如果你用的不是 Linux 系统,请查阅你的文档了解具体可用的参数。)


 544
544

 被折叠的 条评论
为什么被折叠?
被折叠的 条评论
为什么被折叠?
 到【灌水乐园】发言


