


最近,项目上有需要用到对结果数据进行折线图展示的背景,一开始想着直接用第三方库控件,Livecharts,Echarts等直接展示就好,但是使用过程中一个是这些控件的风格基本固定很难改成和需求设计一样的风格,第二个是想对折线图进行生成图片时不够稳定,折线图上的有些标识或者数据可能会丢失,这就导致我不得不启动PlanB-----自绘折线图
听上去十分的麻烦,实际上也是十分的复杂。首先,要自绘就需要考虑用什么原生画板,这里我用到的是Canvas,一个万能好用的基础画板;其次,就是要了解绘画的原理-----Canvas的坐标系
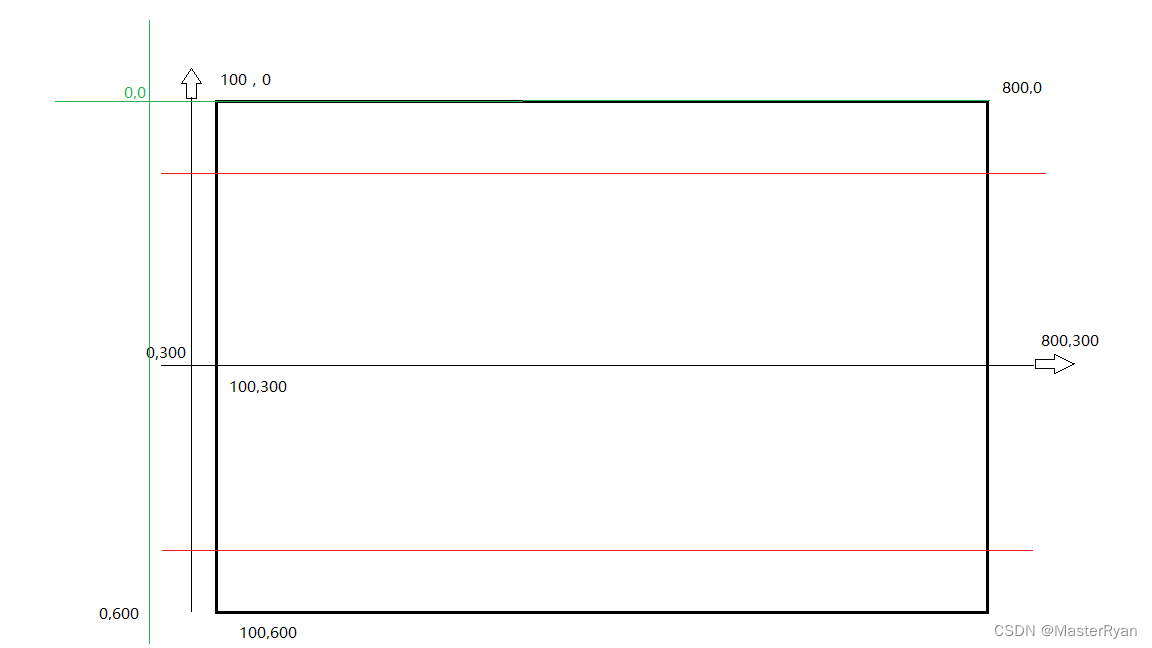
Canvas的绘画坐标系是按照从左往右从上往下的方式,它代表画板的左上角的坐标是0,0,右下角的坐标是(canvas.width,canvas.height),在这里根据我的数值的实际值,给左右上下2边,各留有一部分的间隙,下面的代码均是根据此坐标系来设计,大致的原理图如下
下面是生成折线图的各个拆分步骤代码:
  //创建空白画板
   Canvas canvas = new Canvas();
   canvas.Width = 800;
   canvas.Height = 600;
   canvas.Background = Brushes.White;

   //画X,Y轴
   System.Windows.Shapes.Path xyPath = new System.Windows.Shapes.Path();
    xyPath.Stroke = Brushes.Gray;
    xyPath.Fill = Brushes.Gray;
    xyPath.StrokeThickness = 2;
    GeometryGroup gGroup = getGeometryGroupForXY();//方法在下面封装了
    xyPath.Data = gGroup;
    canvas.Children.Add(xyPath);

	//画远点的Y轴文字 -- um -- Mean线
	TextBlock axisYtext = new TextBlock();
	axisYtext .Text = "0";
	axisYtext.FontSize = 12;
	axisYtext.FontWeight = System.Windows.FontWeights.Black;
	axisYtext.Foreground = Brushes.Black;
	//根据画板坐标系设置对应的位置
	Canvas.SetLeft(axisYtext,60);
	Canvas.SetTop(axisYtext,280);
	canvas.Children.Add(axisYtext);
	//画大刻度线,ps:我这里是花了9个点到横向 360°
	for(int i = 0; i < 9; i++)
	{
		TextBlock axisXtext = new TextBlock();
		axisXtext.Text = (i * 45).ToString();
		axisXtext.FontSize = 12;
		axisXtext.FontWeight = System.Windows.FontWeights.Black;
		axisXtext.Foreground = Brushes.Black;
		Canvas.SetLeft(axisXtext,i * 70 + 94);//94为间隔补偿
		Canvas.SetTop(axisXtext,310);
		canvas.Children.Add(axisXtext);
	}

	//画X,Y轴文字和右上角标注
	//x
	TextBlock axisXtitle = new TextBlock();
	axisXtitle.Text = “Width\n(um)”;
	axisXtitle.FontSize = 14;
	axisXtitle.FontWeight = System.Windows.FontWeights.Black;
	axisXtitle.Foreground = Brushes.Black;
	Canvas.SetLeft(axisXtitle,110);
	Canvas.SetTop(axisXtitle,20);
	canvas.Children.Add(axisXtitle);
	//y
	TextBlock axisYtitle = new TextBlock();
	axisYtitle .Text = “Degree(°)”;
	axisYtitle .FontSize = 14;
	axisYtitle .FontWeight = System.Windows.FontWeights.Black;
	axisYtitle .Foreground = Brushes.Black;
	Canvas.SetLeft(axisYtitle ,720);
	Canvas.SetTop(axisYtitle ,310);
	canvas.Children.Add(axisYtitle );

	//标注---即画出每个颜色代表什么类目
	List<Brush> markColors = new List<Brush>() {Brushes.DeepSkyBlue,Brushes.Orange,Brushes.SeaGreen };
	List<string> markTitles = new List<string> (){"Max Width","Mean Width","Min Width"};
	for(int i = 0;i < 3;i ++)
	{
		//颜色
		Rectangle rectangle = new Rectangle();
		rectangle.Width = 40;
		rectangle.Height = 3;
		rectangle.Fill = markColors[i];
		Canvas.SetLeft(rectangle,666);
		Canvas.SetTop(rectangle,22*i + 20);
		//文字
		TextBlock marktitle= new TextBlock();
		marktitle.Text = markTitles [i];
		marktitle.FontSize = 12;
		marktitle.FontWeight = System.Windows.FontWeights.Black;
		marktitle.Foreground =  markColors[i];
		Canvas.SetLeft(marktitle,720);
		Canvas.SetTop(marktitle,22*i + 10);
		canvas.Children.Add(rectangle);
		canvas.Children.Add(marktitle);
	}

	//画折现用的点集合
	PointCollection coordinatePoints = new PointCollection();
	PointCollection meancoordinatePoints = new PointCollection();
	PointCollection mincoordinatePoints = new PointCollection();
	//依据数据内的最大最小值设置横纵坐标显示区间
	//显示出对应的点数据 ---- 画max---这里的代码不能完全贴出,只能放出核心逻辑代码
	//AllPonints 在这边表示的是一个有Degree,Width值得属性集合,对应横纵坐标
	foreach(var maxpoint in AllPoints)
	{
			//每个点画圆圈
			Ellipse dataEllipse  = new Ellipse();
			dataEllipse.Fill = markColors[0];//对应的填充颜色
			dataEllipse.Width = 8;
			dataEllipse.Height = 8;
			//点旁边的值文字
			TextBlock abovetext = new TextBlock ();
			abovetext.Text = maxpoint .Width + “”;
			abovetext.FontSize = 12;
			abovetext.FontWeight = System.Windows.FontWeights.Black;
			abovetext.Foreground =  markColors[0];
			//第一个点
			if(maxpoint .Degree == 0)
			{
				mincoordinatePoints.Add(new System.Windows.Point(100,minPosition));//这个minPosition是根据几组值下来动态确定的最下方点的位置,方便只显示区间内的值
				Canvas.SetLeft(dataEllipse,95);
				Canvas.SetTop(dataEllipse,88);
			}
			else
			{
				double calPosition =(double)(minpoint.Degree / 10)* 15.55556 + 101//101为补偿值
				mincoordinatePoints.Add(new System.Windows.Point(calPosition ,minPosition));//这个minPosition是根据几组值下来动态确定的最下方点的位置,方便只显示区间内的值
				Canvas.SetLeft(dataEllipse,calPosition - 4);
				Canvas.SetTop(abovetext,calPosition - 15);
			}

			Canvas.SetLeft(dataEllipse,minPosition- 4);
			Canvas.SetTop(abovetext,minPosition- 20);
			canvas.Children.Add(dataEllipse);
			canvas.Children.Add(abovetext);
	}

     //把所有点连成线
     Polyline curvePolyline = new Polyline();
     curvePolyline.Stroke = Brushes.DeepSkyBlue;
     curvePolyline .StrokeThickness = 2;
     curvePolyline .Points = coordinatePoints ;
     canvas.Children.Add(curvePolyline);

	//其他组的线的绘制逻辑也同此
	//下面2行代码必须要加否则会造成分辨率丢失
	canvas.Measure(new new System.Windows.Point(800,600));
	canvas.Arrange(new System.Windows.Rect(new System.Windows.Size(800,600)));
	//内部生成图片--并保存展示--各种格式的均可
	//通过canvas生成各种格式的图片,网上有各种方法这里不贴了


	//释放资源
	canvas.InvalidateArrange();
	canvas.InvalidateMeasure();
下面就是一开头的生成X,Y周线段的代码
private static GeometryGroup getGeometryGroupForXY()
{
GeometryGroup gGroup  = new GeometryGroup ();
	//x
	LineGeometry xlineGeometry = new LineGeometry ();
	xlineGeometry.StartPoint = new System.Windows.Point(30,300);
	xlineGeometry.EndPoint = new System.Windows.Point(770,300);
	//y
	LineGeometry ylineGeometry = new LineGeometry ();
	ylineGeometry .StartPoint = new System.Windows.Point(100,30);
	ylineGeometry .EndPoint = new System.Windows.Point(100,570);

	PathGeometry geometry = new PathGeometry ();
	//axisx
	PathFigure xpFigure = new PathFigure ();
	xpFigure.IsClosed = true;
	xpFigure.StartPoint = new System.Windows.Point(770,296);
	xpFigure.Segments.Add(new LineSegment(new System.Windows.Point(770,304),true));
	xpFigure.Segments.Add(new LineSegment(new System.Windows.Point(780,300),true));
	//axisy
	PathFigure ypFigure = new PathFigure ();
	ypFigure.IsClosed = true;
	ypFigure.StartPoint = new System.Windows.Point(96,30);
	ypFigure.Segments.Add(new LineSegment(new System.Windows.Point(104,30),true));
	ypFigure.Segments.Add(new LineSegment(new System.Windows.Point(100,20),true));
	geometry.Add(xpFigure );
	geometry.Add(ypFigure );
	//加到主线
	gGroup.Children.Add(xlineGeometry );
	gGroup.Children.Add(ylineGeometry );
	gGroup.Children.Add(geometry);
}
好了,这就是完全手动绘制一个折线图控件及显示数据的过程
那么使用折线图的时候,你会用什么第三方控件呢?


 1万+
1万+

 被折叠的 条评论
为什么被折叠?
被折叠的 条评论
为什么被折叠?
 到【灌水乐园】发言


