


第一步:安装:npm install echarts
第二步:在所需要图表的组件中引用 import * as echarts from 'echarts'

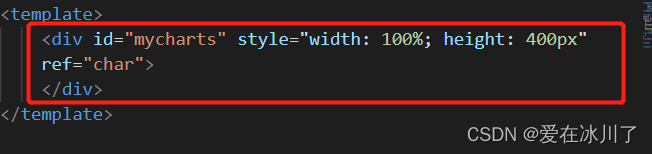
第三步:在template中写一个盒子放图表:
<div id="mycharts" style="width: 100%; height: 400px" ref="char">
</div>
第四步:在官网上找个喜欢的图表 将数据放到 data下
data() {
    return {
      option: {
        legend: {},
        tooltip: {
          trigger: 'axis',
          showContent: false
        },
        dataset: {
          source: [
            ['product', '2012', '2013', '2014', '2015', '2016', '2017'],
            ['Milk Tea', 56.5, 82.1, 88.7, 70.1, 53.4, 85.1],
            ['Matcha Latte', 51.1, 51.4, 55.1, 53.3, 73.8, 68.7],
            ['Cheese Cocoa', 40.1, 62.2, 69.5, 36.4, 45.2, 32.5],
            ['Walnut Brownie', 25.2, 37.1, 41.2, 18, 33.9, 49.1]
          ]
        },
        xAxis: { type: 'category' },
        yAxis: { gridIndex: 0 },
        grid: { top: '50%',bottom:'40' },
        series: [
          {
            type: 'line',
            smooth: true,
            seriesLayoutBy: 'row',
            emphasis: { focus: 'series' }
          },
          {
            type: 'line',
            smooth: true,
            seriesLayoutBy: 'row',
            emphasis: { focus: 'series' }
          },
          {
            type: 'line',
            smooth: true,
            seriesLayoutBy: 'row',
            emphasis: { focus: 'series' }
          },
          {
            type: 'line',
            smooth: true,
            seriesLayoutBy: 'row',
            emphasis: { focus: 'series' }
          },
          {
            type: 'pie',
            id: 'pie',
            radius: '30%',
            center: ['50%', '25%'],
            emphasis: {
              focus: 'self'
            },
            label: {
              formatter: '{b}: {@2012} ({d}%)'
            },
            encode: {
              itemName: 'product',
              value: '2012',
              tooltip: '2012'
            }
          }
        ]
      }
    }
  },
第五步:再将 JS控制代码放入 methods 中
 methods: {
    // 配置echarts
    initMychart() {
      // 销毁实例(防止重复被复制)
      if (this.myChart) {
        this.myChart.dispose()
      }
      // 获得echart的DOM
      let chartDom = this.$refs.char   // $refs["char"]也行
      // 初始化echart
      this.myChart = echarts.init(chartDom, this.theme);
      this.myChart.on('updateAxisPointer', function (event) {
      const xAxisInfo = event.axesInfo[0];
        if (xAxisInfo) {
          const dimension = xAxisInfo.value + 1;
          this.myChart.setOption({
            series: {
              id: 'pie',
              label: {
                formatter: '{b}: {@[' + dimension + ']} ({d}%)'
              },
              encode: {
                value: dimension,
                tooltip: dimension
              }
            }
          });
        }
      });
      this.option && this.myChart.setOption(this.option);
    }
  },
第六步(最后一步):在 mounted 钩子函数中调用一下这个初如函数
  mounted() {
     // echart入口函数
     this.initMychart()
  }
结束


 1298
1298


 被折叠的 条评论
为什么被折叠?
被折叠的 条评论
为什么被折叠?
 到【灌水乐园】发言


