


文章目录
1、QCustomPlot的简介
QCustomPlot是Qt的一个小型第三方图表库,支持静态/动态曲线、柱状图、蜡烛图、频谱图等。使用方便,仅需在项目中加入头文件qcustomplot.h和qcustomplot.cpp源文件即可,或者把它当做一个库来添加到项目当中,该绘图库专注于制作美观、出版物质量高的2D绘图、图形和图表,并为实时可视化应用程序提供高性能。
2、QCustomPlot库的下载和安装
QCustomPlot的官网链接:https://www.qcustomplot.com/index.php/introduction
QCustomPlot的下载链接:https://www.qcustomplot.com/index.php/download
如下是QCustomPlot的安装图:

如上图,点击QCustomPlot.tar.gz即可下载QCustomPlot。
3、QCustomPlot中的常用类介绍
- QCustomPlot:图表类,用于图表显示以及交互。
- QCPLayer:图层类,用于管理图层元素,所有可显示的对象都继承自图层元素。
- QCPAbstractPlottable:绘图元素类,包含折线图(QCPGraph)、曲线图(QCPCurve)、柱状图(QCPBars)、盒子图(QCPStaiBox)、QCPColorMap(色谱图)、金融图(QCPFinancial)。
- QCPAxisRect:坐标轴矩形,一个坐标轴矩形包含上下左右四个坐标,但可以添加多个坐标。
4、QCustomPlot的使用
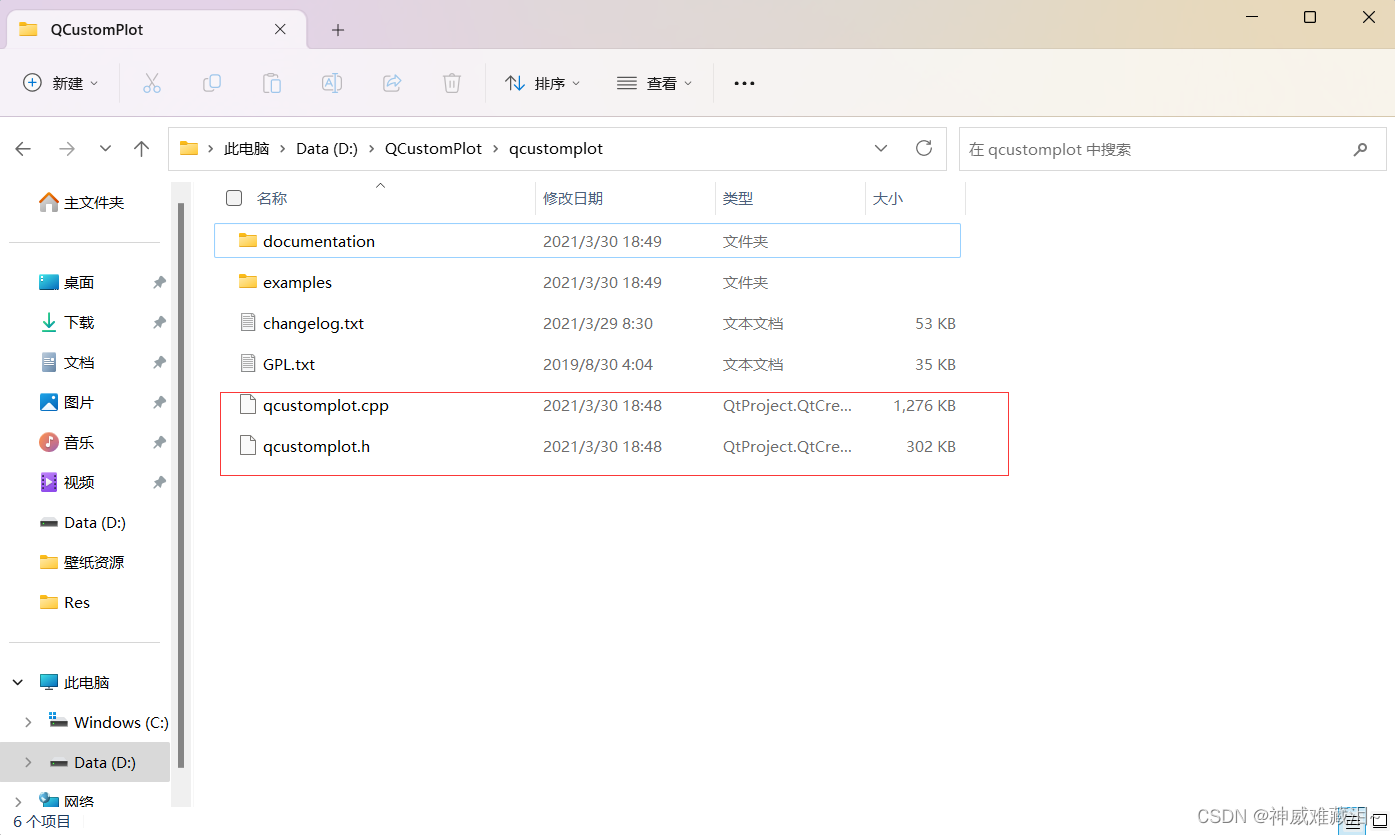
4.1、解压QCustomPlot的压缩包
首先是解压QCustomPlot的压缩包文件:
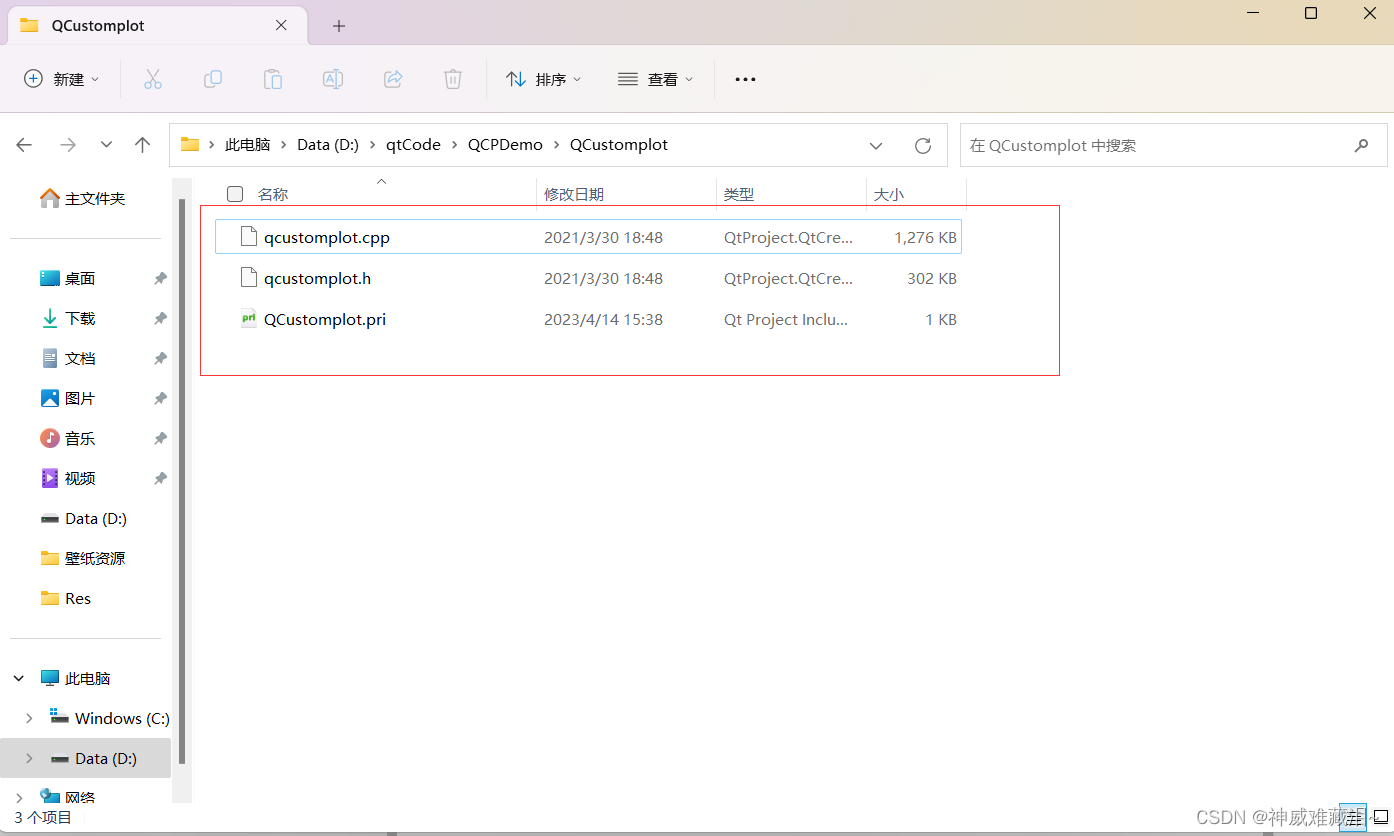
4.2、模块化管理图表库文件
首先是在qt中创建一个项目文件,然后在项目工程中创建一个名为QCustomPlot的文件夹,将qcustomplot.h和qcustomplot.cpp文件复制到该文件夹中,然后创建一个文本文件,然后是修改文本文件的后缀名为pri。
然后通过qmake语法将pri文件加载到主项目工程中:
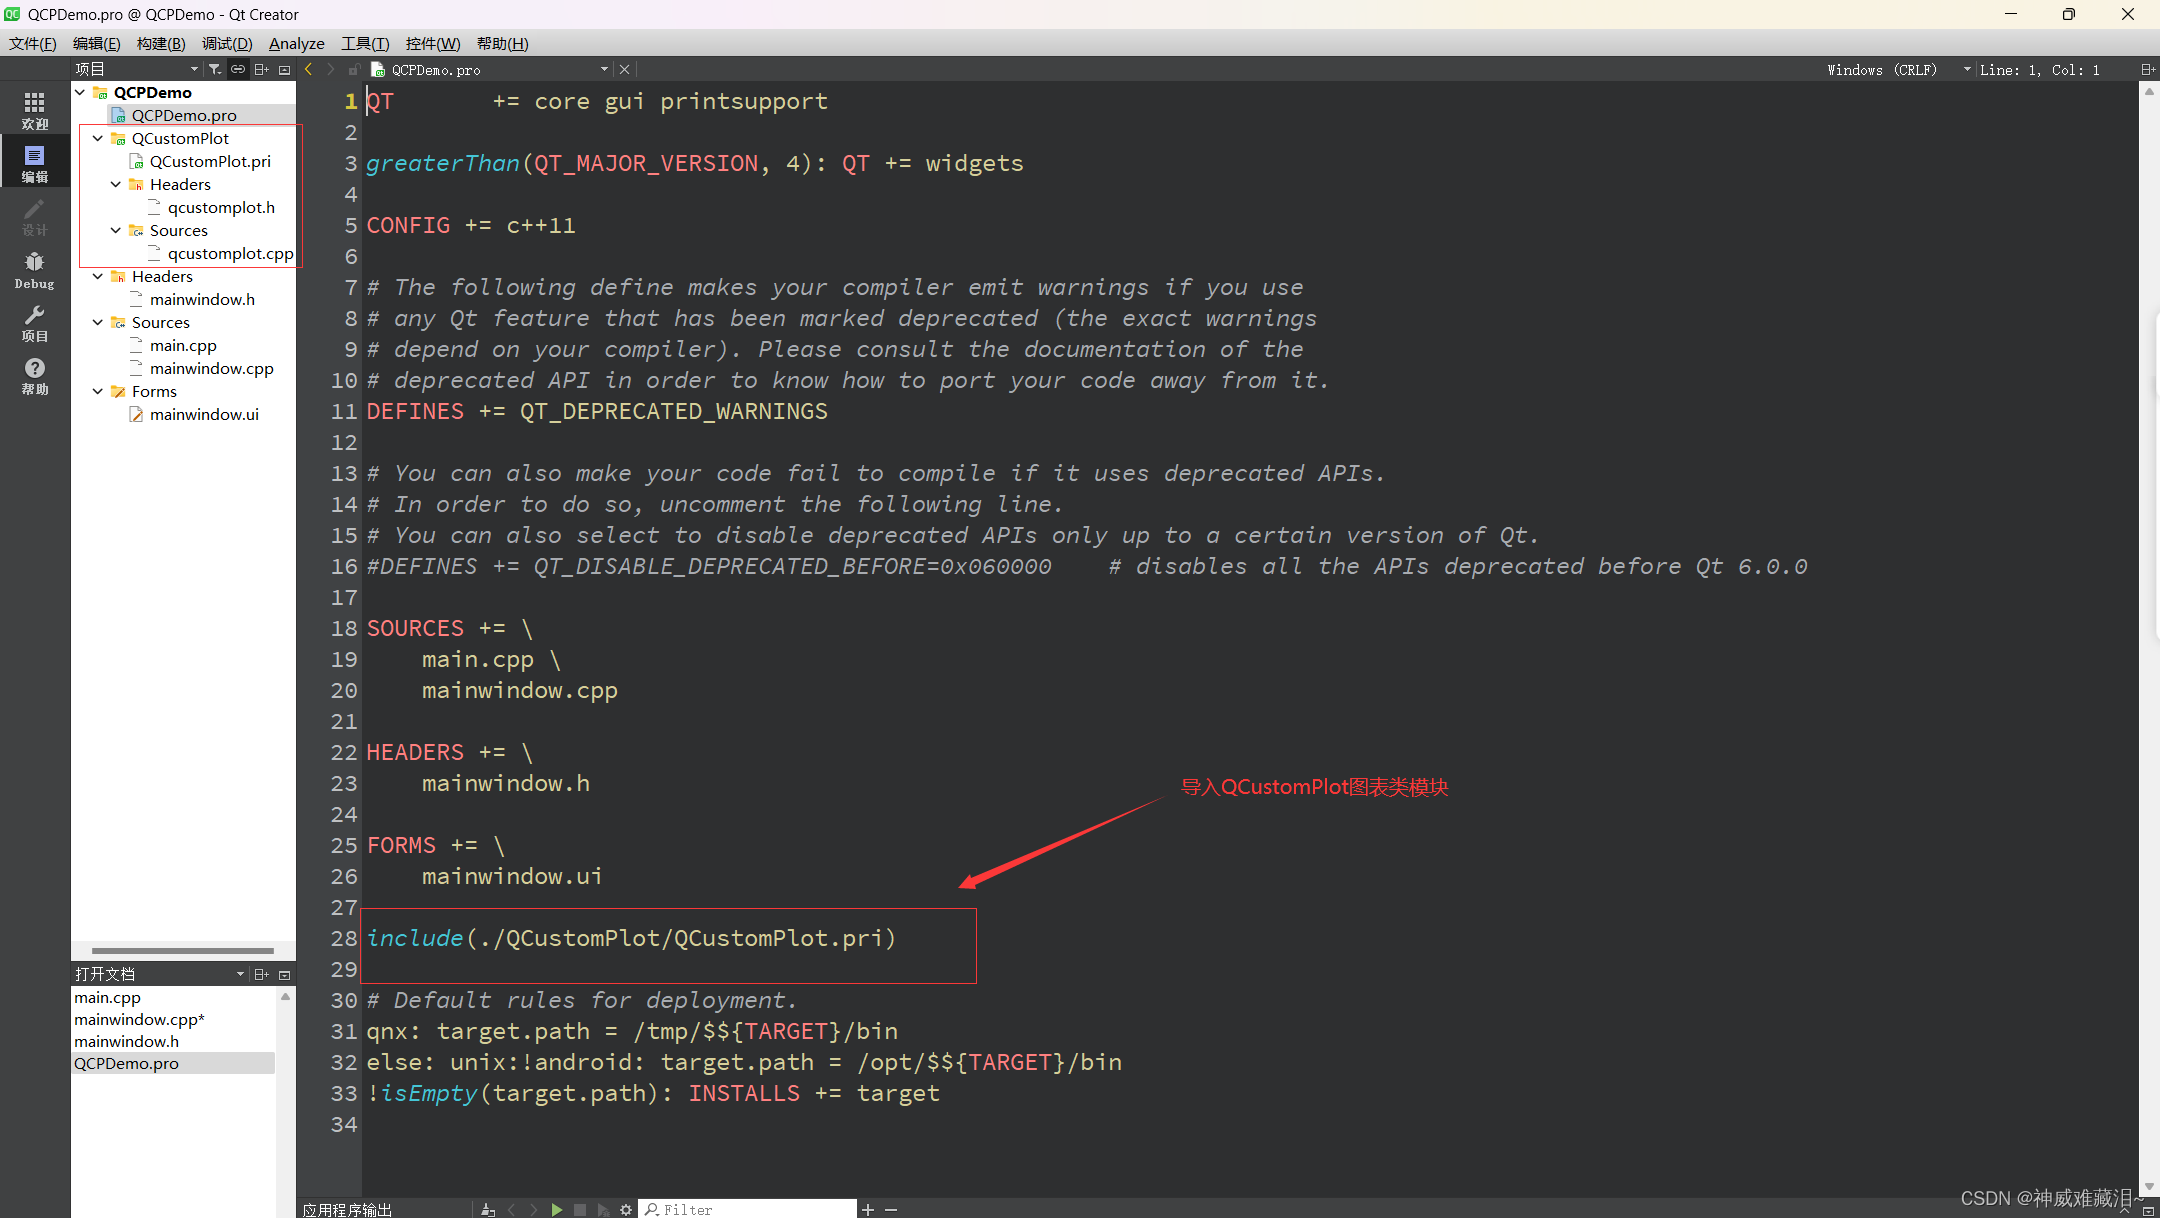
如上是通过include将QCustomPlot这个图表类模块导入到主项目工程中,实现了模块化管理项目,其次我们要导入Qt中的打印模块(printsupport)。

QCustomPlot.pri中的qmake语句如下:

4.3、控件提升
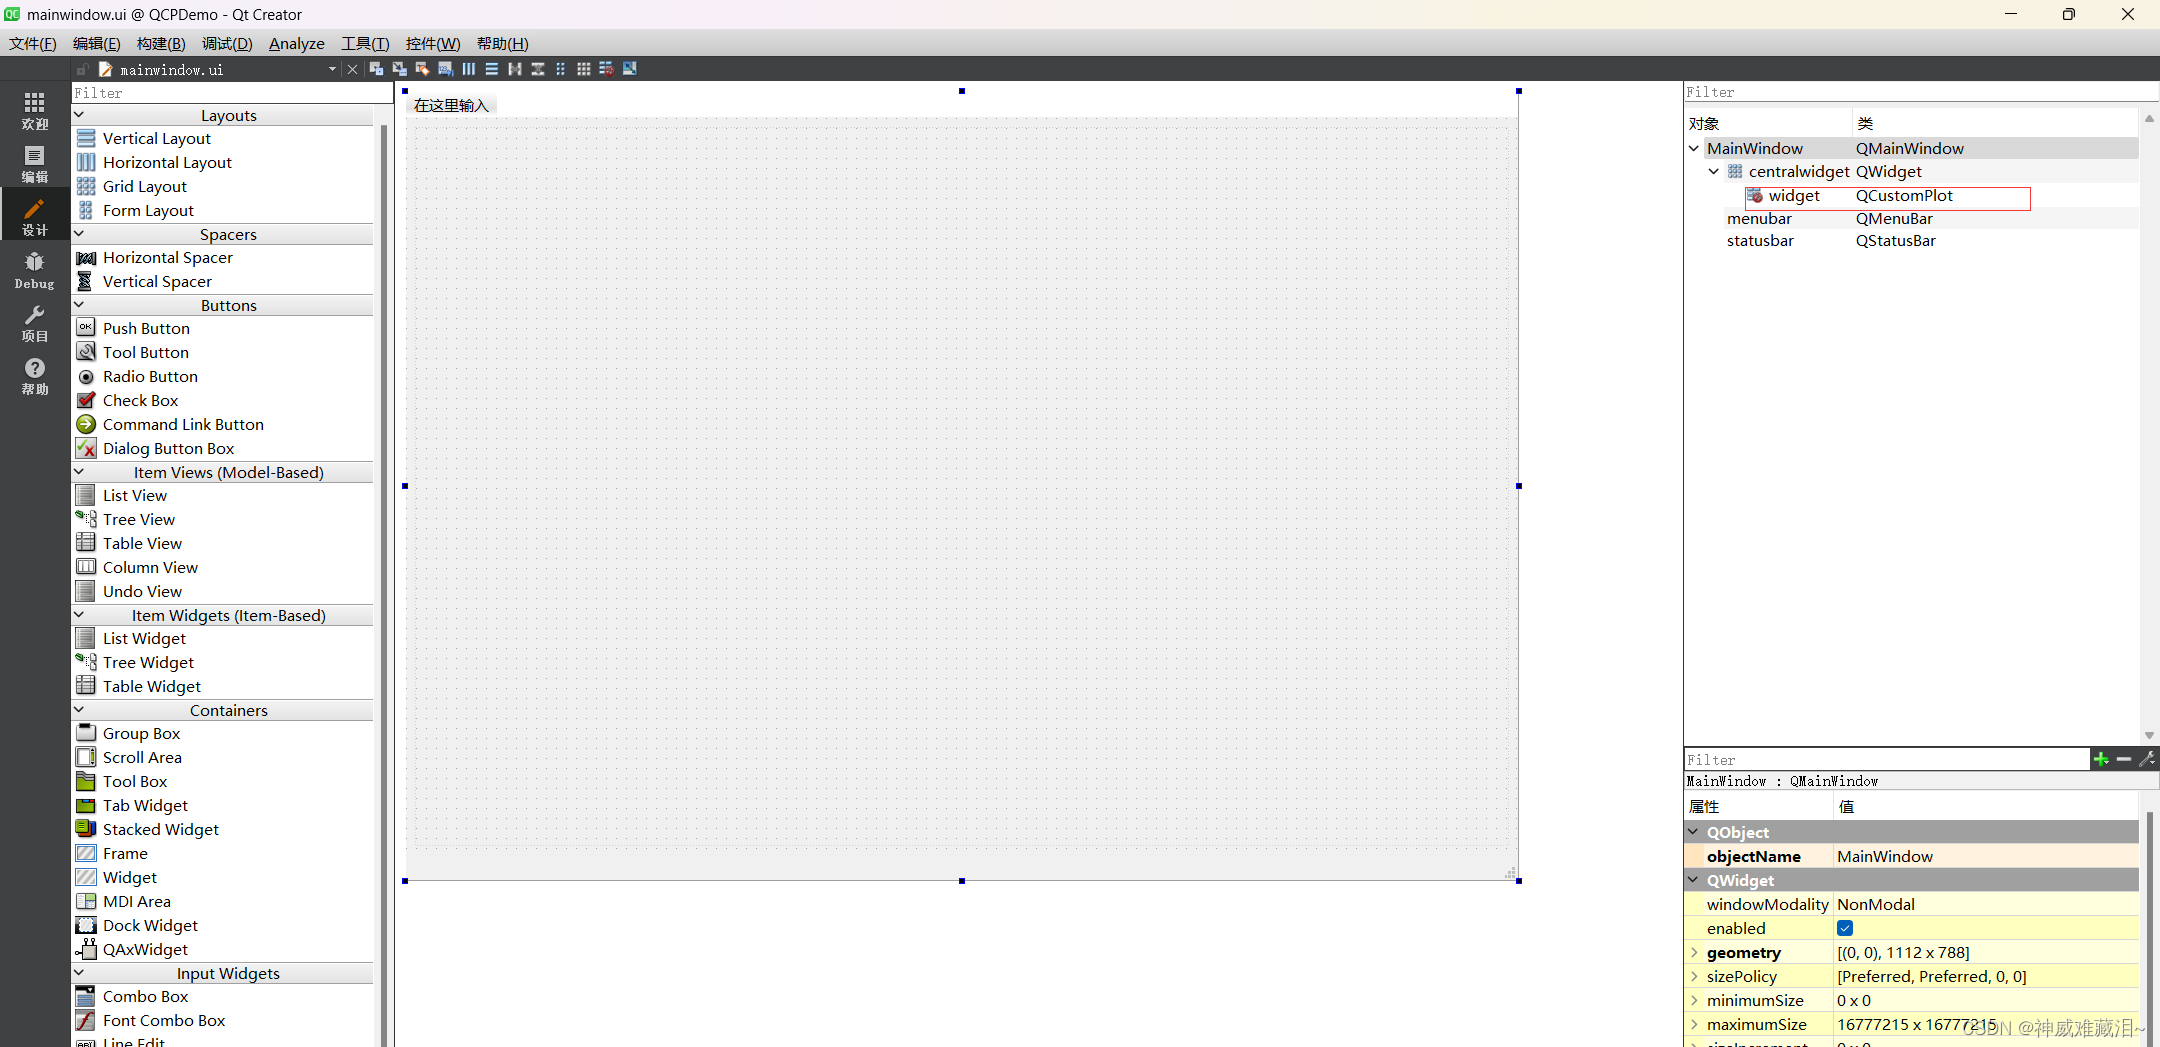
在QtDesinger中设计ui界面,拖拽一个widget控件放入主窗体中,然后对主窗体使用网格布局:
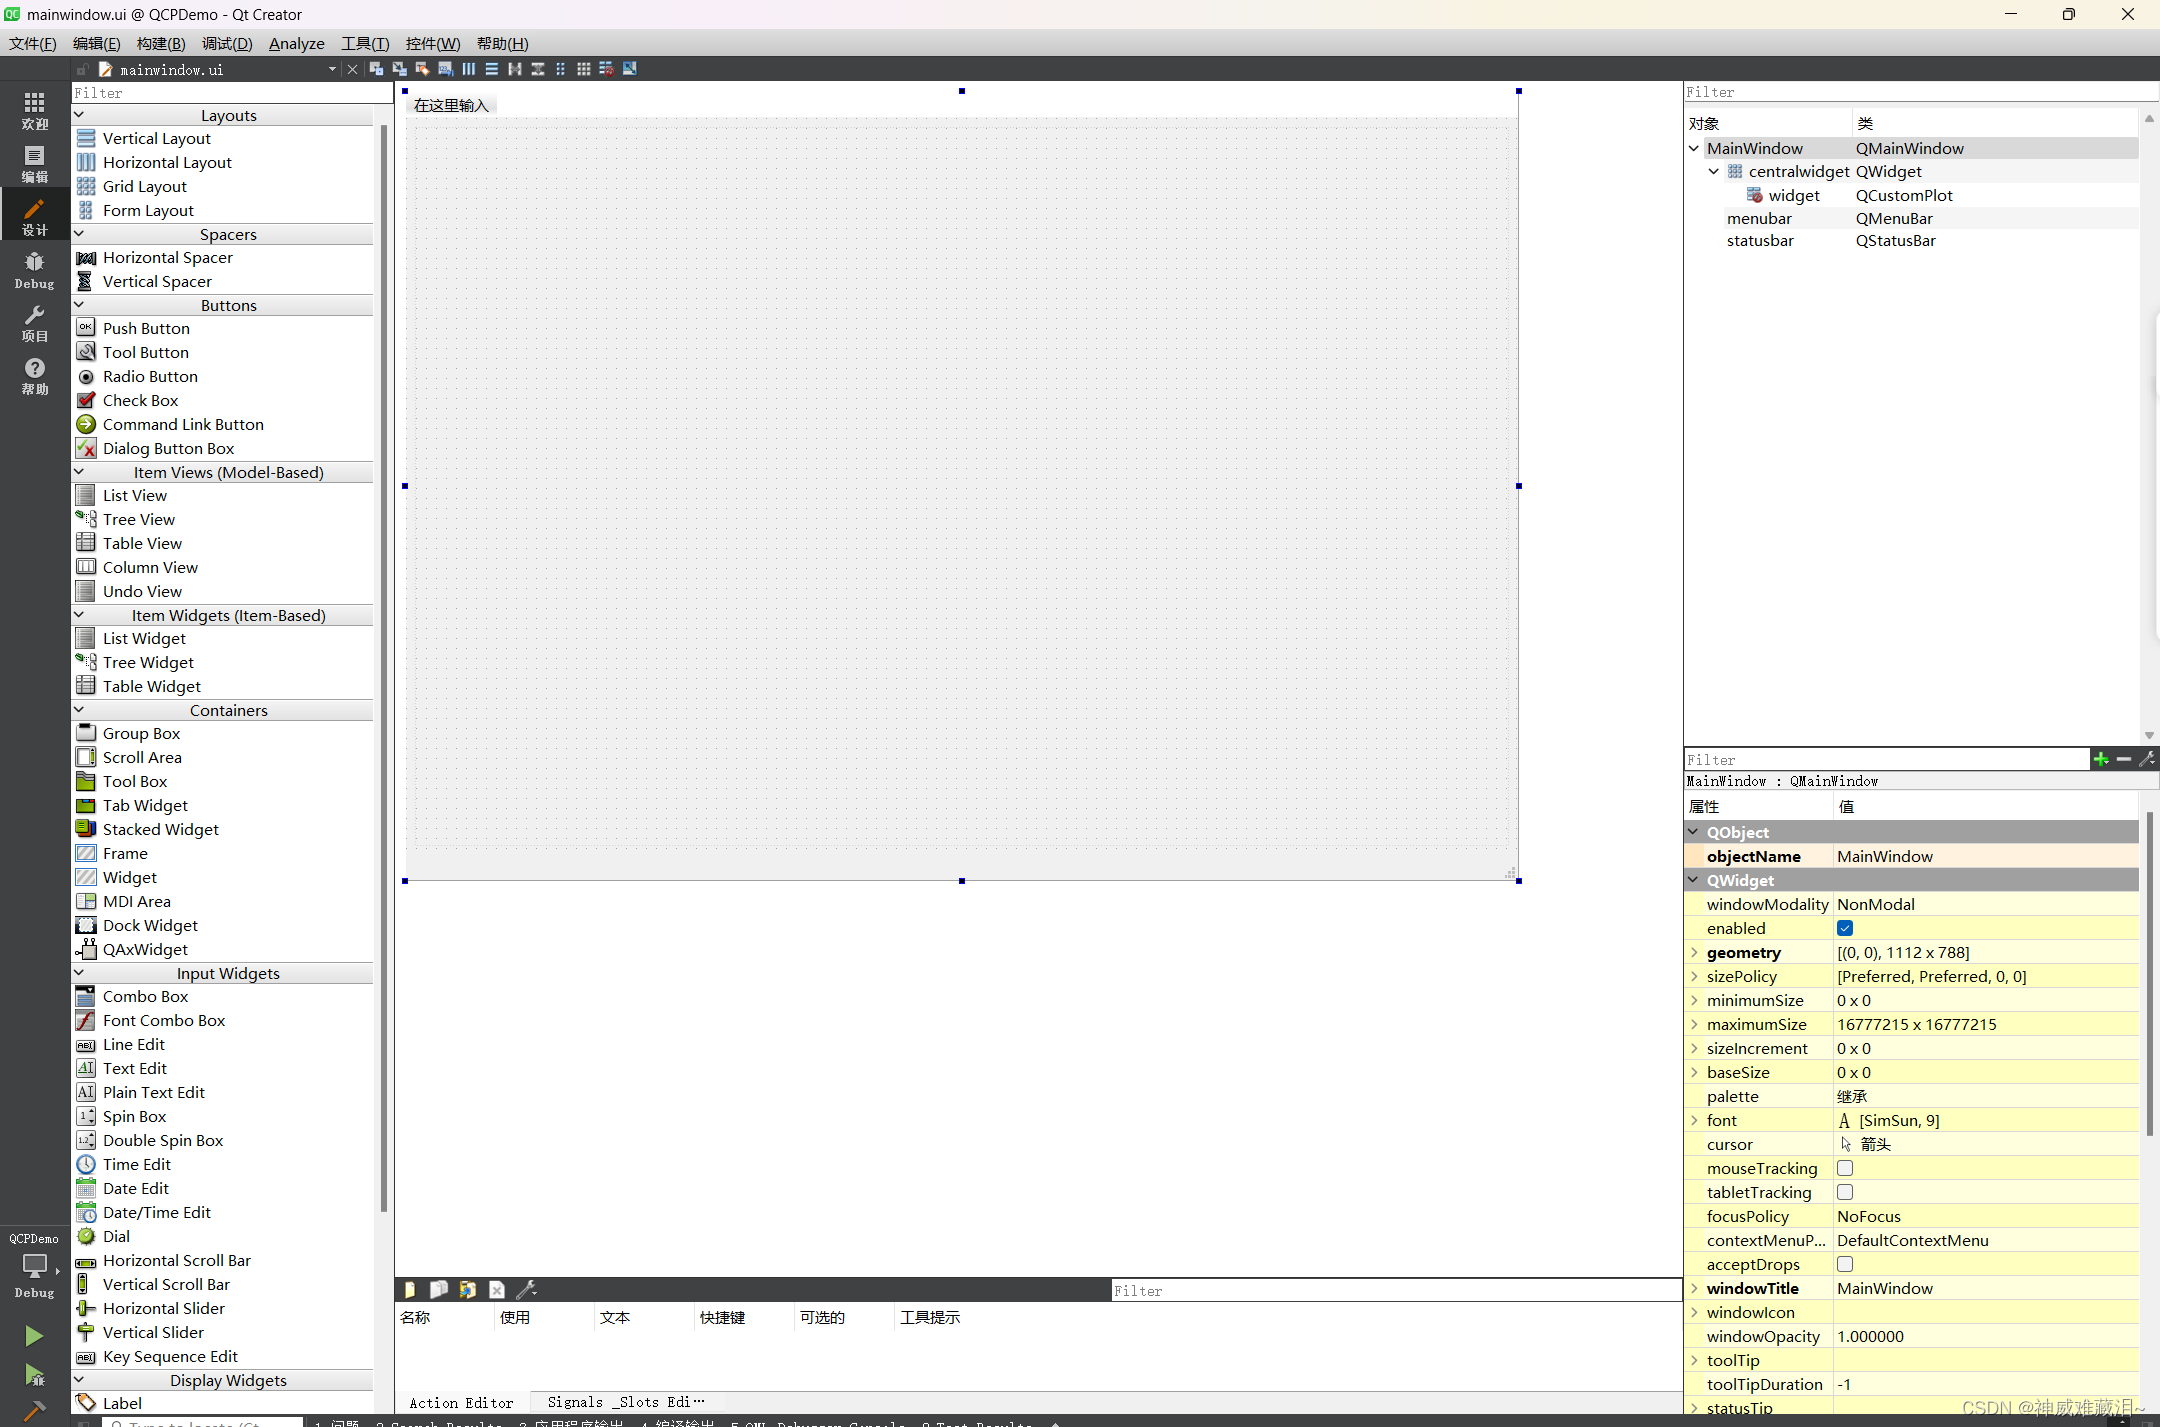
右击widget控件,选择提升为,就会弹出一个提升控件的对话框,提升的类名称选择QCustomPlot,头文件为QCustomPlot/qcustomplot.h:
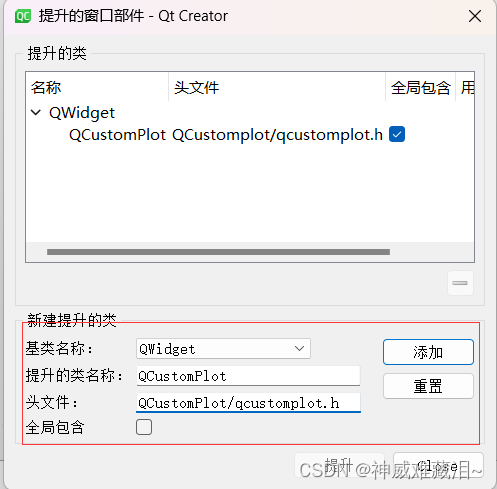
当右侧widget控件的类名显示为QCustomPlot时,则代表成功:
5、完整代码
mainwindow.h如下:
#ifndef MAINWINDOW_H
#define MAINWINDOW_H

#include <QMainWindow>
#include"QCustomplot/qcustomplot.h"

QT_BEGIN_NAMESPACE
namespace Ui { class MainWindow; }
QT_END_NAMESPACE

class MainWindow : public QMainWindow
{
    Q_OBJECT

public:
    MainWindow(QWidget *parent = nullptr);
    ~MainWindow();
    void plotDemo1();

private:
    Ui::MainWindow *ui;
};
#endif // MAINWINDOW_H
mainwindow.cpp如下:
#include "mainwindow.h"
#include "ui_mainwindow.h"

MainWindow::MainWindow(QWidget *parent)
    : QMainWindow(parent)
    , ui(new Ui::MainWindow)
{
    ui->setupUi(this);
    this->setWindowTitle("QCustomPlot Demo");
    plotDemo1();
}

MainWindow::~MainWindow()
{
    delete ui;
}

void MainWindow::plotDemo1()
{
    this->ui->widget->addGraph();  //添加数据曲线
    //为坐标轴添加标签
    this->ui->widget->xAxis->setLabel("X");
    this->ui->widget->yAxis->setLabel("Y");
    //设置坐标轴范围
    this->ui->widget->xAxis->setRange(-1,1);
    this->ui->widget->yAxis->setRange(0,1);
    //模拟数据点
    QVector<double> x(101),y(101);
    for(int i=0;i<101;i++)
    {
        x[i]=i/50.0-1;
        y[i]=x[i]*x[i];
    }
    //为数据曲线赋值
    this->ui->widget->graph(0)->setData(x,y);
    //设置图例名称
    this->ui->widget->graph(0)->setName("First QCP Demo");
    //显示图例
    this->ui->widget->legend->setVisible(true);
    //刷新图表
    this->ui->widget->replot();
}
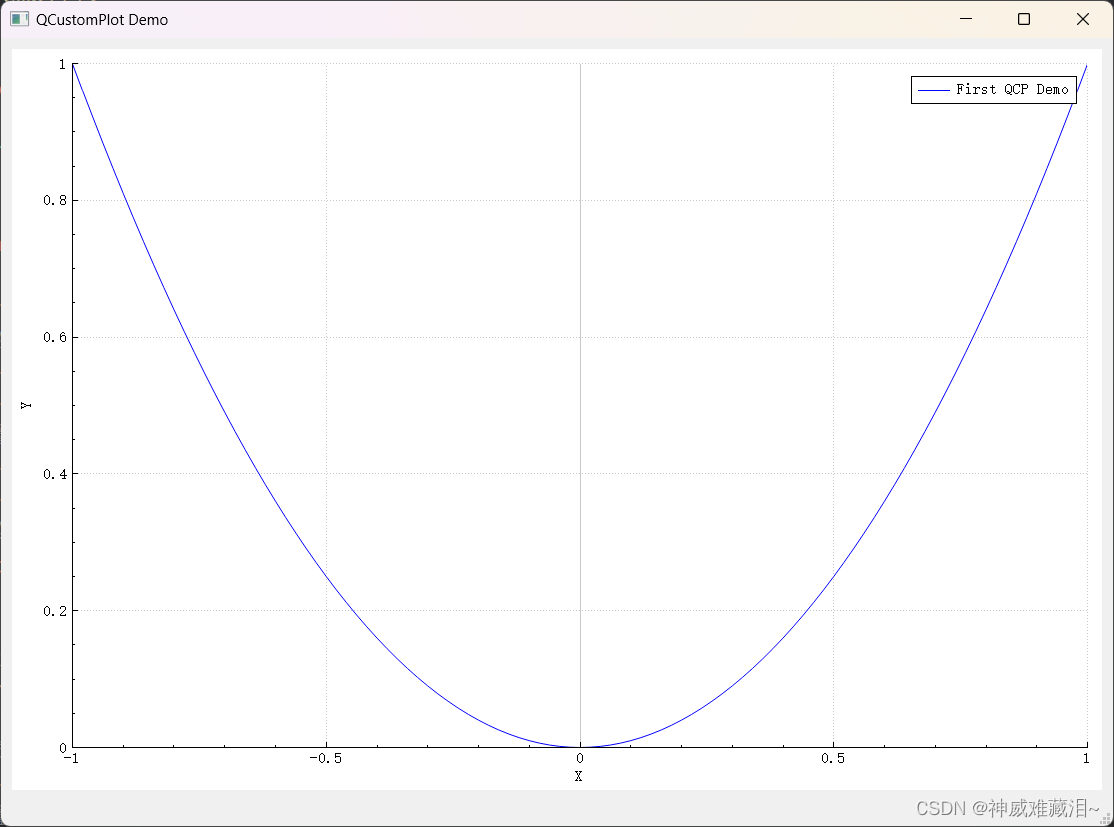
6、效果图


 7574
7574


 被折叠的 条评论
为什么被折叠?
被折叠的 条评论
为什么被折叠?
 到【灌水乐园】发言


