var chartDom = document.getElementById("chartmain_zhe");
var myChart = echarts.init(chartDom, );
let array = await this.GetAjax('api/WorkOrder/GetReport2')
array.details.forEach((itme) => {
itme.label = {
show: true,
position: 'top',
value: 'data',
color: [],
formatter: function (params) {
//seriesName为折线类型
if(params.seriesName=='人均产能'){
return (params.value) + '(件/天)'
}
if(params.seriesName=='故障时间'){
return (params.value) + '(S)'
}
if (params.seriesName == '换料时间') {
return (params.value) + '(S)'
}
// if(params.seriesId.indexof(''))
}
}
})
// array.details[1].lineStyle = {
// color: 'yellow'
// }
let option = {
title: {
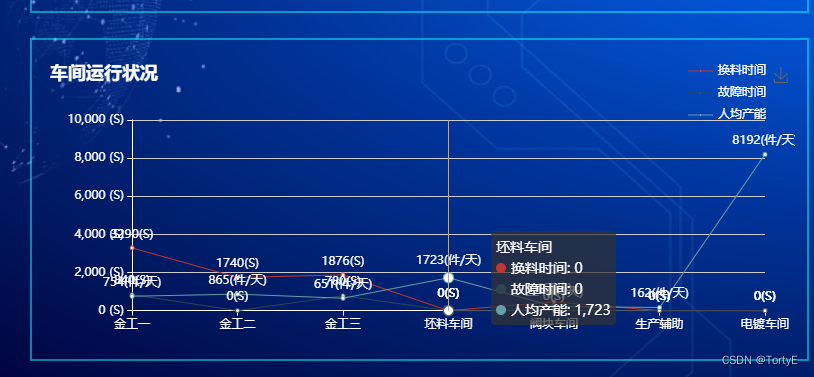
text: '车间运行状况',
textStyle: {
color: 'white'
},
},
tooltip: {
trigger: 'axis'
},
legend: {
orient: 'vertical',
left: '85%',
top: 'top',
width: 100,
itemWidth: 25,
itemHeight: 1,
textStyle: {
color: []
},
data: array.dimensions
},
grid: {
left: '3%',
right: '4%',
bottom: '3%',
containLabel: true
},
toolbox: {
feature: {
saveAsImage: {}
}
},
xAxis: {
type: 'category',
boundaryGap: false,
data: array.depts,
axisLine: {
lineStyle: {
color: '#fff'
}
},
// data: ['班组1', '班组2', '班组3', '班组4', '班组5',]
},
yAxis: {
type: 'value',
axisLine: {
lineStyle: {
color: '#fff'
}
},
axisLabel: {
formatter: '{value} (S)'
},
},
series: array.details
};
option && myChart.setOption(option);


 3766
3766


 被折叠的 条评论
为什么被折叠?
被折叠的 条评论
为什么被折叠?
 到【灌水乐园】发言


