


在这篇文章中,我们将看到如何从 Elasticsearch 索引和 Kibana 的 CSV 报告中导出数据 - post-url 到 pandas 数据帧。 数据的可视化可以在 Kibana 中完成,但如果你想对数据进行更精细的分析并创建更动态的可视化,将数据导出到 pandas dataframe 将是一个不错的选择。
在如下的演示中,我将使用 Elastic Stack 8.5.3 来进行展示。
安装
为了说明问题的方便,我们可以选择只有基本安全的 Elastic Stack 安装。我们可以参考之前的文章 “Elastic Stack 8.0 安装 - 保护你的 Elastic Stack 现在比以往任何时候都简单” 中的 “如何配置 Elasticsearch 只带有基本安全” 章节。针对我们的安装,我们配置 Elasticsearch 的超级用户 elastic 的密码为 password。你也可以参考另外一篇文章 “Elasticsearch:如何在 Docker 上运行 Elasticsearch 8.x 进行本地开发” 进行安装。
准备数据
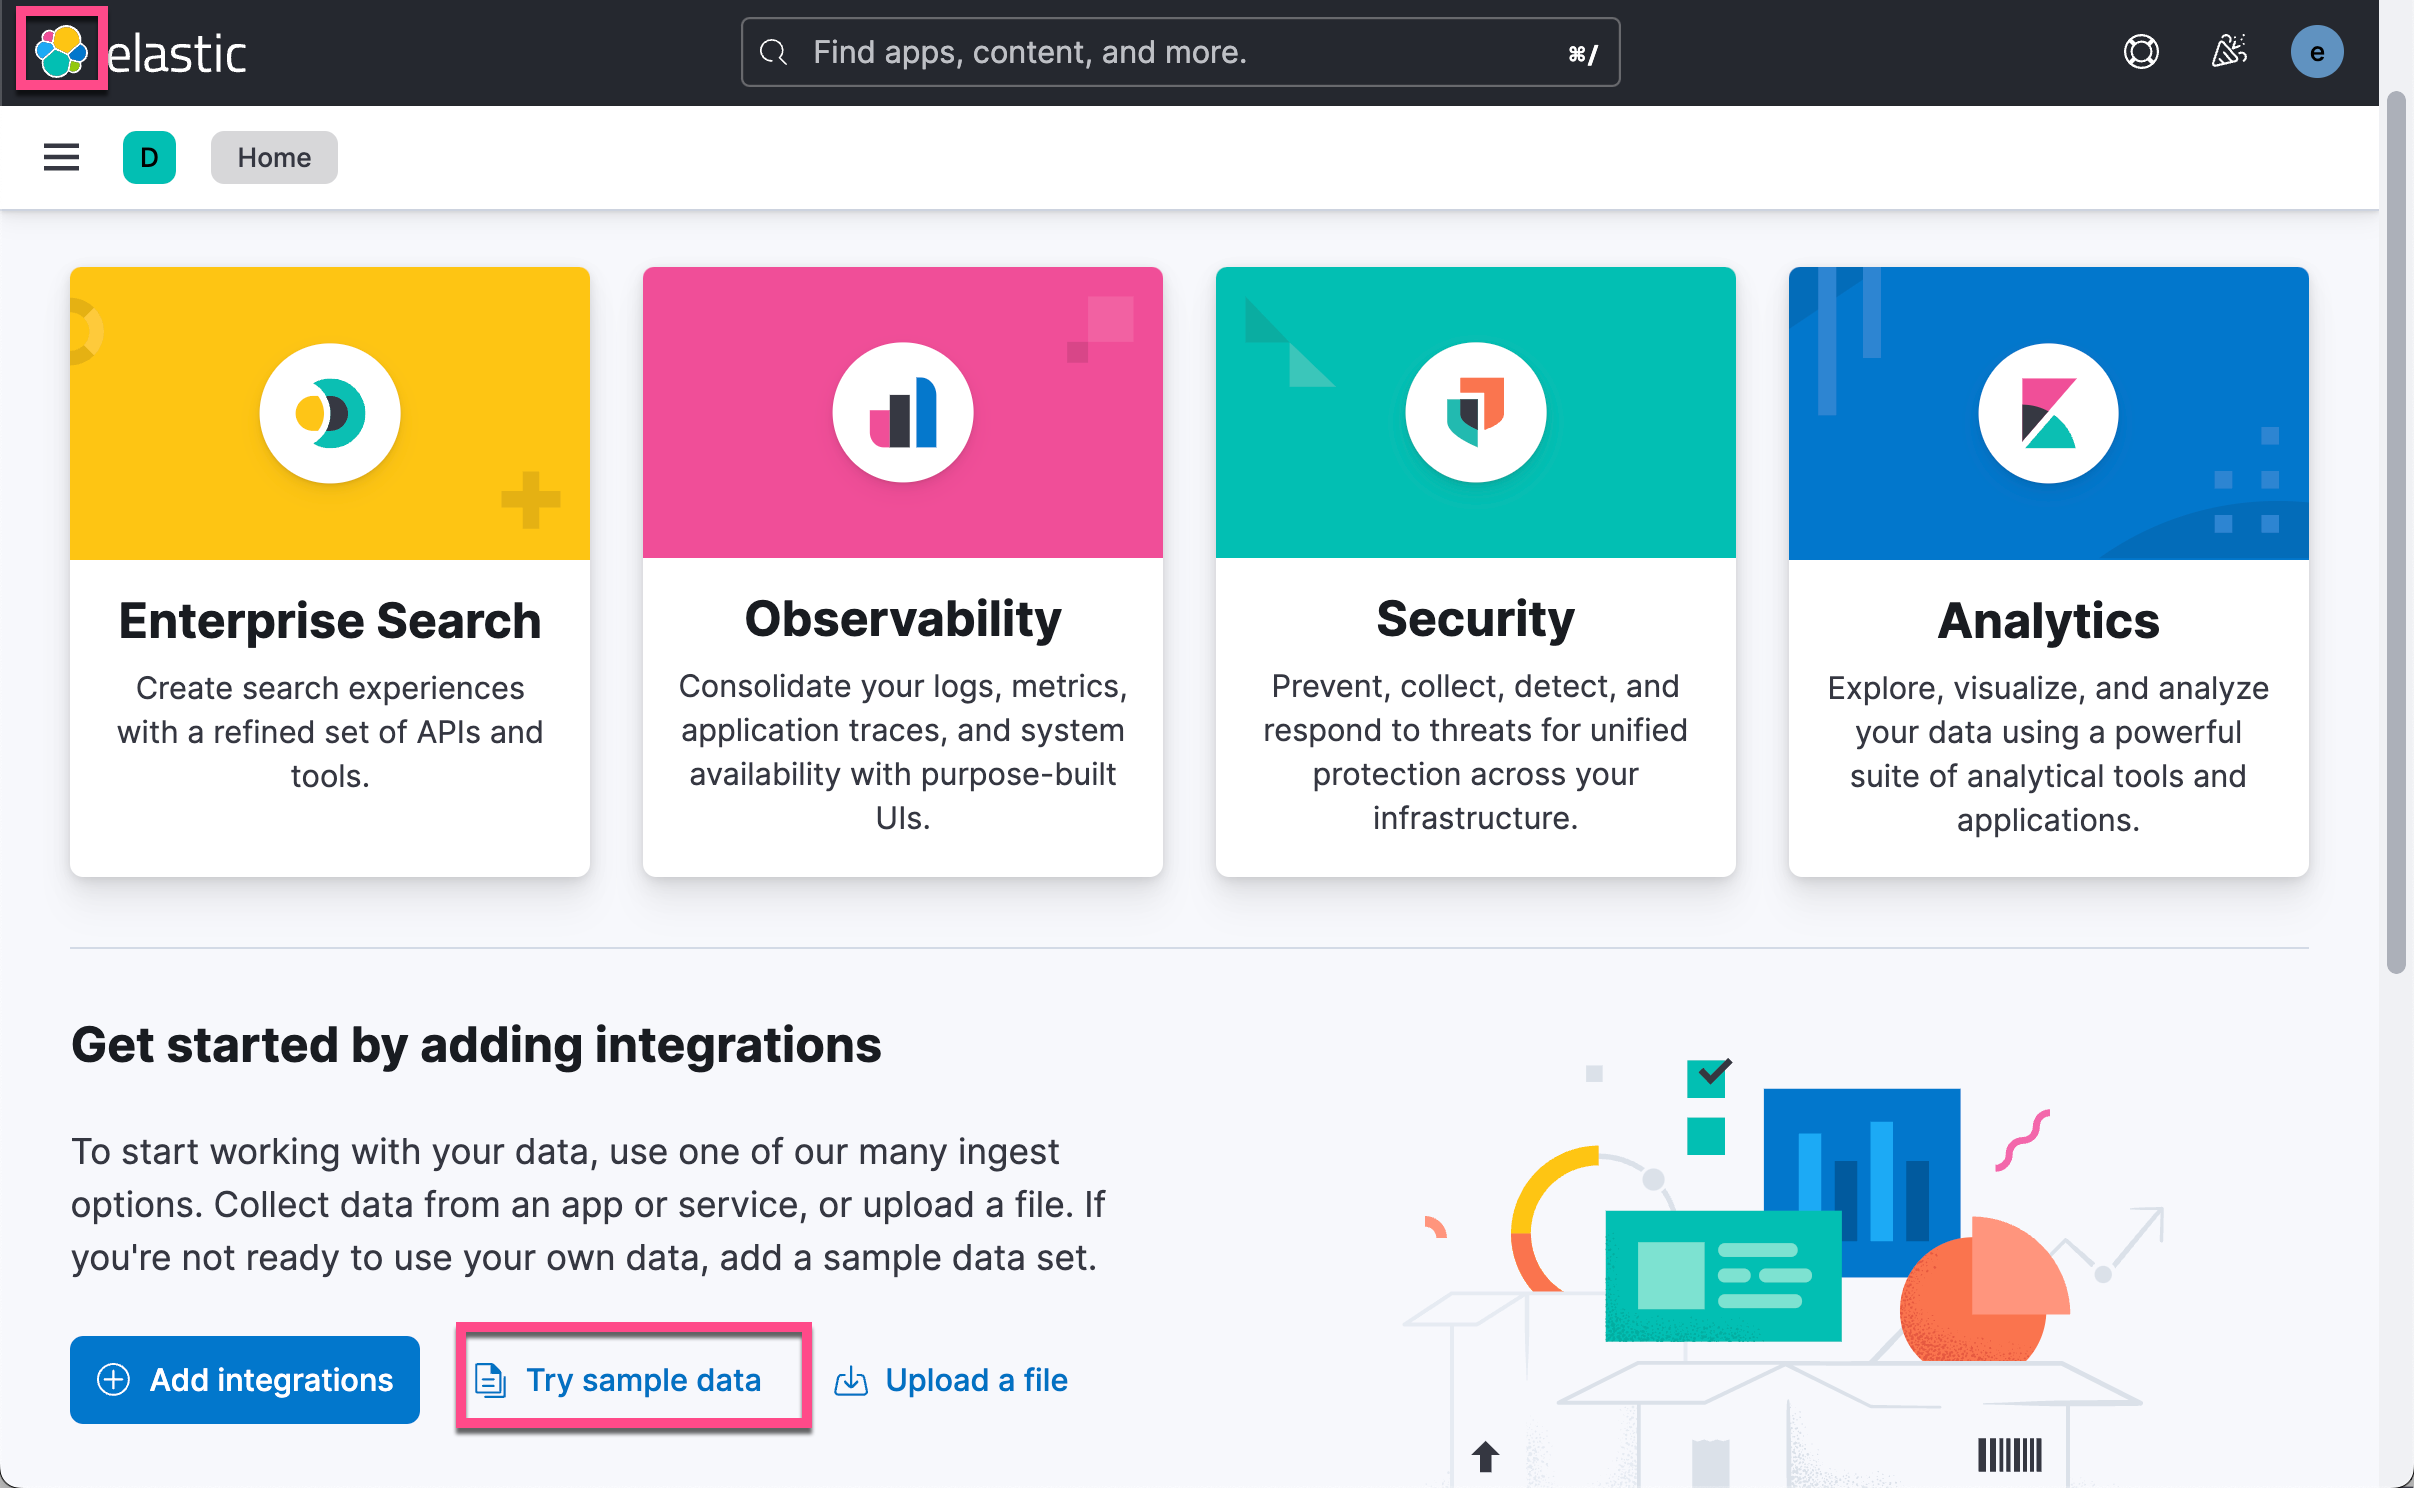
我们选用 Kibana 中自带的数据来进行展示。我们打开 Kibana:
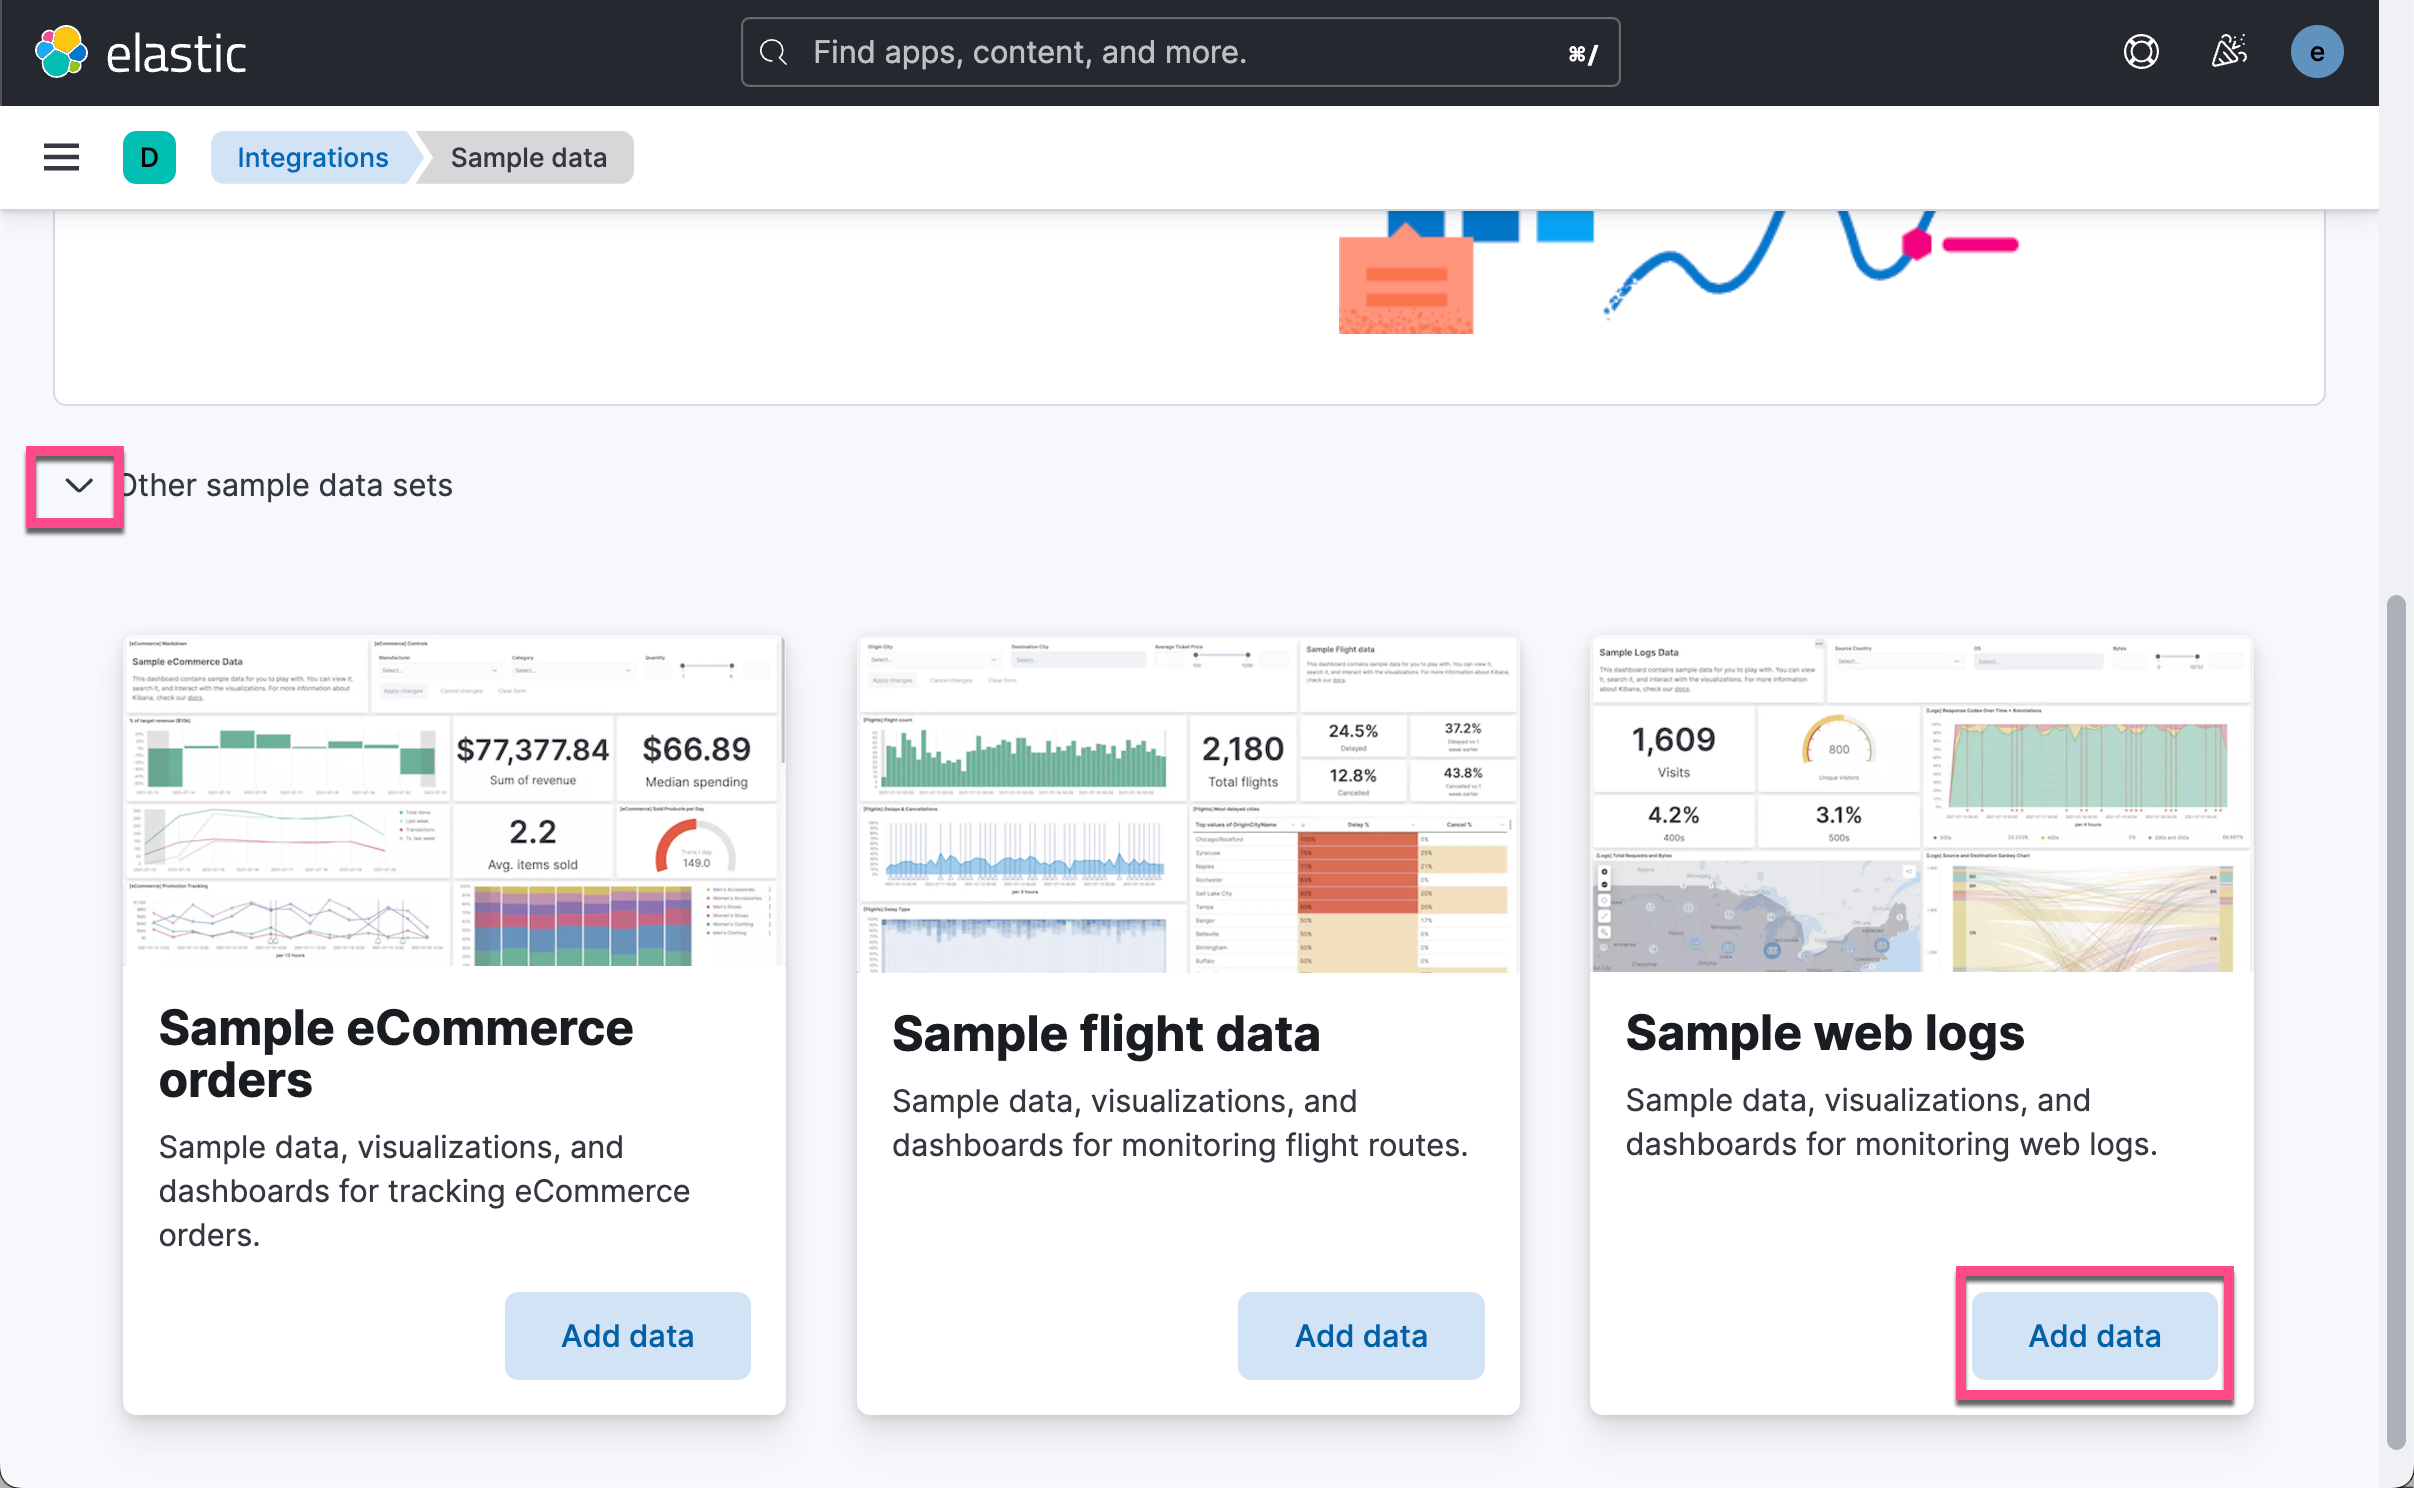
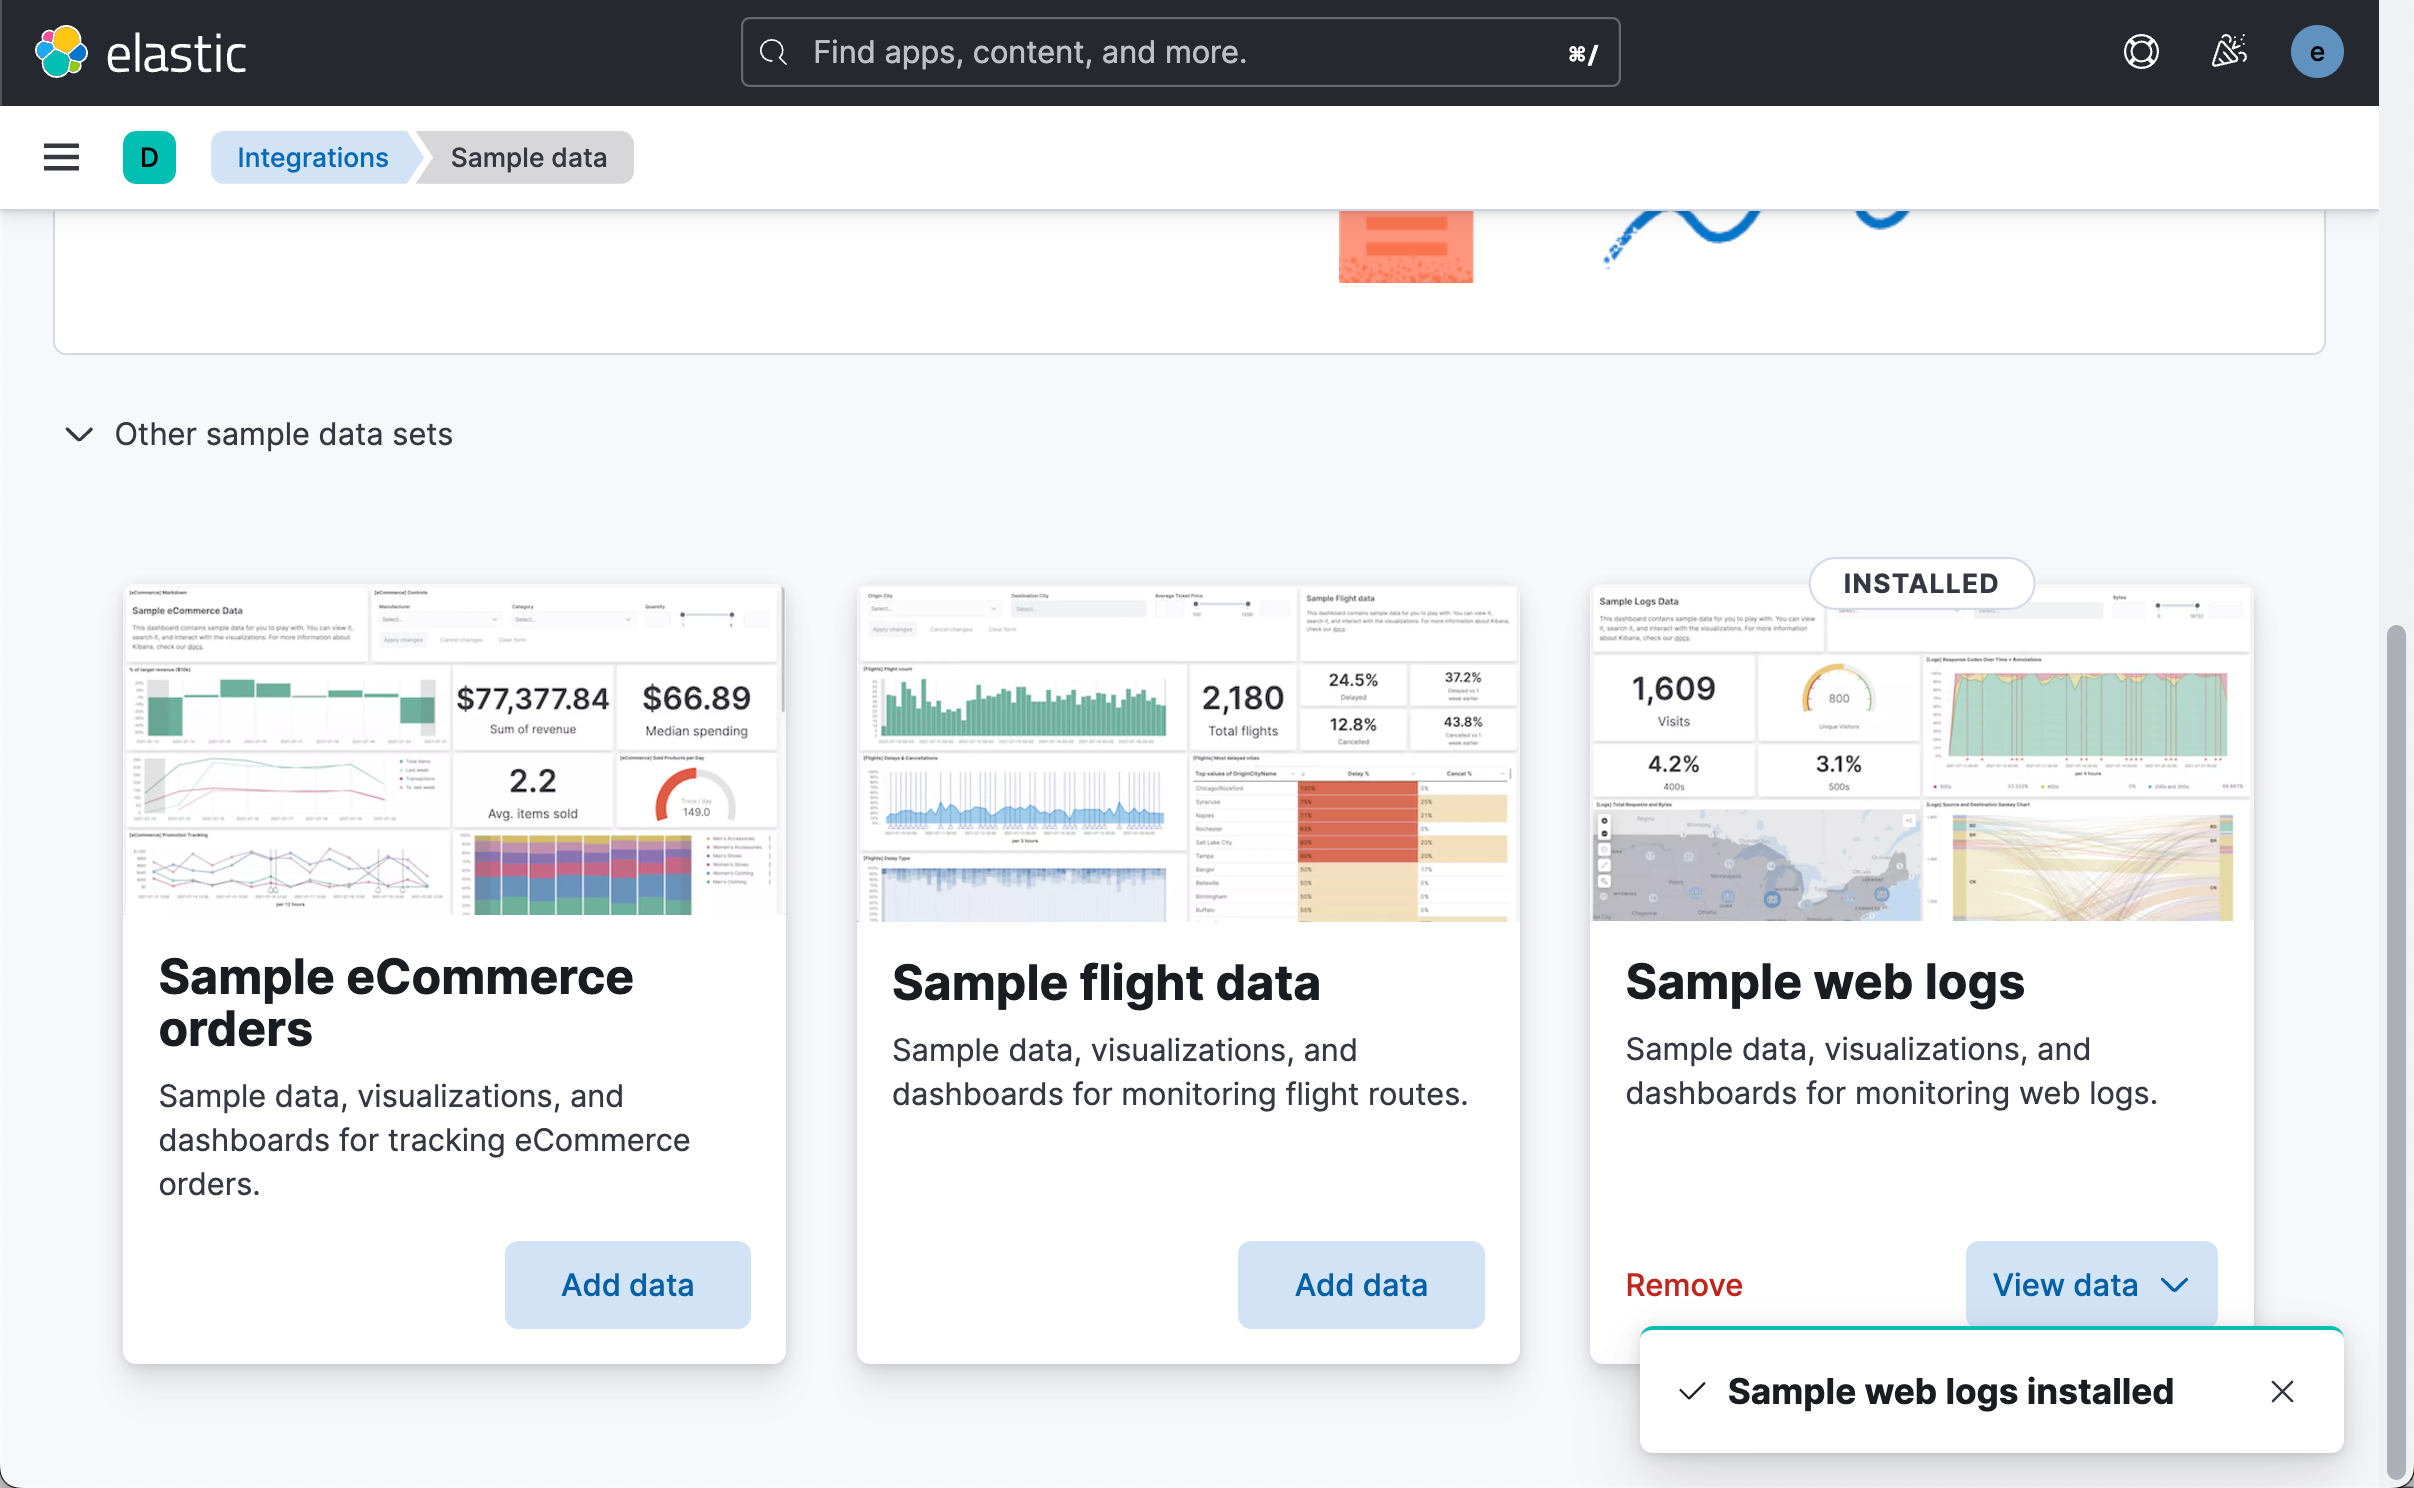
这样就有一个叫做 kibana_sample_data_logs 的索引在 Elasticsearch 中被创造。我们在 Discover 中打开:
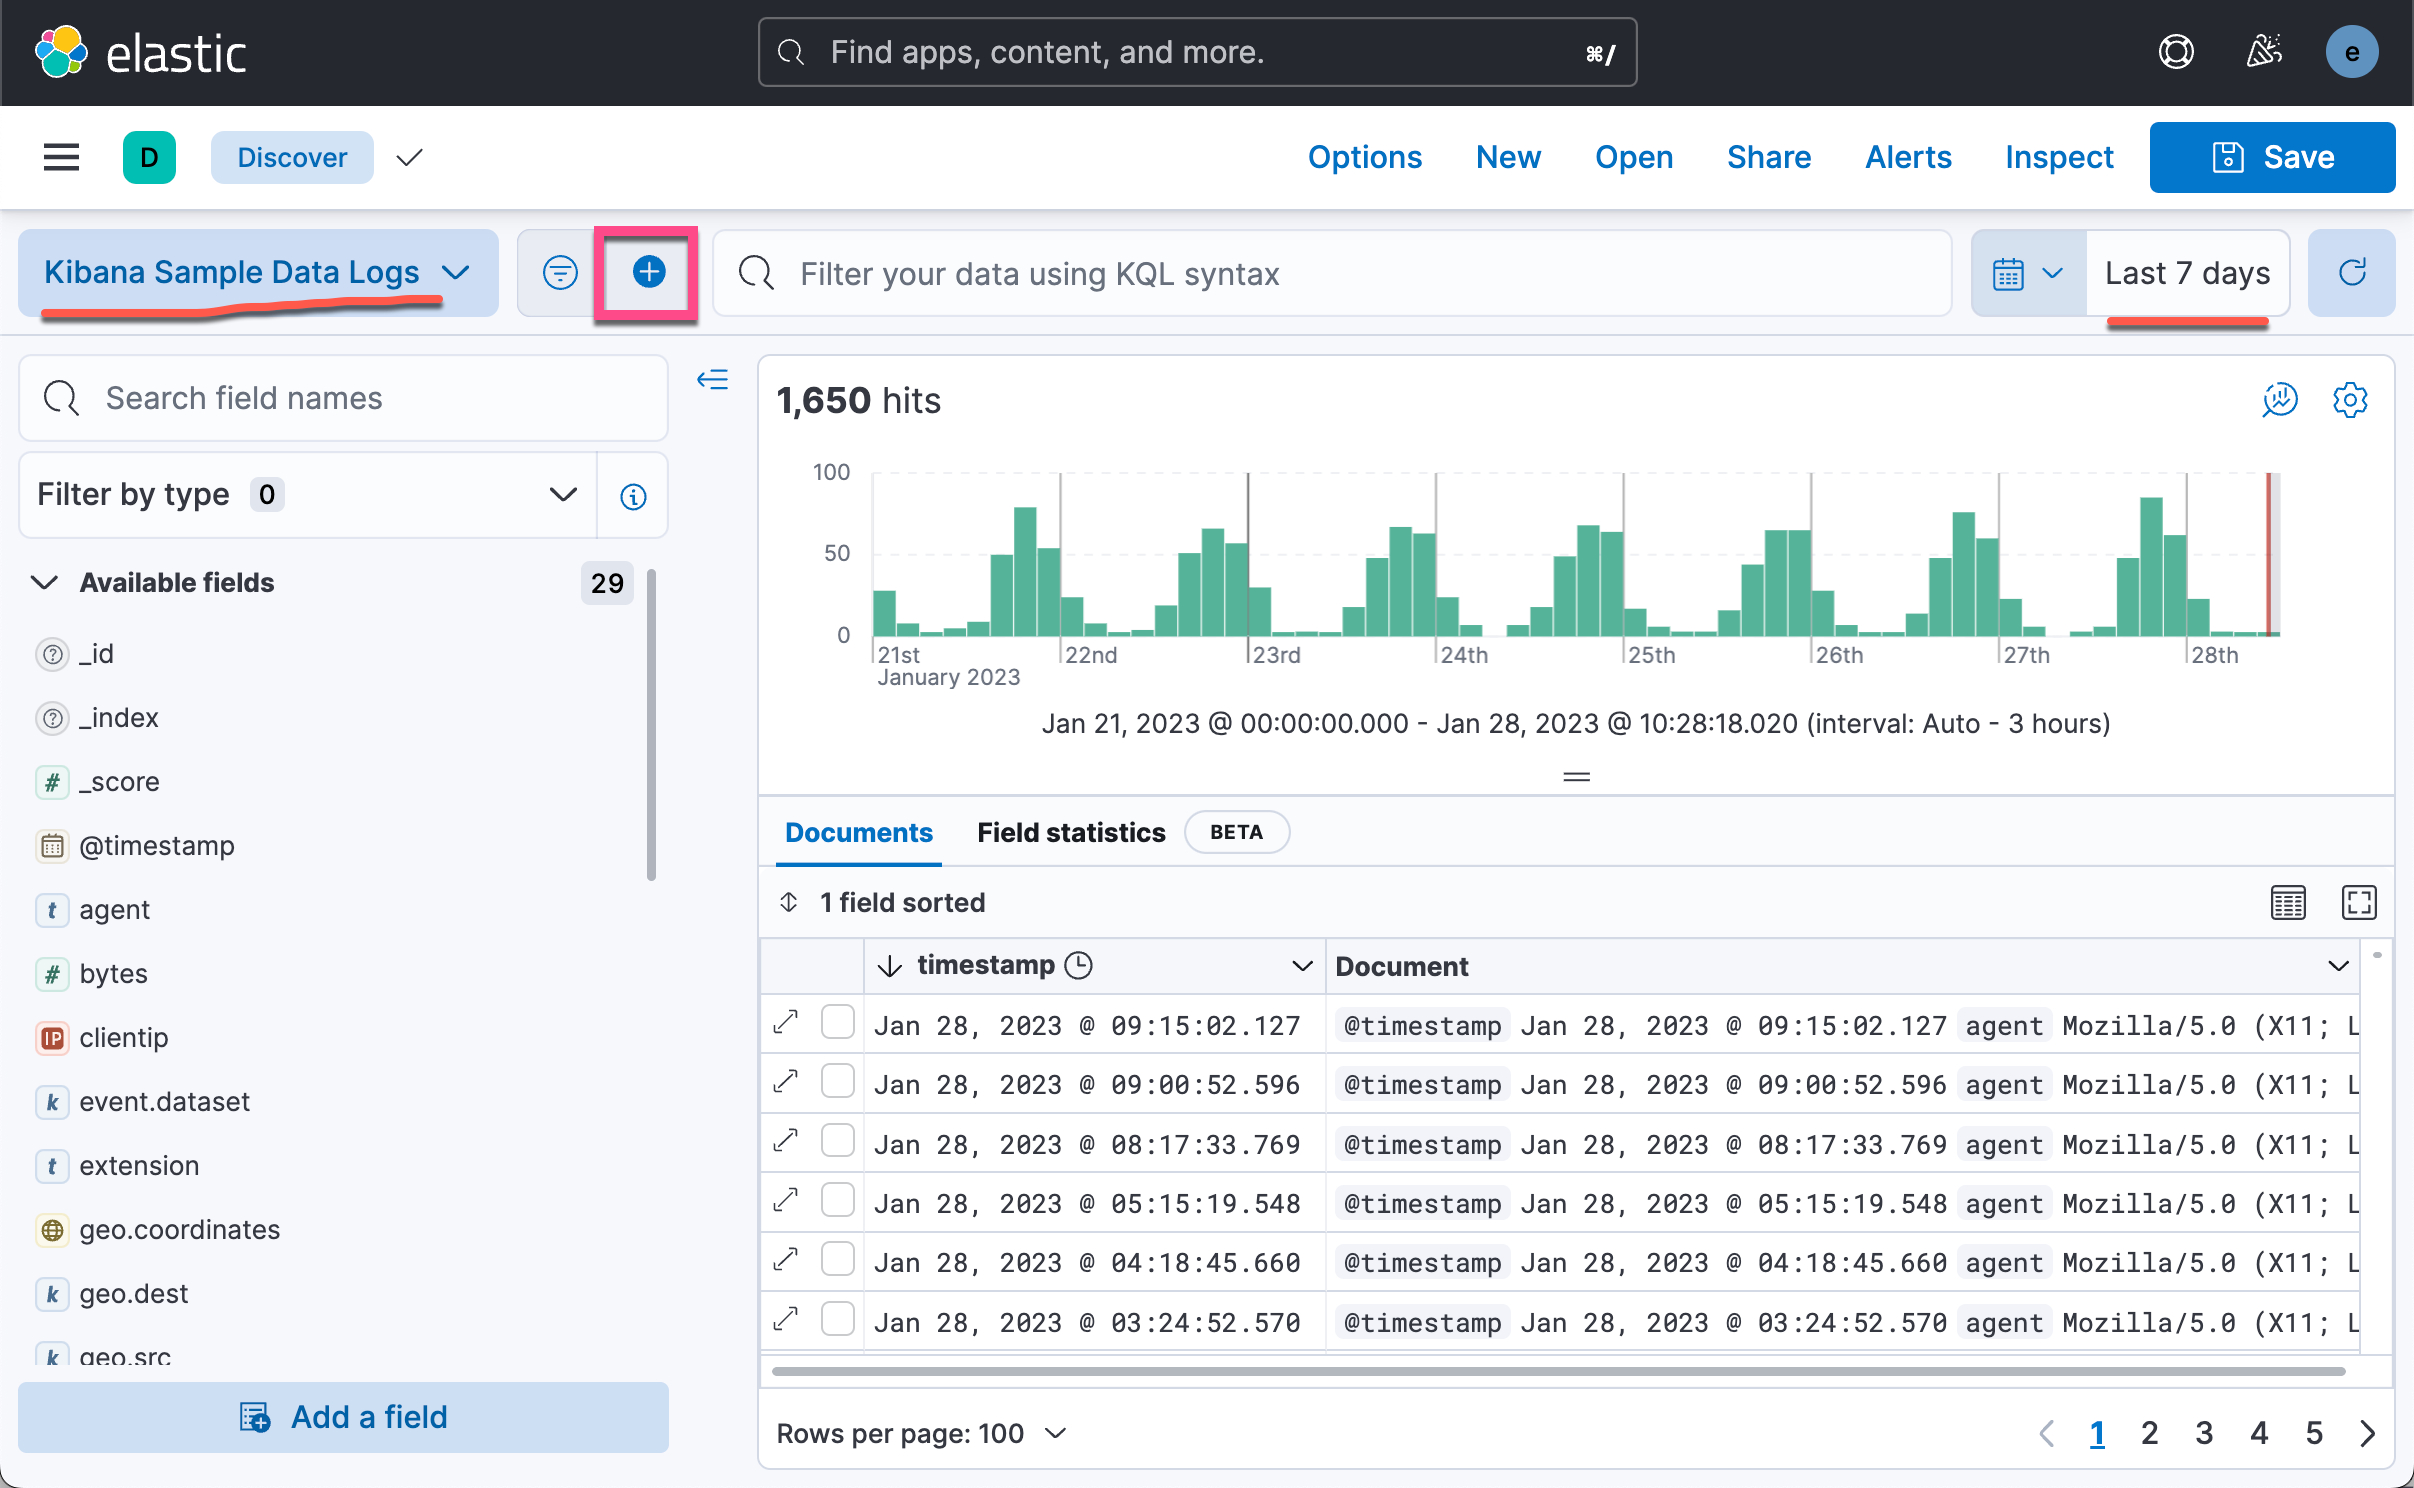
如上所示,我们可以看到数据的时序直方图。我们选择合适的时间区域,然后添加一个 filter:
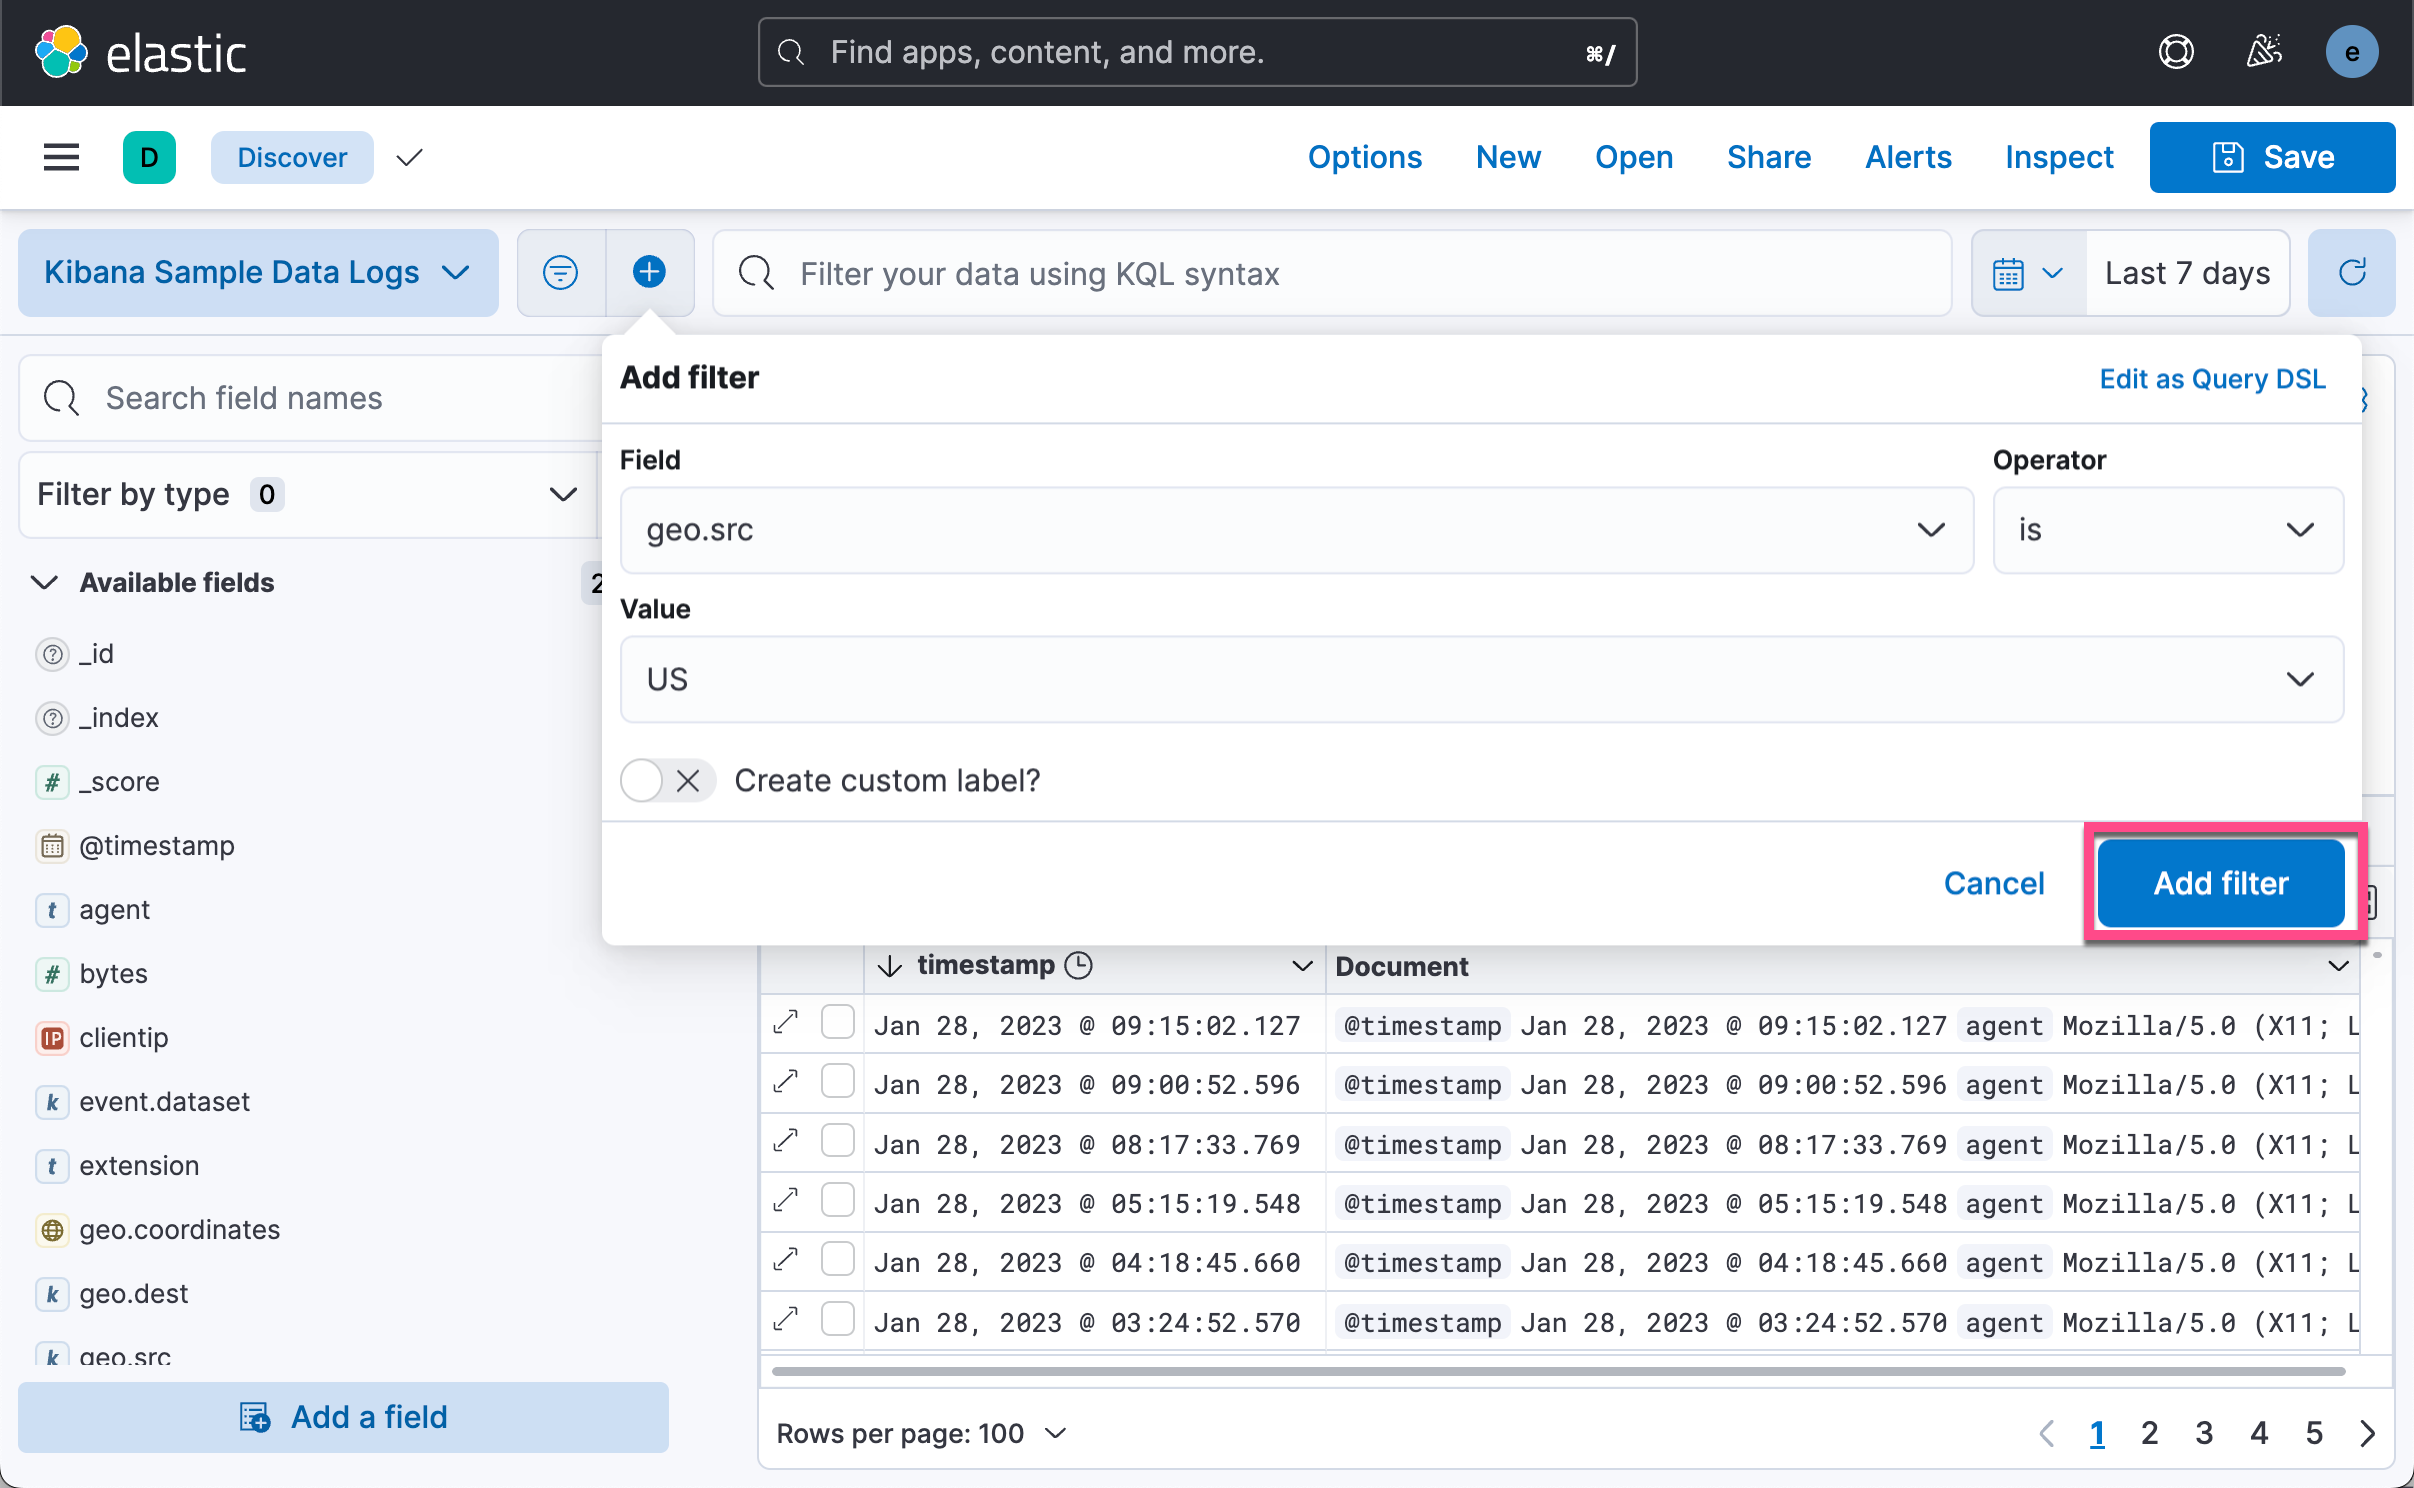
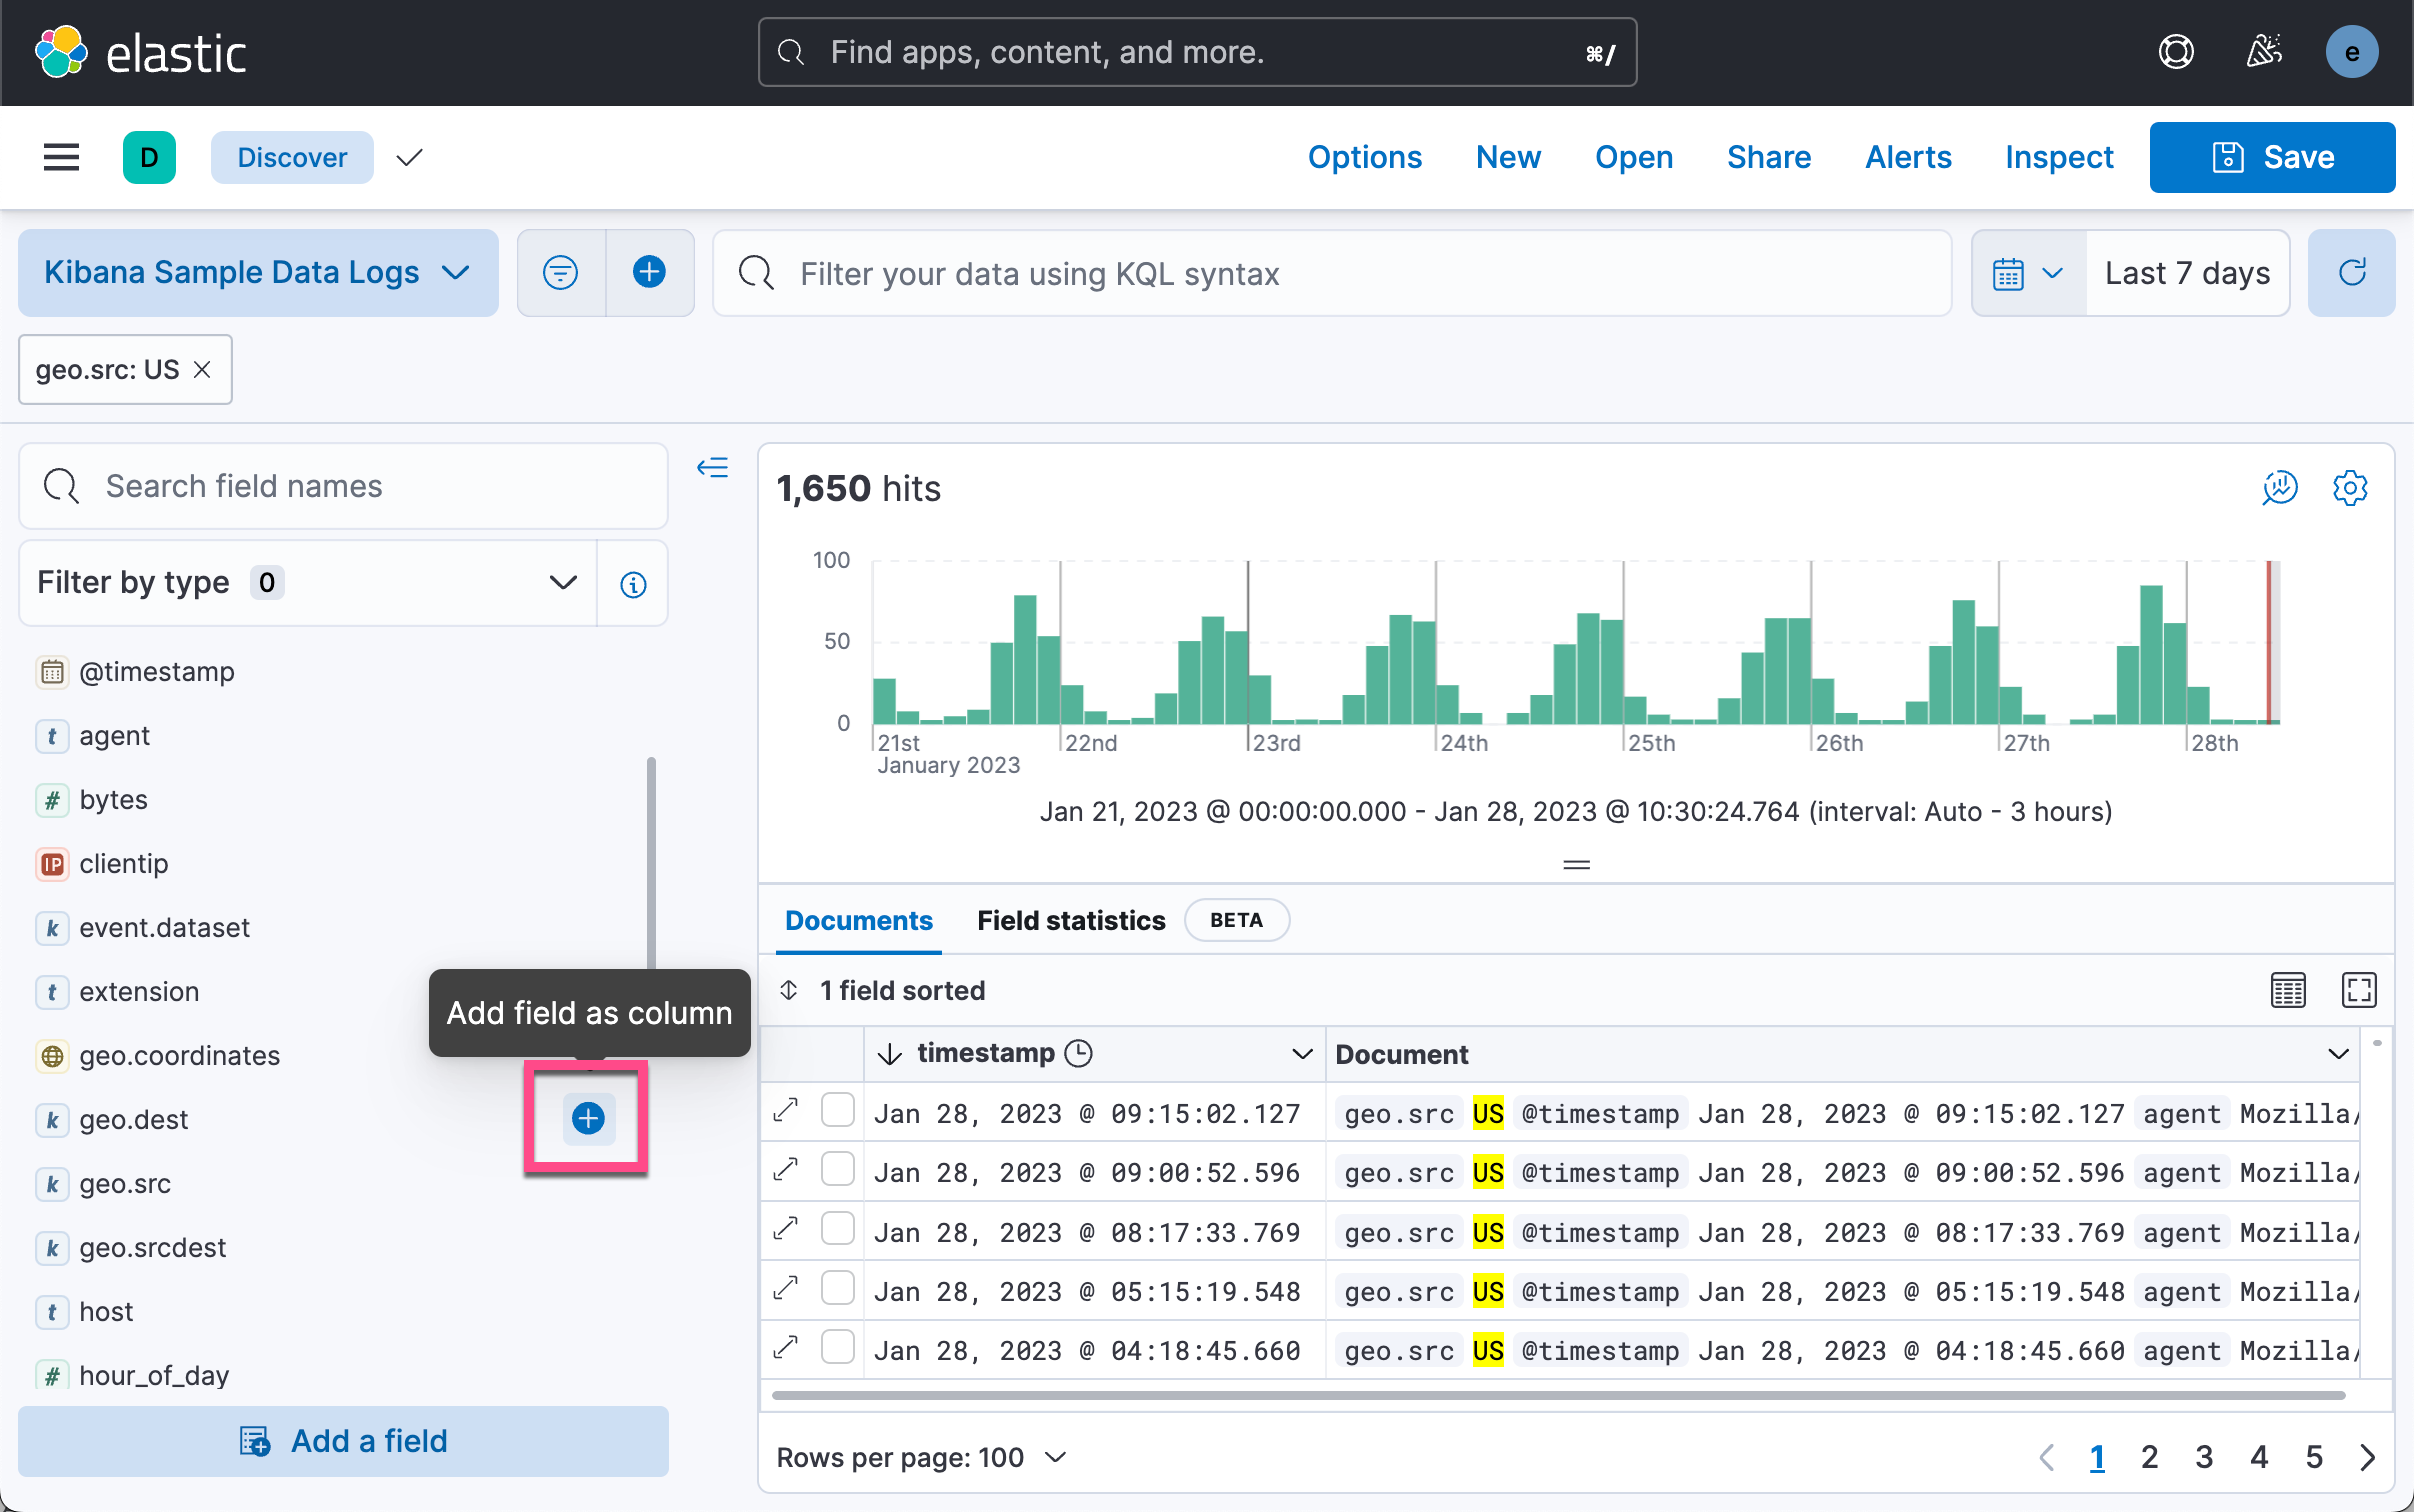
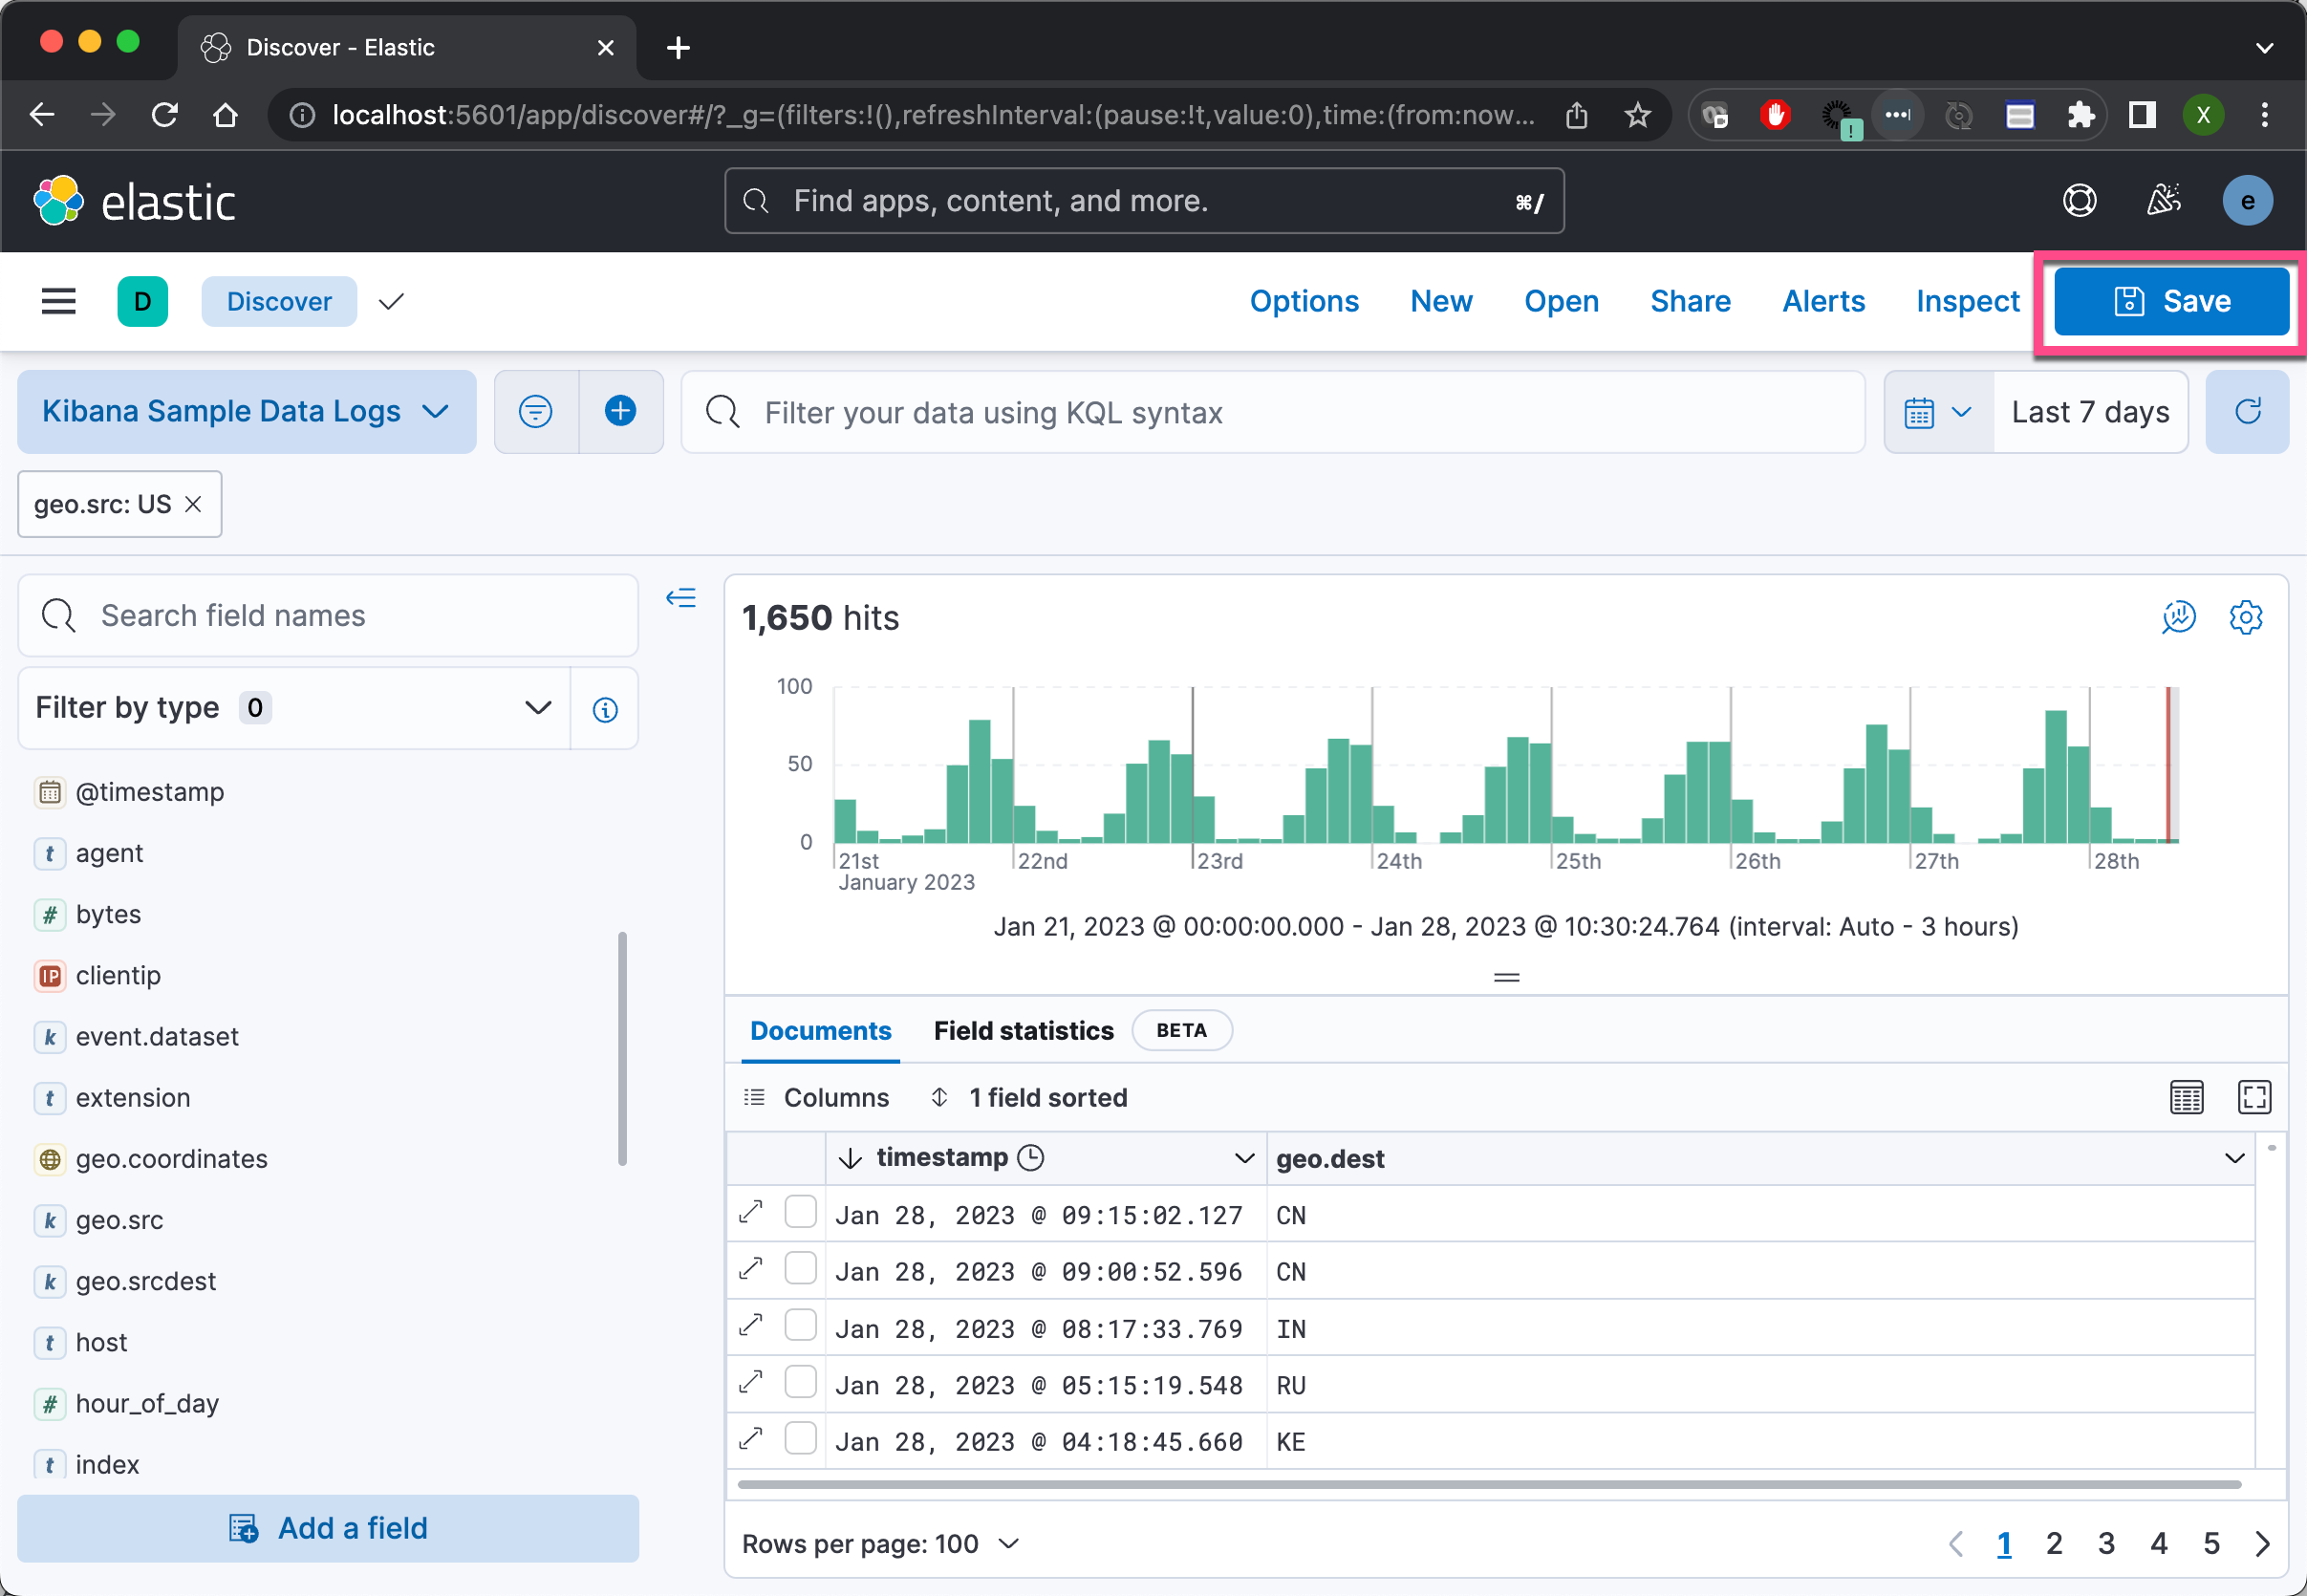
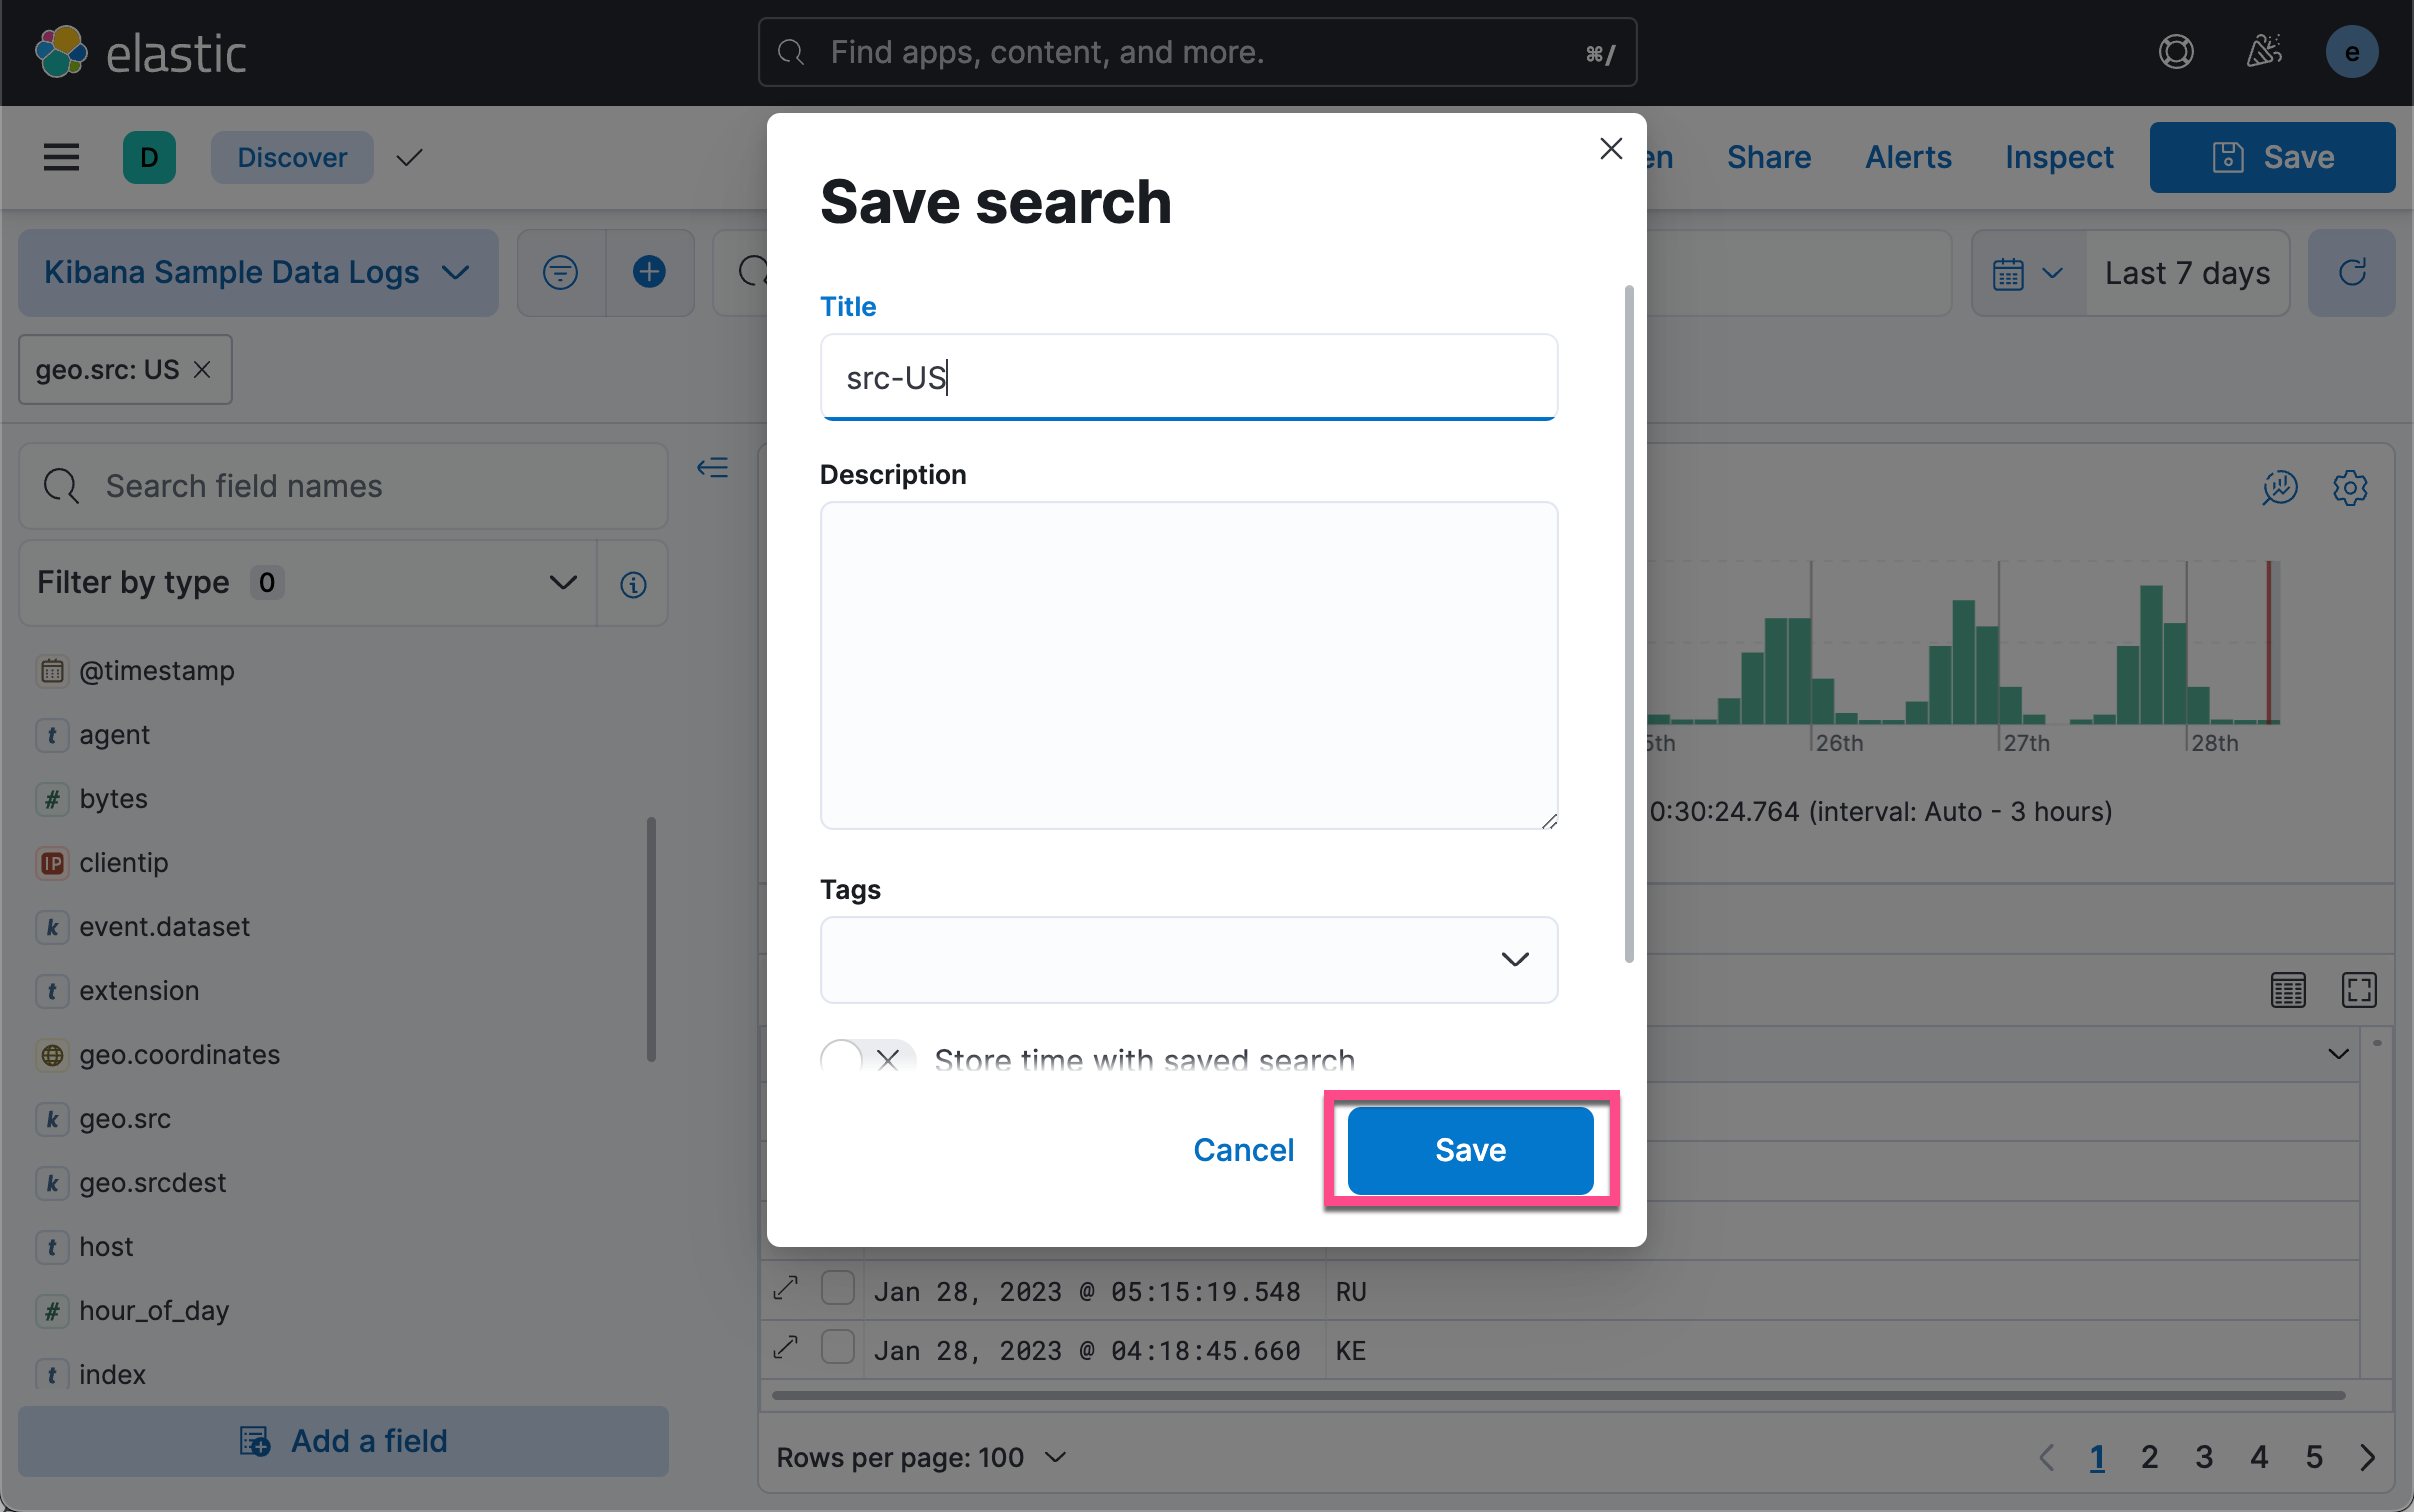
如上所示,我们仅做了一个很简单的表格。第一行是 timestamp,而第二行是 geo.dest。我们在搜索中创建了一个 geo.src 为 US 的过滤器。我们保存当前的搜索:
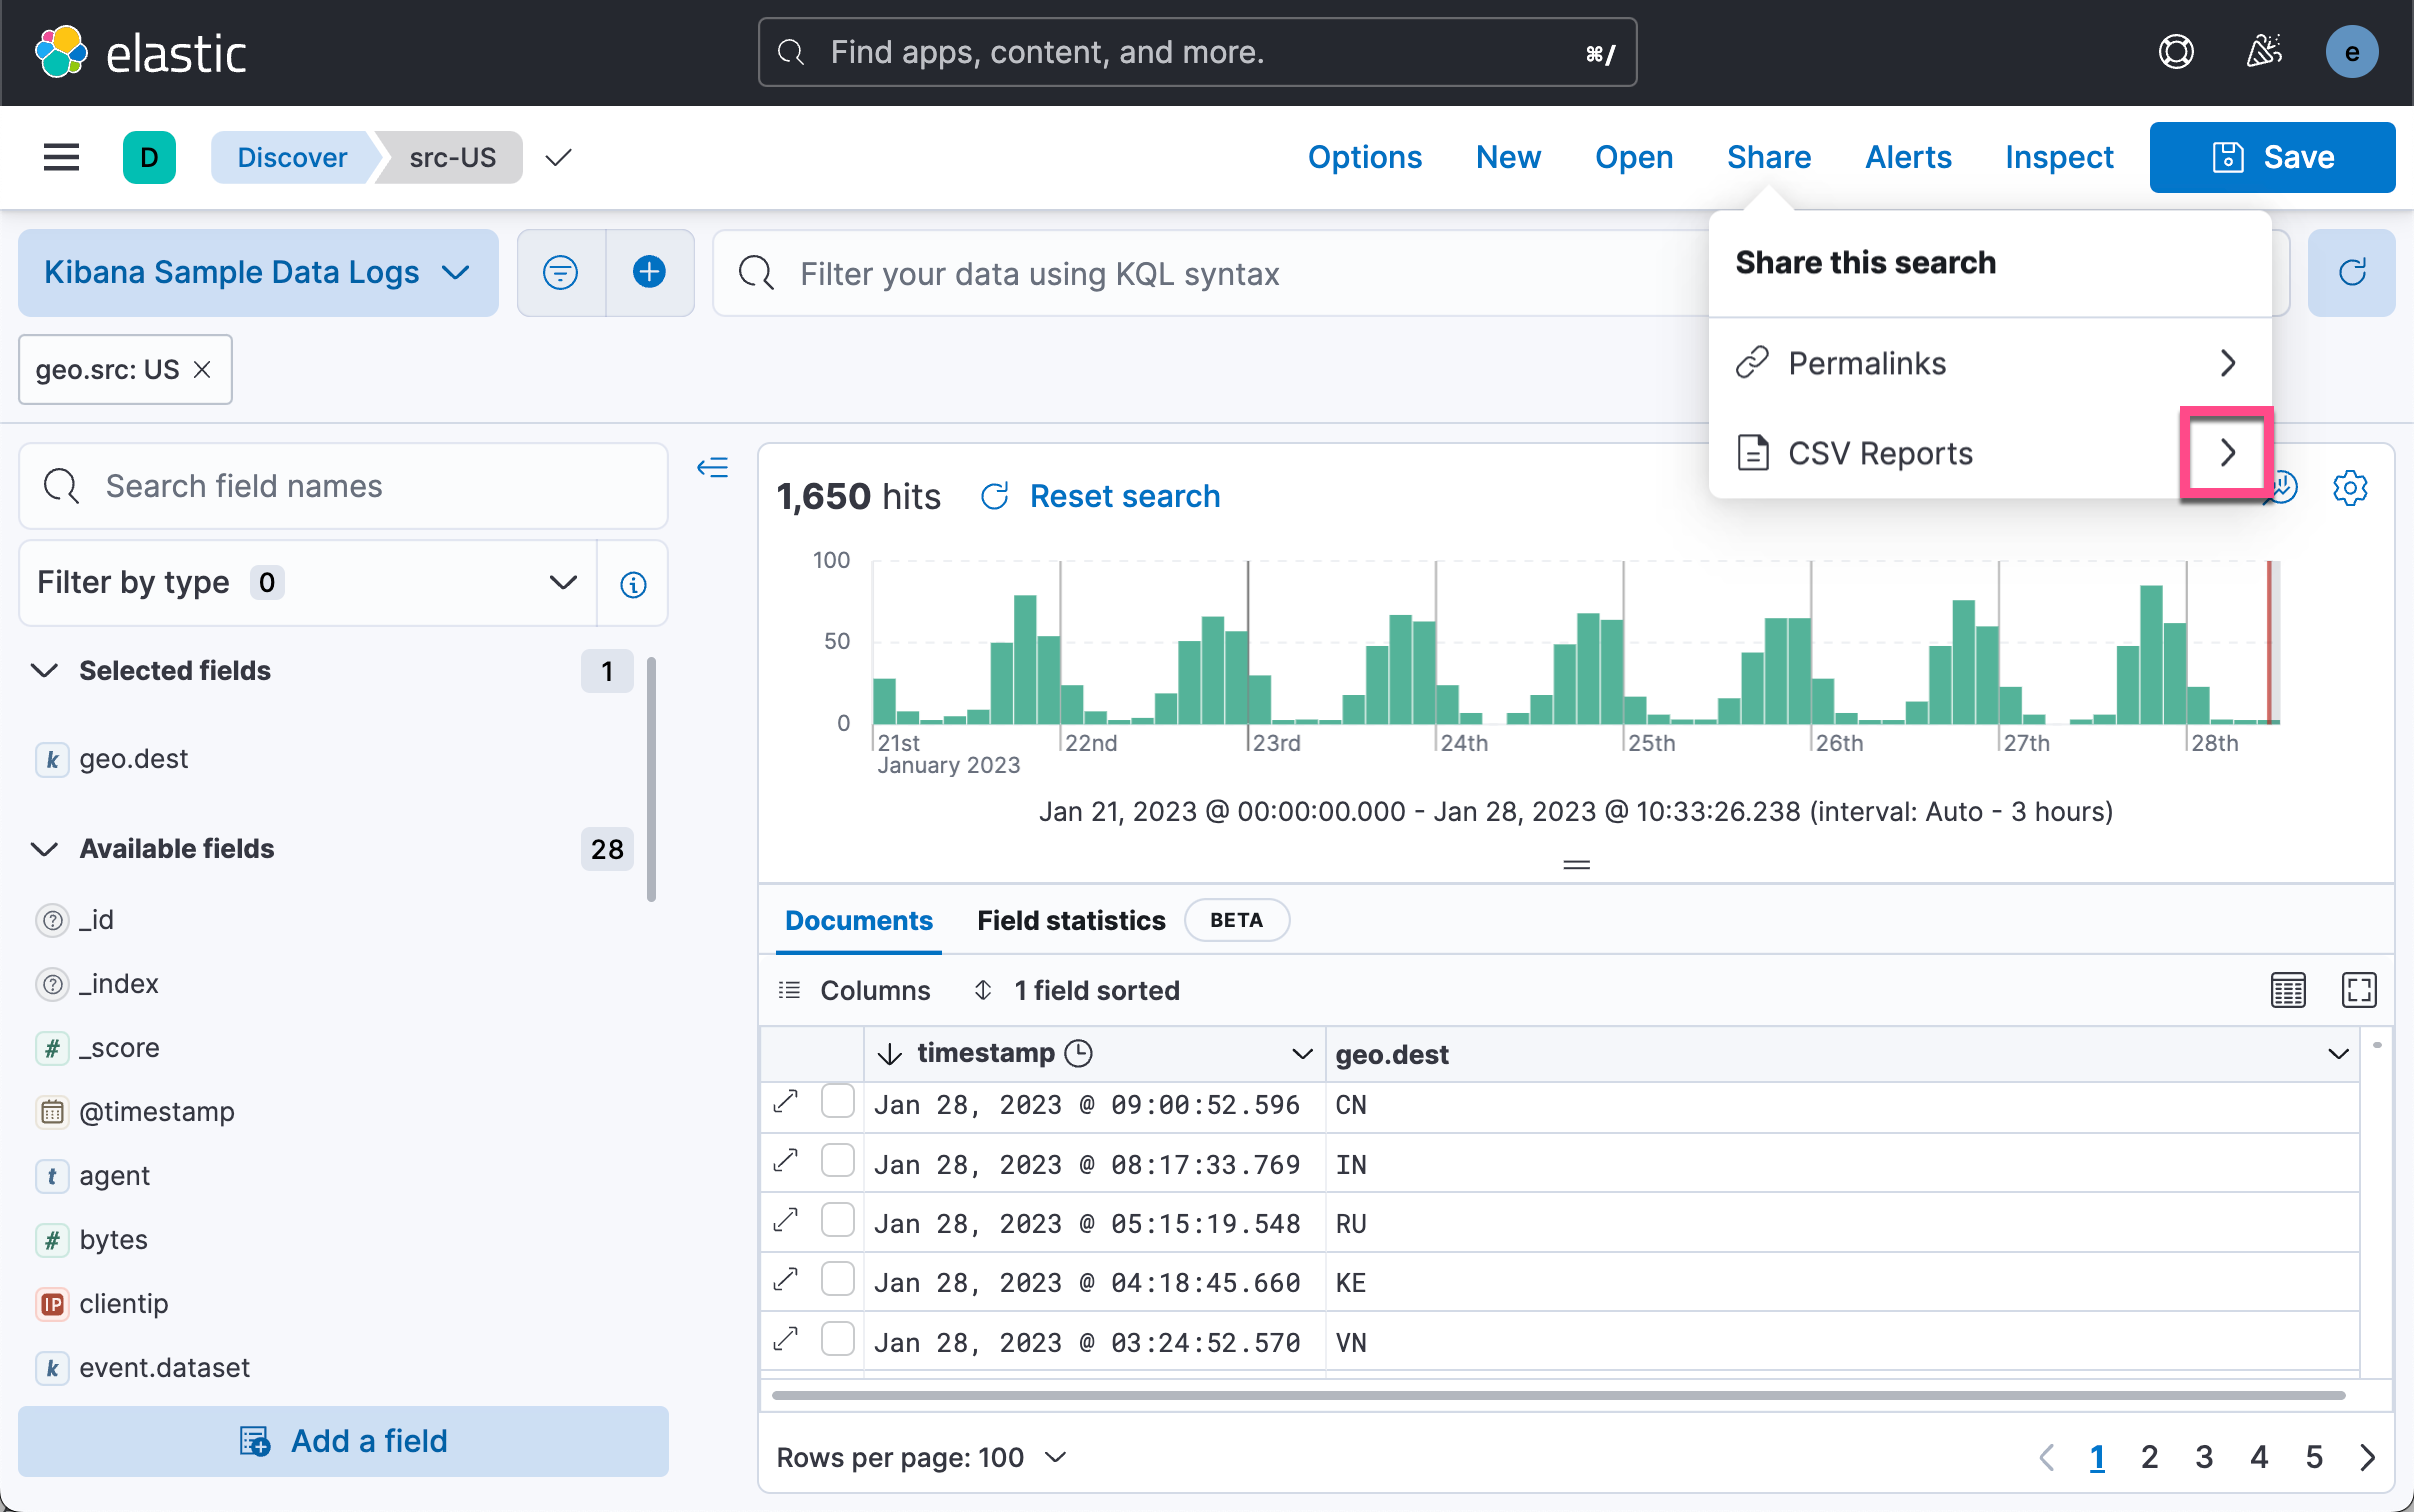
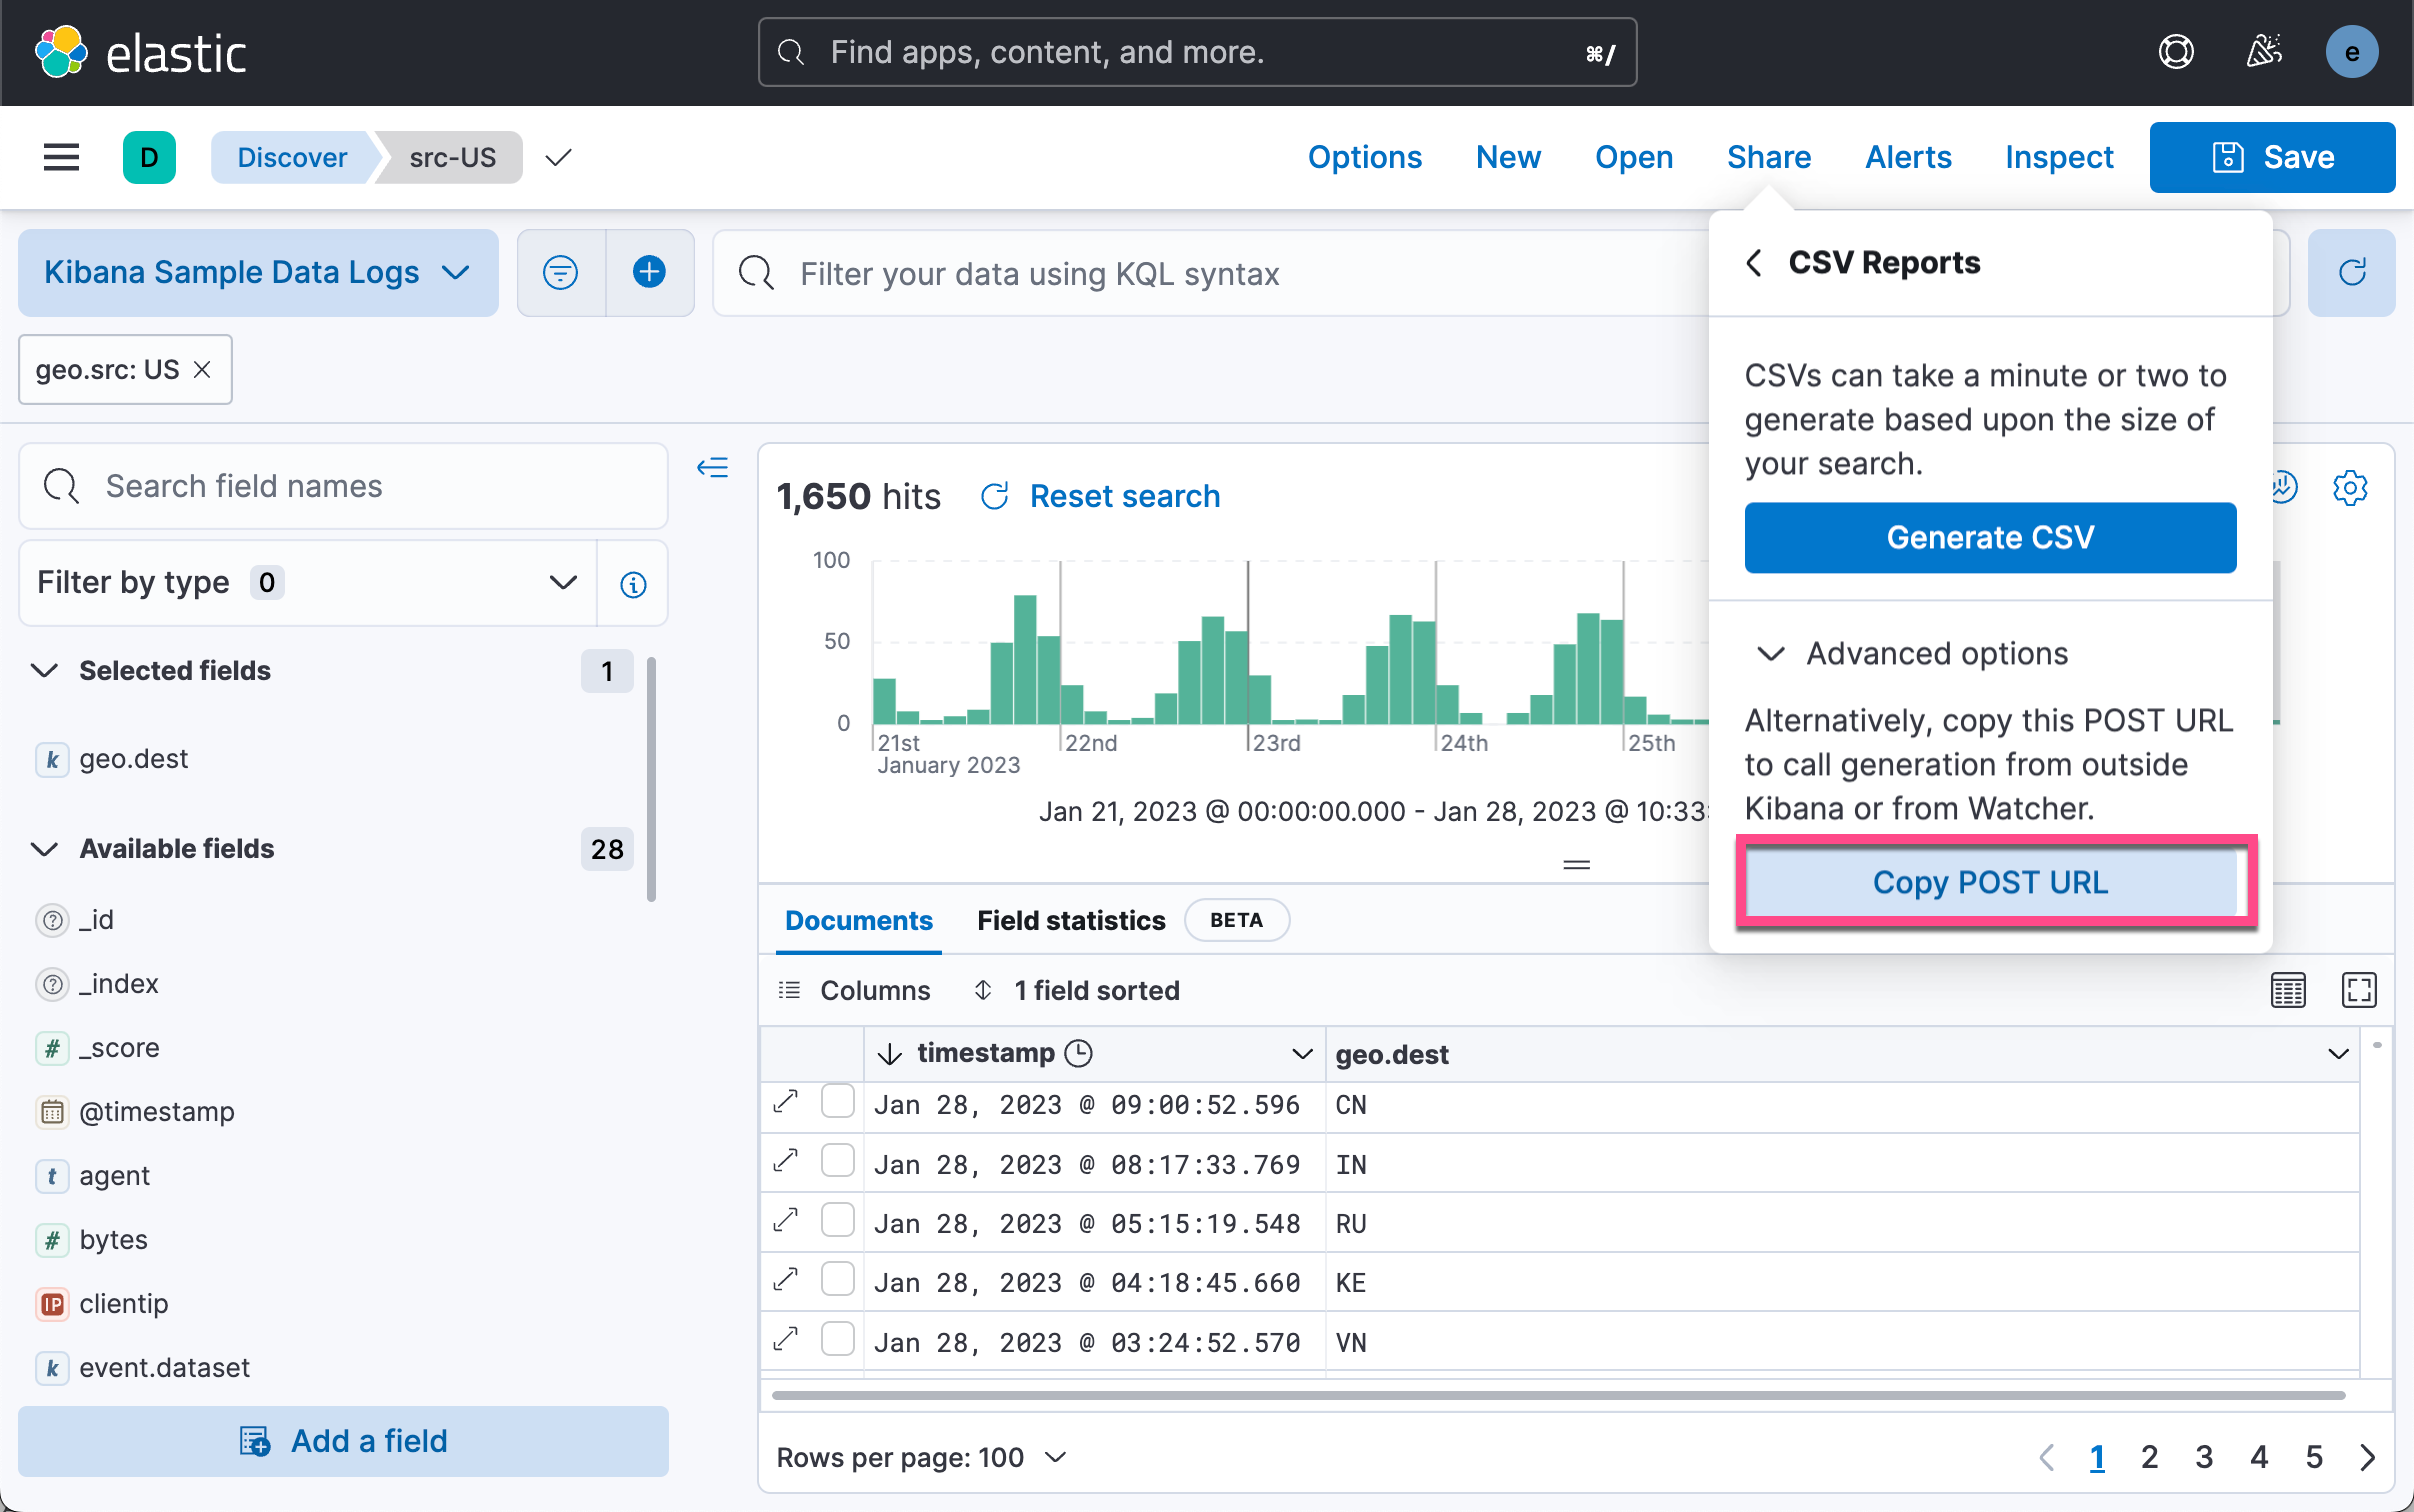
如上所示,我们有两种方法可以得到一个 CSV 格式的输出。一中是使用 Generate CSV 按钮。点击它后,我们可以在如下的地址下载相应的 CSV 文件。
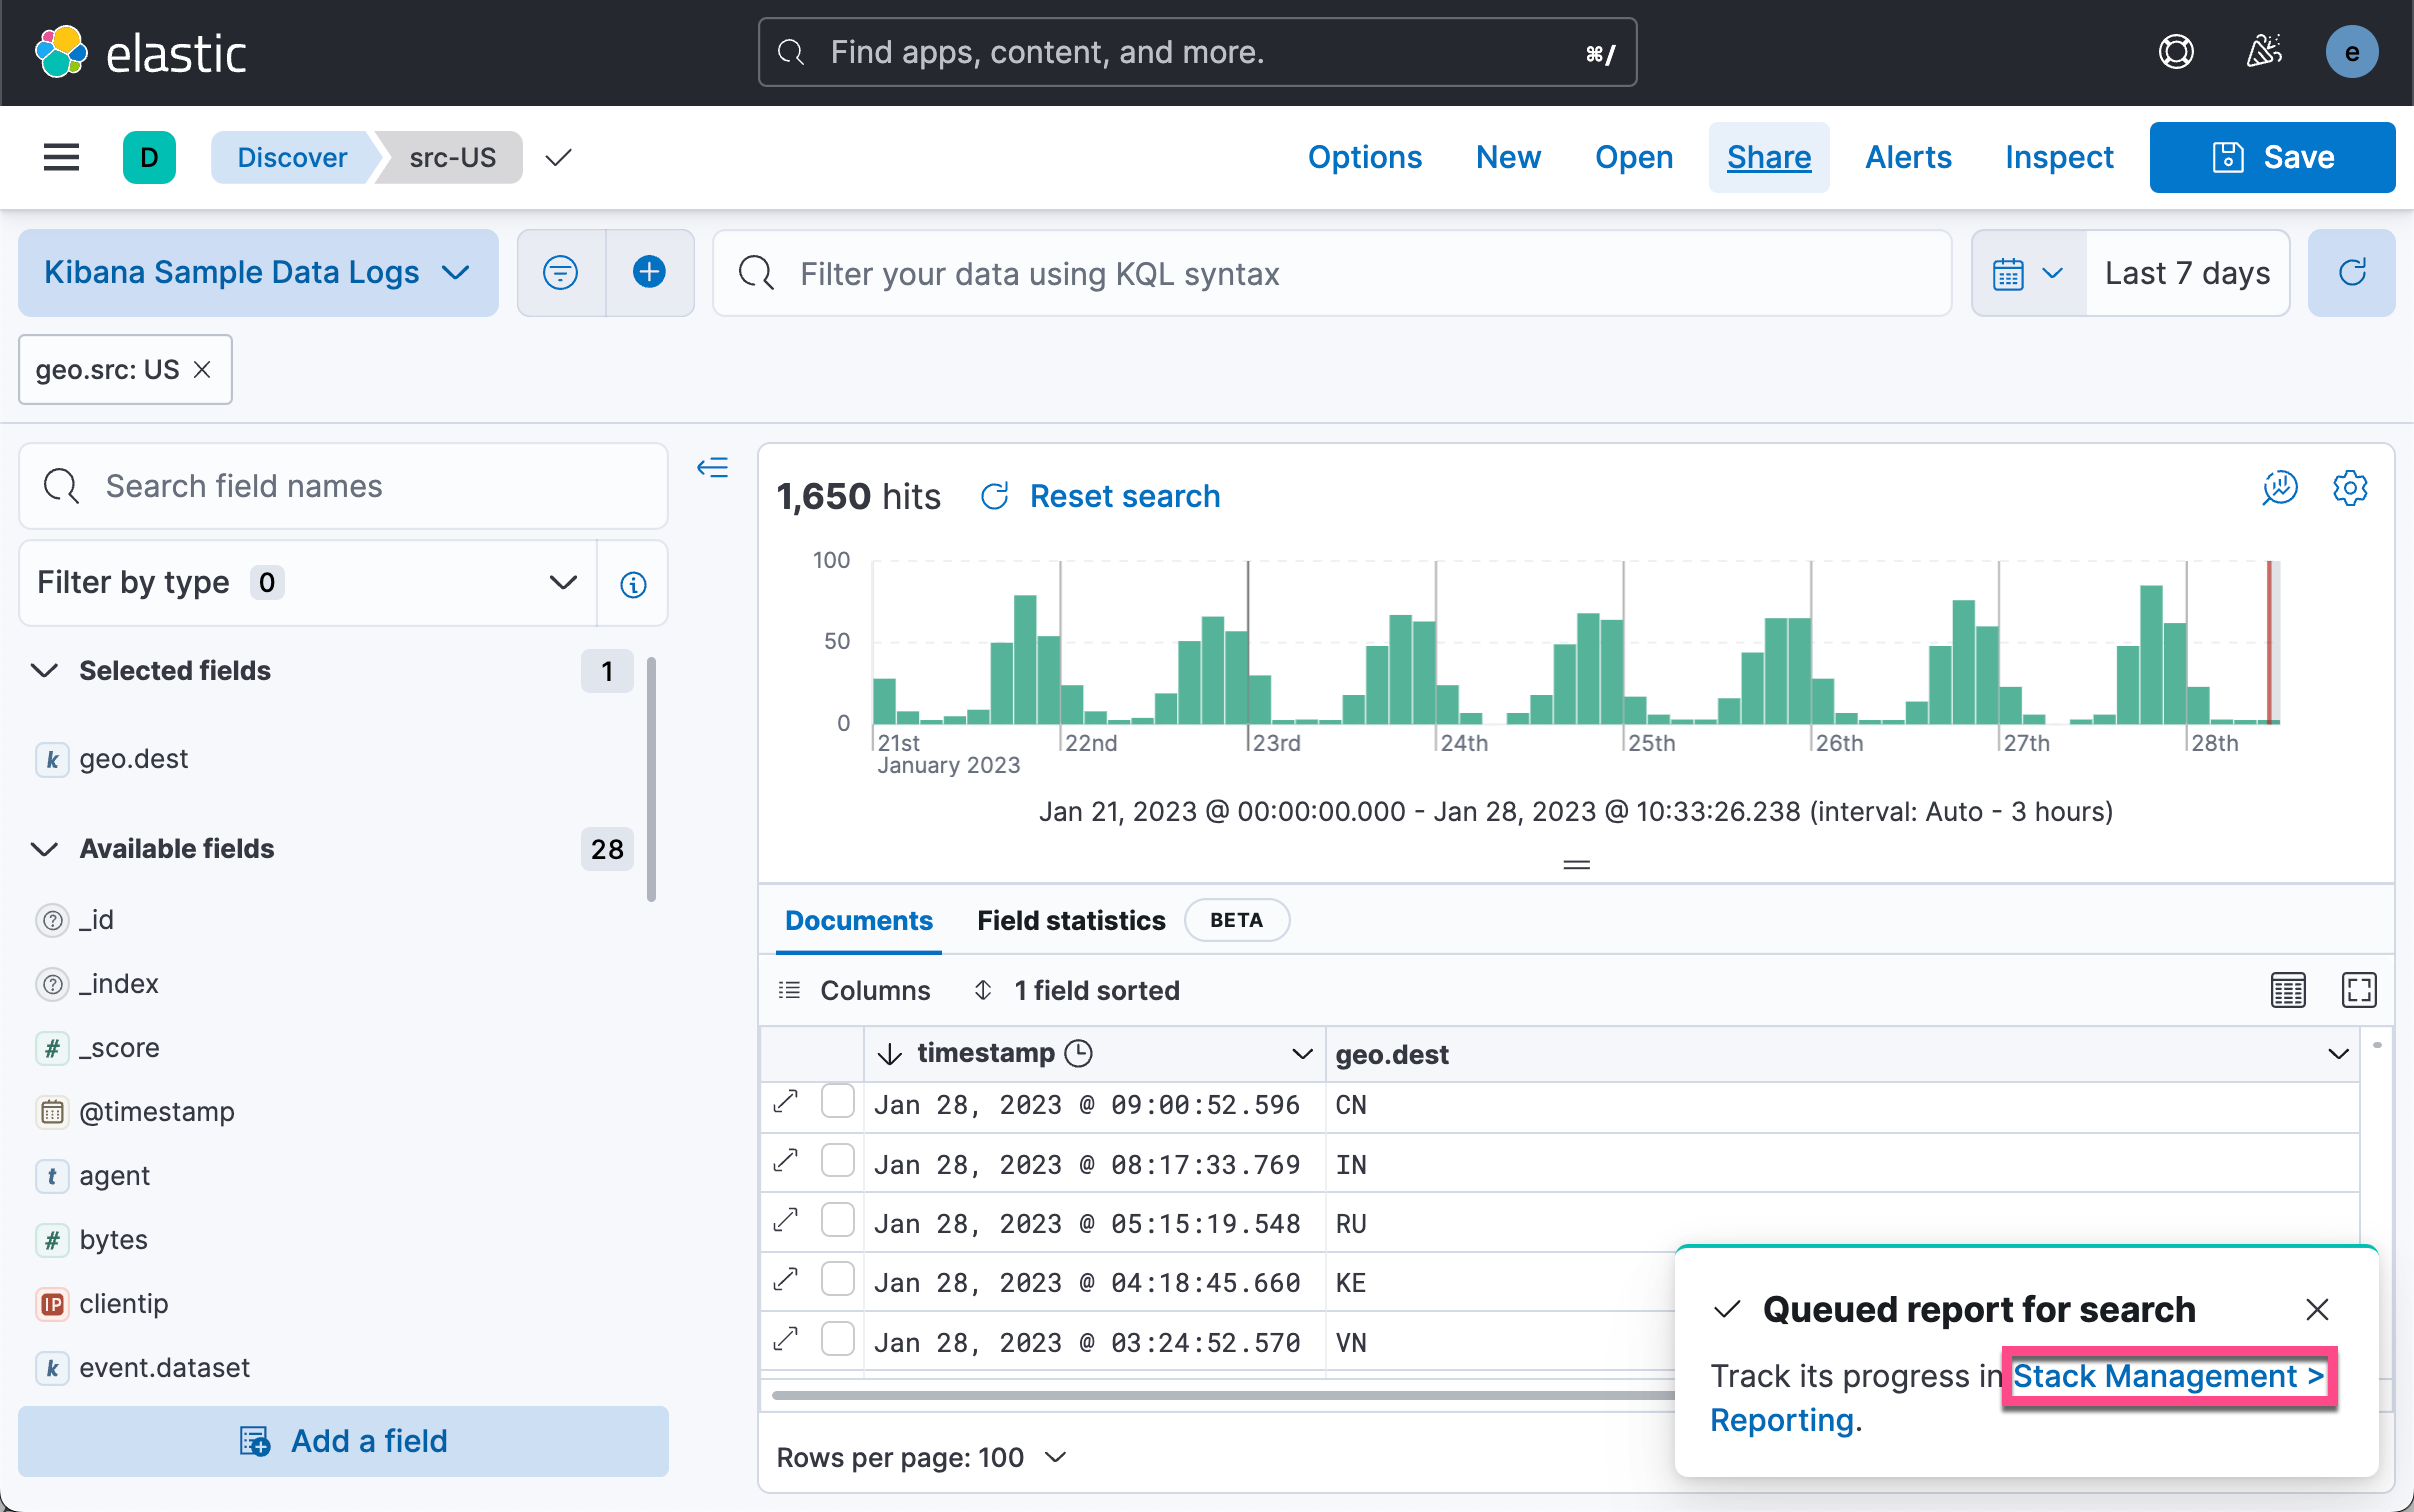
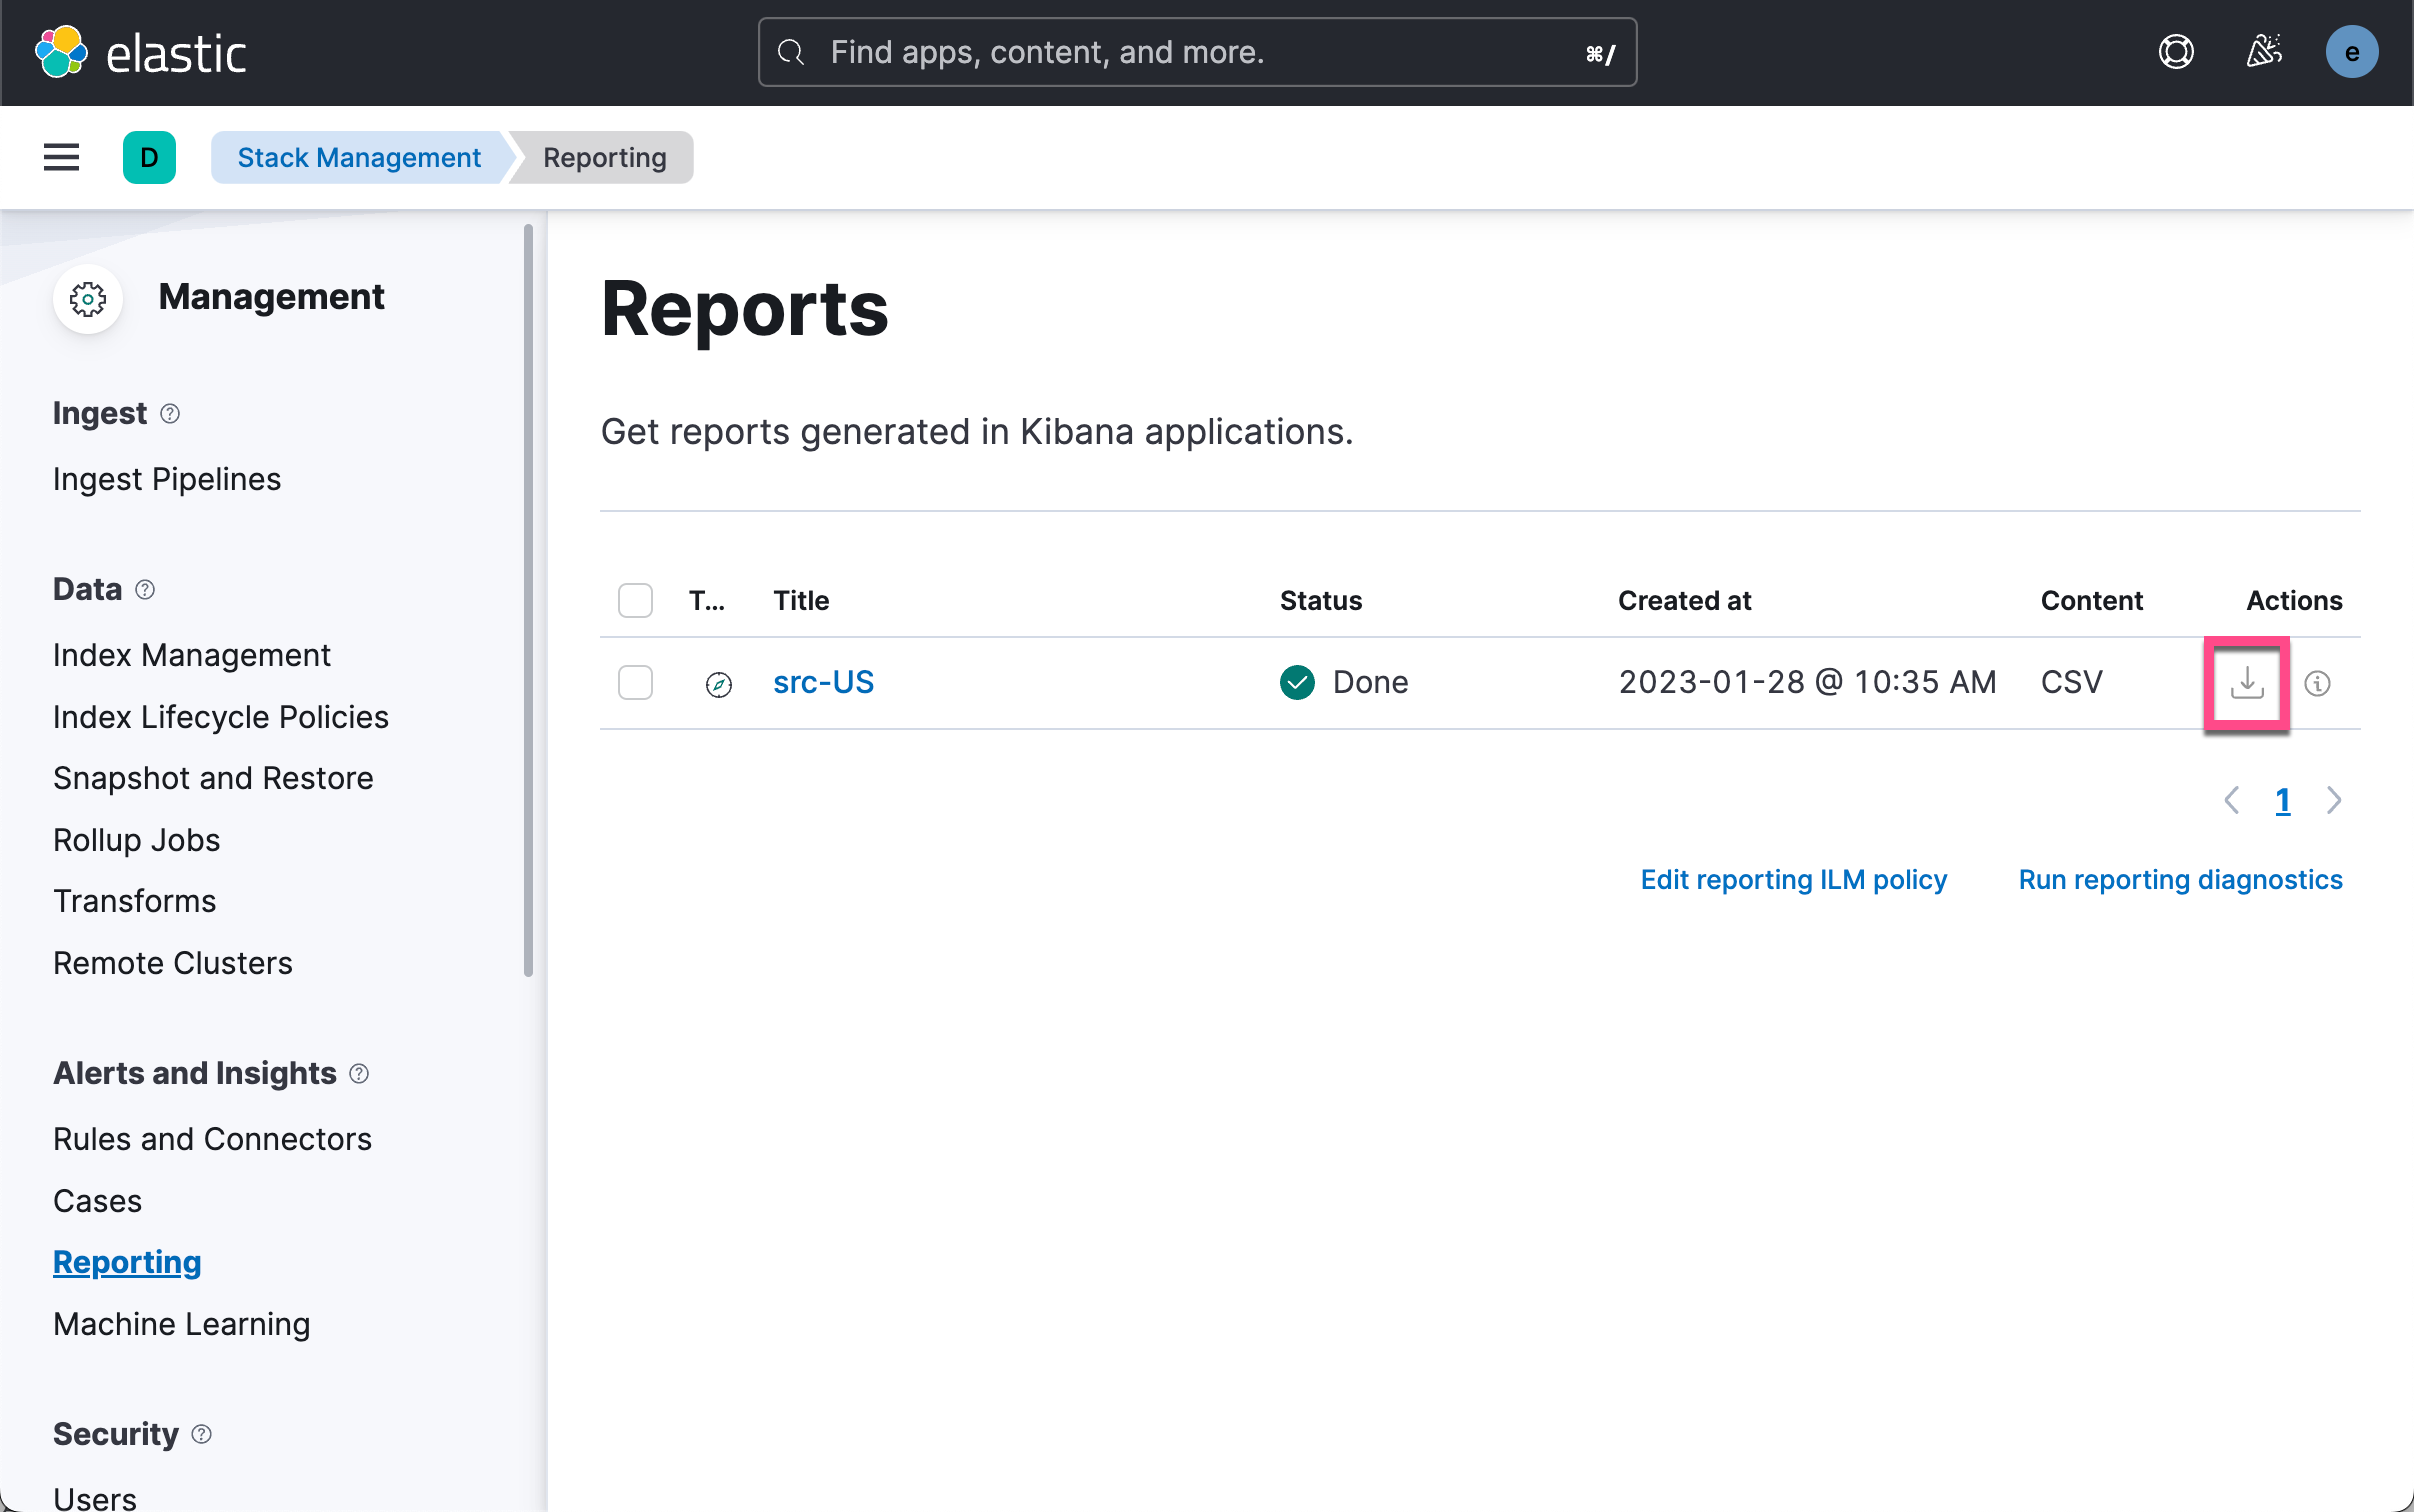
我们可以看到如上所示 CSV 输出。另外一种方式是使用 POST URL 来通过软件的方式来获得这个数据。我们在上面的图中选择 Copy POST URL。我们可以得到如下所示的一个链接:
http://localhost:5601/api/reporting/generate/csv_searchsource?jobParams=%28browserTimezone%3AAsia%2FShanghai%2Ccolumns%3A%21%28timestamp%2Cgeo.dest%29%2CobjectType%3Asearch%2CsearchSource%3A%28fields%3A%21%28%28field%3Atimestamp%2Cinclude_unmapped%3Atrue%29%2C%28field%3Ageo.dest%2Cinclude_unmapped%3Atrue%29%29%2Cfilter%3A%21%28%28meta%3A%28field%3Atimestamp%2Cindex%3A%2790943e30-9a47-11e8-b64d-95841ca0b247%27%2Cparams%3A%28%29%29%2Cquery%3A%28range%3A%28timestamp%3A%28format%3Astrict_date_optional_time%2Cgte%3Anow-7d%2Fd%2Clte%3Anow%29%29%29%29%29%2Cindex%3A%2790943e30-9a47-11e8-b64d-95841ca0b247%27%2Cparent%3A%28filter%3A%21%28%28%27%24state%27%3A%28store%3AappState%29%2Cmeta%3A%28alias%3A%21n%2Cdisabled%3A%21f%2Cindex%3A%2790943e30-9a47-11e8-b64d-95841ca0b247%27%2Ckey%3Ageo.src%2Cnegate%3A%21f%2Cparams%3A%28query%3AUS%29%2Ctype%3Aphrase%29%2Cquery%3A%28match_phrase%3A%28geo.src%3AUS%29%29%29%29%2Cindex%3A%2790943e30-9a47-11e8-b64d-95841ca0b247%27%2Cquery%3A%28language%3Akuery%2Cquery%3A%27%27%29%29%2Csort%3A%21%28%28timestamp%3Adesc%29%29%2CtrackTotalHits%3A%21t%29%2Ctitle%3Asrc-US%2Cversion%3A%278.5.3%27%29方法一:从 Kibana 中获取数据
我们把上面的链接复制并粘贴到如下的代码中:
kibana-to-pandas.py
import pandas as pd
import requests
from requests.auth import HTTPBasicAuth
from io import StringIO
import json
import time

kibana_ip = "0.0.0.0"

headers = {"kbn-xsrf": "reporting"}

#  post_url = 'http://' + kibana_ip + \
    # '/api/reporting/generate/csv?jobParams=(conflictedTypesFields:!(),fields:!(xxxxx))'

post_url = "http://localhost:5601/api/reporting/generate/csv_searchsource?jobParams=%28browserTimezone%3AAsia%2FShanghai%2Ccolumns%3A%21%28timestamp%2Cgeo.dest%29%2CobjectType%3Asearch%2CsearchSource%3A%28fields%3A%21%28%28field%3Atimestamp%2Cinclude_unmapped%3Atrue%29%2C%28field%3Ageo.dest%2Cinclude_unmapped%3Atrue%29%29%2Cfilter%3A%21%28%28meta%3A%28field%3Atimestamp%2Cindex%3A%2790943e30-9a47-11e8-b64d-95841ca0b247%27%2Cparams%3A%28%29%29%2Cquery%3A%28range%3A%28timestamp%3A%28format%3Astrict_date_optional_time%2Cgte%3Anow-7d%2Fd%2Clte%3Anow%29%29%29%29%29%2Cindex%3A%2790943e30-9a47-11e8-b64d-95841ca0b247%27%2Cparent%3A%28filter%3A%21%28%28%27%24state%27%3A%28store%3AappState%29%2Cmeta%3A%28alias%3A%21n%2Cdisabled%3A%21f%2Cindex%3A%2790943e30-9a47-11e8-b64d-95841ca0b247%27%2Ckey%3Ageo.src%2Cnegate%3A%21f%2Cparams%3A%28query%3AUS%29%2Ctype%3Aphrase%29%2Cquery%3A%28match_phrase%3A%28geo.src%3AUS%29%29%29%29%2Cindex%3A%2790943e30-9a47-11e8-b64d-95841ca0b247%27%2Cquery%3A%28language%3Akuery%2Cquery%3A%27%27%29%29%2Csort%3A%21%28%28timestamp%3Adesc%29%29%2CtrackTotalHits%3A%21t%29%2Ctitle%3Asrc-US%2Cversion%3A%278.5.3%27%29"

# print(post_url)

post_url_data = requests.post(post_url, \
    auth = HTTPBasicAuth('elastic', 'password'), \
        headers = headers)

get_api_json = json.loads(post_url_data.text)

print(get_api_json)

time.sleep(10)

print(get_api_json['path'])

api_url = "http://" + "localhost:5601" + get_api_json['path']
print(api_url)

csv_url = requests.get(api_url, \
    auth = HTTPBasicAuth('elastic', 'password'), \
        headers = headers)

print(csv_url)

traffic_data = pd.read_csv(StringIO(csv_url.text))

print(traffic_data.head())
print(traffic_data)
在上面的代码中,特别需要注意的是:
time.sleep(10)我们在发送完请求后,需要等待一定的时间让 Kibana 做相应的处理,并得到相应的数据。在上面,我使用了超级用户 elastic 的账号信息。运行上面的代码:
$ pwd
/Users/liuxg/python/pandas
$ ls
kibana-to-pandas.py
$ python kibana-to-pandas.py
{'path': '/api/reporting/jobs/download/ldfcx8kq1k9b9c2bfe5reij0', 'job': {'id': 'ldfcx8kq1k9b9c2bfe5reij0', 'index': '.reporting-2023-01-22', 'jobtype': 'csv_searchsource', 'created_at': '2023-01-28T02:51:55.178Z', 'created_by': 'elastic', 'meta': {'objectType': 'search'}, 'status': 'pending', 'attempts': 0, 'migration_version': '7.14.0', 'payload': {'browserTimezone': 'Asia/Shanghai', 'columns': ['timestamp', 'geo.dest'], 'objectType': 'search', 'searchSource': {'fields': [{'field': 'timestamp', 'include_unmapped': 'true'}, {'field': 'geo.dest', 'include_unmapped': 'true'}], 'filter': [{'meta': {'field': 'timestamp', 'index': '90943e30-9a47-11e8-b64d-95841ca0b247', 'params': {}}, 'query': {'range': {'timestamp': {'format': 'strict_date_optional_time', 'gte': 'now-7d/d', 'lte': 'now'}}}}], 'index': '90943e30-9a47-11e8-b64d-95841ca0b247', 'parent': {'filter': [{'$state': {'store': 'appState'}, 'meta': {'alias': None, 'disabled': False, 'index': '90943e30-9a47-11e8-b64d-95841ca0b247', 'key': 'geo.src', 'negate': False, 'params': {'query': 'US'}, 'type': 'phrase'}, 'query': {'match_phrase': {'geo.src': 'US'}}}], 'index': '90943e30-9a47-11e8-b64d-95841ca0b247', 'query': {'language': 'kuery', 'query': ''}}, 'sort': [{'timestamp': 'desc'}], 'trackTotalHits': True}, 'title': 'src-US', 'version': '8.5.3'}, 'output': {}}}
/api/reporting/jobs/download/ldfcx8kq1k9b9c2bfe5reij0
http://localhost:5601/api/reporting/jobs/download/ldfcx8kq1k9b9c2bfe5reij0
<Response [200]>
                     timestamp geo.dest
0  Jan 28, 2023 @ 09:15:02.127       CN
1  Jan 28, 2023 @ 09:00:52.596       CN
2  Jan 28, 2023 @ 08:17:33.769       IN
3  Jan 28, 2023 @ 05:15:19.548       RU
4  Jan 28, 2023 @ 04:18:45.660       KE
                        timestamp geo.dest
0     Jan 28, 2023 @ 09:15:02.127       CN
1     Jan 28, 2023 @ 09:00:52.596       CN
2     Jan 28, 2023 @ 08:17:33.769       IN
3     Jan 28, 2023 @ 05:15:19.548       RU
4     Jan 28, 2023 @ 04:18:45.660       KE
...                           ...      ...
1608  Jan 21, 2023 @ 11:30:30.110       TJ
1609  Jan 21, 2023 @ 11:14:28.231       IN
1610  Jan 21, 2023 @ 11:05:31.057       FR
1611  Jan 21, 2023 @ 10:40:26.055       TR
1612  Jan 21, 2023 @ 10:24:53.405       IN

[1613 rows x 2 columns]
从上面的输出中,我们可以看到 pandas 的 dataframe 输出。
请注意,它只能根据您在 kibana.yml 文件中指定的字节大小检索部分数据。 请增加 xpack.reporting.csv.maxSizeBytes 的值以获得完整数据。
方法二:从 Elasticsearch 中获取数据
下面的代码片段将有助于直接从 Elasticsearch 索引中检索数据,但它不足以检索大量数据,因此你可能需要根据你的情况决定使用 kibana 的 csv 报告还是 Elasticsearch 索引要求。
关于如何连接到 Elasticsearch,请参阅我之前的文章 “Elasticsearch:关于在 Python 中使用 Elasticsearch 你需要知道的一切 - 8.x”。我们创建如下的一个 python 文件:
elasticsearch-to-pandas.py
from elasticsearch import Elasticsearch
import pandas as pd
import numpy as np
import json

# create a client instance of the library

es = Elasticsearch("http://localhost:9200", basic_auth=("elastic", "password"))
resp = es.info()
# print(resp)

total_docs = 50

search_query = {
    "match_all": {}
}

response = es.search(
    _source="false",
    index='kibana_sample_data_logs',
    query=search_query,
    size=total_docs,
    fields=[
        "@timestamp",
        "clientip",
        "host"
    ]
)

# print(response)

elastic_docs = response["hits"]["hits"]
# print(elastic_docs)

fields = {}
for num, doc in enumerate(elastic_docs):
    fields_data = doc["fields"]
    for key, val in fields_data.items():
        try:
            fields[key] = np.append(fields[key], val)
        except KeyError:
            fields[key] = np.array([val])

# print(fields)
traffic_data = pd.DataFrame(fields)
print(traffic_data.info())
在上面我们做了如下的一个搜索:
GET kibana_sample_data_logs/_search
{
  "_source": false,
  "query": {
    "match_all": {}
  },
  "fields": [
    "@timestamp",
    "clientip",
    "host"
  ]
}
上面的查询返回如下的结果:
{
  "took": 0,
  "timed_out": false,
  "_shards": {
    "total": 1,
    "successful": 1,
    "skipped": 0,
    "failed": 0
  },
  "hits": {
    "total": {
      "value": 10000,
      "relation": "gte"
    },
    "max_score": 1,
    "hits": [
      {
        "_index": "kibana_sample_data_logs",
        "_id": "Gf8y9oUBLUWnAhRe7p8u",
        "_score": 1,
        "fields": {
          "@timestamp": [
            "2023-01-15T00:39:02.912Z"
          ],
          "clientip": [
            "223.87.60.27"
          ],
          "host": [
            "artifacts.elastic.co"
          ]
        }
      },
      {
        "_index": "kibana_sample_data_logs",
        "_id": "Gv8y9oUBLUWnAhRe7p8u",
        "_score": 1,
        "fields": {
          "@timestamp": [
            "2023-01-15T03:26:21.326Z"
          ],
          "clientip": [
            "130.246.123.197"
          ],
          "host": [
            "www.elastic.co"
          ]
        }
      },
      {
        "_index": "kibana_sample_data_logs",
        "_id": "G_8y9oUBLUWnAhRe7p8u",
        "_score": 1,
        "fields": {
          "@timestamp": [
            "2023-01-15T03:30:25.131Z"
          ],
          "clientip": [
            "120.49.143.213"
          ],
          "host": [
            "cdn.elastic-elastic-elastic.org"
          ]
        }
      },
      {
        "_index": "kibana_sample_data_logs",
        "_id": "HP8y9oUBLUWnAhRe7p8u",
        "_score": 1,
        "fields": {
          "@timestamp": [
            "2023-01-15T03:34:43.399Z"
          ],
          "clientip": [
            "99.74.118.237"
          ],
          "host": [
            "artifacts.elastic.co"
          ]
        }
      },
      {
        "_index": "kibana_sample_data_logs",
        "_id": "Hf8y9oUBLUWnAhRe7p8u",
        "_score": 1,
        "fields": {
          "@timestamp": [
            "2023-01-15T03:37:04.863Z"
          ],
          "clientip": [
            "177.111.217.54"
          ],
          "host": [
            "www.elastic.co"
          ]
        }
      },
      {
        "_index": "kibana_sample_data_logs",
        "_id": "Hv8y9oUBLUWnAhRe7p8u",
        "_score": 1,
        "fields": {
          "@timestamp": [
            "2023-01-15T03:49:40.669Z"
          ],
          "clientip": [
            "106.225.58.146"
          ],
          "host": [
            "www.elastic.co"
          ]
        }
      }
   ...
运行上面的代码,我们可以得到如下的数据:
$ pwd
/Users/liuxg/python/pandas
$ ls
elasticsearch-to-pandas.py kibana-to-pandas.py
$ python elasticsearch-to-pandas.py
<class 'pandas.core.frame.DataFrame'>
RangeIndex: 50 entries, 0 to 49
Data columns (total 3 columns):
 #   Column      Non-Null Count  Dtype
---  ------      --------------  -----
 0   @timestamp  50 non-null     object
 1   clientip    50 non-null     object
 2   host        50 non-null     object
dtypes: object(3)
memory usage: 1.3+ KB
None


 1444
1444

 被折叠的 条评论
为什么被折叠?
被折叠的 条评论
为什么被折叠?
 到【灌水乐园】发言


