


假设要给柱状图的每个柱子设置一个单独的警示线,我们首先很容易就会想到配置项(markline)
那么第一种方案就出来了,代码如下:
option = {
  xAxis: {
    type: 'category',
    data: ['Mon', 'Tue', 'Wed', 'Thu', 'Fri', 'Sat', 'Sun']
  },
  yAxis: {
    type: 'value',
    max: 400,
  	axisLine: {
			   show: true,
			   symbol:['none', 'arrow'],    //加箭头处
			   symbolOffset: 50,            //使箭头偏移
			   lineStyle: {
					color: "black",         //设置y轴的颜色
					shadowOffsetY:-50,      //利用阴影进行反向延长
					shadowColor: 'black',   //设置阴影的颜色
				},
			},
  },
  series: [
    {
      data: [120, 200, 150, 80, 70, 110, 130],
      type: 'bar',
      showBackground: true,
      backgroundStyle: {
        color: 'rgba(180, 180, 180, 0.2)'
      },
      markLine:{
  		  symbol: 'none',
  		  name: 'xx',
  		  data:
  		  [
  		    [//第一条警戒线
  		      {
    		      name:'起点',
    		      xAxis:'Mon',
    		      yAxis:300,
    		      x: 60,  //设置警戒线的起点偏移量
    		      lineStyle: {type: 'dashed',color: 'red'},
    		      label:{show:true, position:'middle'},
  		      },
  		      {
    		      name: '终点',
    		      position:'middle',
    		      xAxis:'Wed',
    		      yAxis:300,
      		    x: 340,   //设置警戒线的终点偏移量
      		    lineStyle: {type: 'dashed',color: 'red'},
      		    label:{show:true, position:'end',},
  		      }
    		],
  		    [ //第二条警戒线
  		      {
    		      xAxis:'Thu',
    		      yAxis:350,
    		      lineStyle: {type: 'dashed',color: 'red',},
    		      label:{show:true, position: 'insideEndBottom'},
    		      //如果起点label的show为false则终点设不设都无所谓
    		      //label的位置以起点为准
  		      },
  		      {
    		      name: '终点',
    		      //警戒线的name以起点设置为准,如果起点没有设置,看终点
    		      position:'middle',
    		      xAxis:'Sat',
    		      yAxis:350,
      		      lineStyle: {type: 'dashed',color: 'red'},
      		      label:{show:true, position: 'insideStartTop',},
  		      }
  		    ],
		   ],
    },//markline配置结束
  },
  ]
};
其中为了让每条警示线展示在每个柱子上,可以为每个警示线的x设置偏移量,效果图如下:

但是警戒线的偏移量应该设置多少,那就很难控制了,经过研究官网的自定义系列中的Cycle Plot例子,我们可以用自定义中custom图表进行绘制警戒线,代码如下:
option = {
  xAxis: {
    type: 'category',
    data: ['Mon', 'Tue', 'Wed', 'Thu', 'Fri', 'Sat', 'Sun']
  },
  yAxis: {
    type: 'value',
    max: 400,
  	axisLine: {
			   show: true,
			   symbol:['none', 'arrow'],    //加箭头处
			   symbolOffset: 50,            //使箭头偏移
			   lineStyle: {
					color: "black",         //设置y轴的颜色
					shadowOffsetY:-50,      //利用阴影进行反向延长
					shadowColor: 'black',   //设置阴影的颜色
				},
			},
  },
  series: [
    {
      data: [120, 200, 150, 80, 70, 110, 130],
      type: 'bar',
      showBackground: true,
      backgroundStyle: {
        color: 'rgba(180, 180, 180, 0.2)'
      },

  },
  {
      type: 'custom',
      //name: 'Trend by year (2002 - 2012)',
      itemStyle:{
        borderType:'dashed',   //可以控制警示线的样式
        color:'red',
      },
      renderItem: renderItem,
      encode: {
        x: 0,
        y: 1,
      },
      data: [300,350,200, 200, 200,150,120]    //警示线的数值
    }
  ]
};

function renderItem(param, api) {
  var bandWidth = api.size([0, 0])[0] ;
  var point = api.coord([api.value(0), api.value(1)]);
  return {
    type: 'line',
    transition: ['shape'],
    shape: {
      x1: point[0] - bandWidth / 2,
      x2: point[0] + bandWidth / 2,
      y1: point[1],
      y2: point[1]
    },
    style: api.style({
      fill: null,
      stroke: api.visual('color'),
      lineWidth: 1
    })
  };
}
效果如下:
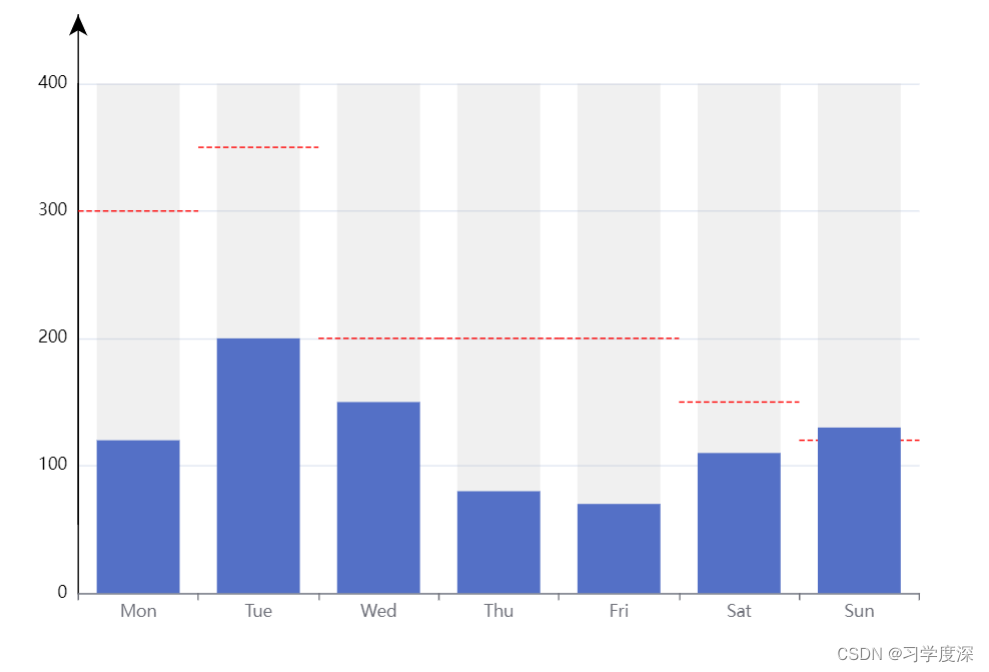
这样警示线可以完美覆盖柱状图的每个柱子。
关于横轴柱状图的设置,可以参考如下代码:
const labelRight = {
  position: 'right'
};
option = {
  title: {
    text: 'Bar Chart with Negative Value'
  },
  tooltip: {
    trigger: 'axis',
    axisPointer: {
      type: 'shadow'
    }
  },
  grid: {
    top: 80,
    bottom: 30
  },
  xAxis: {
    type: 'value',
    position: 'top',
    splitLine: {
      lineStyle: {
        type: 'dashed'
      }
    }
  },
  yAxis: {
    type: 'category',
    axisLine: { show: false },
    axisLabel: { show: false },
    axisTick: { show: false },
    splitLine: { show: false },
    data: [
      'ten',
      'nine',
      'eight',
      'seven',
      'six',
      'five',
      'four',
      'three',
      'two',
      'one'
    ]
  },
  series: [
    {
      name: 'Cost',
      type: 'bar',
      stack: 'Total',
      label: {
        show: true,
        formatter: '{b}'
      },
      data: [
        { value: -0.07, label: labelRight },
        { value: -0.09, label: labelRight },
        0.2,
        0.44,
        { value: -0.23, label: labelRight },
        0.08,
        { value: -0.17, label: labelRight },
        0.47,
        { value: -0.36, label: labelRight },
        0.18
      ]
    },
    {
      type: 'custom',
      //name: 'Trend by year (2002 - 2012)',
      itemStyle:{
        borderType:'dashed',   //可以控制警示线的样式
        color:'red',
      },
      renderItem: renderItem,
      encode: {
        x: 0,
        y: 1,
      },
      data: [-0.2,-0.4,0.2, 0.5, 0.4,0.5,0.2]//设置7个警示线的数值
    }
  ]
};

function renderItem(param, api) {
  var bandWidth = api.size([0, 0])[1] ;
  //console.log(api.value(1)); //打印索引0,1,2,3,4,5,6
  //console.log(api.value(0)); //打印警戒线的值-0.2,-0.4,0.2, 0.5, 0.4,0.5,0.2
  var point = api.coord([api.value(0), api.value(1)]);
  // 横轴为警戒线,纵轴为索引,例如[-0.5, 0]
  return {
    type: 'line',
    transition: ['shape'],
    shape: {
      x1: point[0],
      x2: point[0],
      y1: point[1] - bandWidth / 2,
      y2: point[1] + bandWidth / 2
    },
    style: api.style({
      fill: null,
      stroke: api.visual('color'),
      lineWidth: 1
    })
  };
};
运行结果如下:


 4万+
4万+


 被折叠的 条评论
为什么被折叠?
被折叠的 条评论
为什么被折叠?
 到【灌水乐园】发言


