


python matplotlib库实现绘制一张图内两个纵坐标,并解决legend标签显示在图外的问题
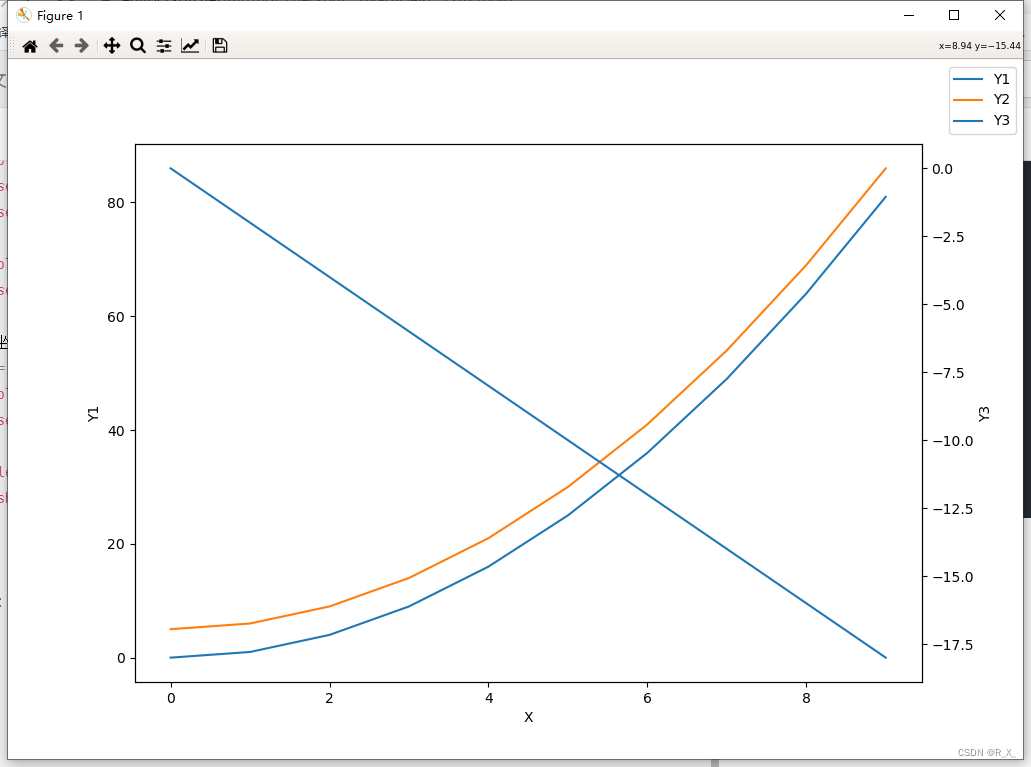
效果:
代码如下:
import matplotlib.pyplot as plt

# X横坐标
X=[i for i in range(10)]
# Y1 左纵坐标下的线1
Y1=[i**2 for i in range(10)]
# Y2 左纵坐标下的线2
Y2=[i**2+5 for i in range(10)]
# Y3 右纵坐标下的线1
Y3=[-i*2 for i in range(10)]

fig, ax1 = plt.subplots()

# 纵坐标一
ax1.plot(X, Y1)
ax1.set_xlabel("X")
ax1.set_ylabel("Y1")

ax1.plot(X, Y2)
ax1.set_xlabel("X")

# 纵坐标二
ax2 = ax1.twinx()
ax2.plot(X, Y3)
ax2.set_ylabel("Y3")

fig.legend(["Y1", "Y2", "Y3"])
plt.show()
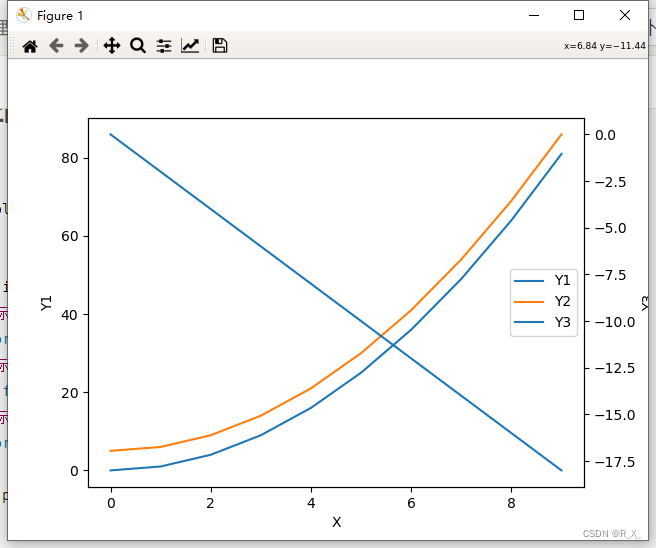
但是上图中标签显示在了图外,下面是移到图内的代码
import matplotlib.pyplot as plt

# X横坐标
X=[i for i in range(10)]
# Y1 左纵坐标下的线1
Y1=[i**2 for i in range(10)]
# Y2 左纵坐标下的线2
Y2=[i**2+5 for i in range(10)]
# Y3 右纵坐标下的线1
Y3=[-i*2 for i in range(10)]

fig, ax1 = plt.subplots()

# 纵坐标一
ax1.plot(X, Y1,label="Y1")
ax1.set_xlabel("X")
ax1.set_ylabel("Y1")

ax1.plot(X, Y2,label="Y2")
ax1.set_xlabel("X")

# 纵坐标二
ax2 = ax1.twinx()
ax2.plot(X, Y3,label="Y3")
ax2.set_ylabel("Y3")

handles1, labels1 = ax1.get_legend_handles_labels()
handles2, labels2 = ax2.get_legend_handles_labels()
plt.legend(handles1+handles2, labels1+labels2, loc='right')

plt.show()


 1万+
1万+


 被折叠的 条评论
为什么被折叠?
被折叠的 条评论
为什么被折叠?
 到【灌水乐园】发言


