


效果图如下

其他效果:
效果1:https://blog.csdn.net/weixin_41192581/article/details/104840199
效果2:https://www.cnblogs.com/myprogramer/p/12509764.html
渐变色详解:https://zhuanlan.zhihu.com/p/183893861
注意:
(1)最内层背景色、白色内框、进度条、外框,都是在 series 里设置 type为pie 的canvas
(2)最内层背景色 和 背景色上的文字用 z: 2 和 zlevel: 100 提升层级
文字在graphic中设置
(3)阻止鼠标悬浮时区域弹出
hoverAnimation: false, //鼠标悬浮是否有区域弹出动画,false:无 true:有
avoidLabelOverlap: false,
(4)取消鼠标高亮效果
方法一:silent: true, //取消鼠标移入高亮效果: 不响应和触发鼠标事件
silent: true, //取消鼠标移入高亮效果: 不响应和触发鼠标事件
方法二:将hover时的颜色与正常颜色设置为相同
data: [
  {
    value: 100,
    itemStyle: {
      normal: {
        color: '#f5f5f5',
      },
      emphasis: { color: '#f5f5f5' }, // 取消鼠标移入高亮效果: 将hover时的颜色设置为相同
    },
  },
],
(5)设置进度条圆角
borderRadius: ['20%', '50%'], //进度条圆角: 当饼图为环形图时,内圆角半径是内圆半径的 20%、外圆角半径是外圆半径的 50%
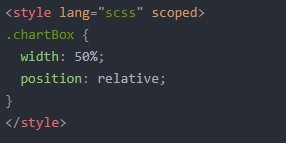
(6)调整环形图在页面上距离页面左侧的距离:
设置 .chartBox
完整实现:
<template>
  <div class="chartBox">
    <div id="treeChart" :style="{ height: '242px' }"></div>
  </div>
</template>

<script>
export default {
  name: 'eCharts',
  data() {
    return {
      value: 60,
    }
  },
  mounted() {
    this.showChart()
  },
  methods: {
    showChart() {
      // 基于准备好的dom,初始化echarts实例
      var myChart = this.$echarts.init(document.getElementById('treeChart'))

      var value = 200 //当前进度
      var maxValue = 300 //进度条最大值
      var option = {
        legend: {
          orient: 'vertical',
          x: 'left',
        },
        graphic: [
          //第一行文字
          //内容 + 位置
          {
            type: 'text',
            left: 'center',
            top: '30%',
            z: 2,
            zlevel: 100,
            style: {
              text: '全省故障XX',
              textAlign: 'center',
              fill: '#333333',
              fontSize: 12,
            },
          },
          {
            type: 'text',
            left: 'center',
            top: '36.5%',
            z: 2,
            zlevel: 100,
            style: {
              text: '解决率',
              textAlign: 'center',
              fill: '#333333',
              fontSize: 12,
            },
          },
          {
            type: 'text',
            left: 'center',
            top: '45%',
            z: 2,
            zlevel: 100,
            style: {
              text: '67%',
              textAlign: 'center',
              fontWeight: 'bold',
              fill: '#5393E7',
              fontSize: 22,
            },
          },
          {
            type: 'text',
            left: 'center',
            top: '58%',
            z: 2,
            zlevel: 100,
            style: {
              text: '200 / 300',
              textAlign: 'center',
              fill: '#333333',
              fontSize: 14,
            },
          },
          {
            type: 'text',
            left: 'center',
            top: '65.5%',
            z: 2,
            zlevel: 100,
            style: {
              text: '已解决 / 总数',
              textAlign: 'center',
              fill: '#333333',
              fontSize: 12,
            },
          },
        ],

        series: [
          // 最内层背景色
          {
            type: 'pie',
            radius: [0, '60%'],
            hoverAnimation: false, //取消鼠标悬浮放大的效果
            labelLine: {
              normal: {
                show: false,
              },
            },
            animation: false,
            data: [
              {
                value: 100,
                itemStyle: {
                  normal: {
                    color: '#f5f5f5',
                  },
                  emphasis: { color: '#f5f5f5' }, // 取消鼠标移入高亮效果: 将hover时的颜色设置为相同
                },
              },
            ],
          },
          // 内边框
          {
            type: 'pie',
            radius: ['60%', '61%'],
            labelLine: {
              normal: {
                show: false,
              },
            },
            hoverAnimation: false, //鼠标悬浮是否有区域弹出动画,false:无 true:有
            avoidLabelOverlap: false,
            animationEasing: 'cubicOut',
            data: [
              {
                value: this.value,
                itemStyle: {
                  color: '#fff',
                },
              },
            ],
          },
          // 进度条
          {
            type: 'pie',
            radius: ['62%', '73%'],
            itemStyle: {
              normal: {
                color: '#6a5acd',
              },
            },
            labelLine: {
              normal: {
                show: false,
              },
            },
            hoverAnimation: false, //鼠标悬浮是否有区域弹出动画,false:无 true:有
            avoidLabelOverlap: false,
            silent: true, //取消鼠标移入高亮效果: 不响应和触发鼠标事件
            animationEasing: 'cubicOut',
            data: [
              //value当前进度 + 颜色
              {
                value: value,
                itemStyle: {
                  //渐变颜色
                  color: {
                    type: 'linear',
                    x: 0,
                    y: 0,
                    x2: 0,
                    y2: 1,
                    colorStops: [
                      {
                        offset: 0,
                        color: '#C9FFCB', // 0% 处的颜色
                      },
                      {
                        offset: 1,
                        color: '#2C87FF', // 100% 处的颜色
                      },
                    ],
                    global: false, // 缺省为 false
                  },
                  borderRadius: ['20%', '50%'], //进度条圆角: 当饼图为环形图时,内圆角半径是内圆半径的 20%、外圆角半径是外圆半径的 50%
                },
              },
              //(maxValue进度条最大值 - value当前进度) + 颜色
              {
                value: maxValue - value,
                itemStyle: {
                  // 线性渐变颜色
                  // color: {
                  //   type: 'linear',
                  //   x: 0,
                  //   y: 0,
                  //   x2: 0,
                  //   y2: 1,
                  //   colorStops: [
                  //     {
                  //       offset: 0,
                  //       color: '#FCFCFC', // 0% 处的颜色
                  //     },
                  //     {
                  //       offset: 1,
                  //       color: '#F7F7F7', // 100% 处的颜色
                  //     },
                  //   ],
                  //   global: false, // 缺省为 false
                  // },
                  // 径向渐变颜色
                  color: {
                    type: 'radial',
                    x: 1,
                    y: 1,
                    r: 1,
                    colorStops: [
                      {
                        offset: 0,
                        color: '#FCFCFC', // 0% 处的颜色
                      },
                      {
                        offset: 1,
                        color: '#F7F7F7', // 100% 处的颜色
                      },
                    ],
                    global: false, // 缺省为 false
                  },
                },
              },
            ],
          },
          // 外框
          {
            type: 'pie',
            radius: ['73%', '83%'],
            itemStyle: {
              // 阴影
              shadowBlur: 12,
              shadowOffsetX: 0,
              shadowColor: 'rgba(0, 0, 0, 0.1)',
            },
            labelLine: {
              normal: {
                show: false,
              },
            },
            hoverAnimation: false,
            animationEasing: 'cubicOut',
            data: [
              {
                value: this.value,
                itemStyle: {
                  color: new this.$echarts.graphic.LinearGradient(0, 0, 0, 1, [
                    {
                      offset: 0,
                      color: '#F7F7F7',
                    },
                    {
                      offset: 1,
                      color: '#FCFCFC',
                    },
                  ]),
                },
              },
            ],
          },
        ],
      }

      // 使用刚指定的配置项和数据显示图表。
      myChart.setOption(option)
      //随着浏览器窗口大小改变而改变
      window.addEventListener('resize', function () {
        myChart.resize()
      })
    },
  },
}
</script>
<style lang="scss" scoped>
.chartBox {
  width: 50%;
  position: relative;
}
</style>


 440
440


 被折叠的 条评论
为什么被折叠?
被折叠的 条评论
为什么被折叠?
 到【灌水乐园】发言


