


**
首先,第一步下载Echarts。
**
可以使用淘宝镜像下载 更快哦!~
npm 下载:
npm install --registry=https://registry.npm.taobao.org
下载淘宝镜像:
npm install -g cnpm --registry=https://registry.npm.taobao.org
使用cnpm(淘宝镜像)下载echarts:
cnpm install echarts
**
第二步,引入echarts。
**
1. 在main.js中引入Echarts:
 // 引入echarts
import echarts from 'echarts'
Vue.prototype.$echarts = echarts
2. 在本组件页面单独引入
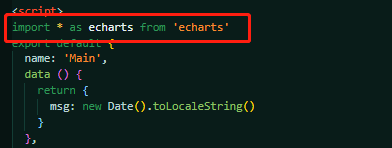
**
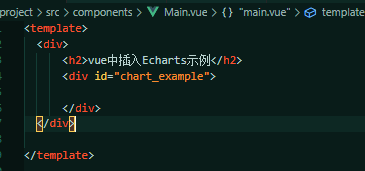
第三步,创建容器和js部分
**
1. 模板中创建容器
2.定义数据
export default {
  name: 'Main',
  data () {
    return {

    }
  },
  mounted () {
    let this_ = this;
    let myChart = echarts.init(document.getElementById('chart_example'));
    let option = {
      backgroundColor: '#080b30',
      title: {
        text: '哎呦,不错哦',
        textStyle: {
          align: 'center',
          color: '#fff',
          fontSize: 20,
        },
        top: '5%',
        left: 'center',
      },
      tooltip: {
        trigger: 'axis',
        axisPointer: {
          lineStyle: {
            color: {
              type: 'linear',
              x: 0,
              y: 0,
              x2: 0,
              y2: 1,
              colorStops: [{
                offset: 0,
                color: 'rgba(0, 255, 233,0)'
              }, {
                offset: 0.5,
                color: 'rgba(255, 255, 255,1)',
              }, {
                offset: 1,
                color: 'rgba(0, 255, 233,0)'
              }],
              global: false
            }
          },
        },
      },
      grid: {
        top: '15%',
        left: '5%',
        right: '5%',
        bottom: '15%',
        // containLabel: true
      },
      xAxis: [{
        type: 'category',
        axisLine: {
          show: true
        },
        splitArea: {
          // show: true,
          color: '#f00',
          lineStyle: {
            color: '#f00'
          },
        },
        axisLabel: {
          color: '#fff'
        },
        splitLine: {
          show: false
        },
        boundaryGap: false,
        data: ['A', 'B', 'C', 'D', 'E', 'F'],

      }],

      yAxis: [{
        type: 'value',
        min: 0,
        // max: 140,
        splitNumber: 4,
        splitLine: {
          show: true,
          lineStyle: {
            color: 'rgba(255,255,255,0.1)'
          }
        },
        axisLine: {
          show: false,
        },
        axisLabel: {
          show: false,
          margin: 20,
          textStyle: {
            color: '#d1e6eb',

          },
        },
        axisTick: {
          show: false,
        },
      }],
      series: [{
        name: '注册总量',
        type: 'line',
        // smooth: true, //是否平滑
        showAllSymbol: true,
        // symbol: 'image://./static/images/guang-circle.png',
        symbol: 'circle',
        symbolSize: 25,
        lineStyle: {
          normal: {
            color: "#6c50f3",
            shadowColor: 'rgba(0, 0, 0, .3)',
            shadowBlur: 0,
            shadowOffsetY: 5,
            shadowOffsetX: 5,
          },
        },
        label: {
          show: true,
          position: 'top',
          textStyle: {
            color: '#6c50f3',
          }
        },
        itemStyle: {
          color: "#6c50f3",
          borderColor: "#fff",
          borderWidth: 3,
          shadowColor: 'rgba(0, 0, 0, .3)',
          shadowBlur: 0,
          shadowOffsetY: 2,
          shadowOffsetX: 2,
        },
        tooltip: {
          show: false
        },
        areaStyle: {
          normal: {
            color: new echarts.graphic.LinearGradient(0, 0, 0, 1, [{
              offset: 0,
              color: 'rgba(108,80,243,0.3)'
            },
            {
              offset: 1,
              color: 'rgba(108,80,243,0)'
            }
            ], false),
            shadowColor: 'rgba(108,80,243, 0.9)',
            shadowBlur: 20
          }
        },
        data: [502.84, 205.97, 332.79, 281.55, 398.35, 214.02,]
      },
      {
        name: '注册总量',
        type: 'line',
        // smooth: true, //是否平滑
        showAllSymbol: true,
        // symbol: 'image://./static/images/guang-circle.png',
        symbol: 'circle',
        symbolSize: 25,
        lineStyle: {
          normal: {
            color: "#00ca95",
            shadowColor: 'rgba(0, 0, 0, .3)',
            shadowBlur: 0,
            shadowOffsetY: 5,
            shadowOffsetX: 5,
          },
        },
        label: {
          show: true,
          position: 'top',
          textStyle: {
            color: '#00ca95',
          }
        },

        itemStyle: {
          color: "#00ca95",
          borderColor: "#fff",
          borderWidth: 3,
          shadowColor: 'rgba(0, 0, 0, .3)',
          shadowBlur: 0,
          shadowOffsetY: 2,
          shadowOffsetX: 2,
        },
        tooltip: {
          show: false
        },
        areaStyle: {
          normal: {
            color: new echarts.graphic.LinearGradient(0, 0, 0, 1, [{
              offset: 0,
              color: 'rgba(0,202,149,0.3)'
            },
            {
              offset: 1,
              color: 'rgba(0,202,149,0)'
            }
            ], false),
            shadowColor: 'rgba(0,202,149, 0.9)',
            shadowBlur: 20
          }
        },
        data: [281.55, 398.35, 214.02, 179.55, 289.57, 356.14,],
      },
      ]
    };
    myChart.setOption(option);

    //建议加上以下这一行代码,不加的效果图如下(当浏览器窗口缩小的时候)。超过了div的界限(红色边框)
    window.addEventListener('resize', function () { myChart.resize() });


  },
注释: 建议加上以下这一行代码,不加的效果图如下(当浏览器窗口缩小的时候)。超过了div的界限(红色边框)
window.addEventListener('resize', function () { myChart.resize() });
**
效果图
**

另: Echarts论坛实例,上面有很多可视化案例。 点击进入查看


 被折叠的 条评论
为什么被折叠?
被折叠的 条评论
为什么被折叠?
 到【灌水乐园】发言


