【vue3/echarts】vue3中使用echarts/饼图/双轴双数据柱状图

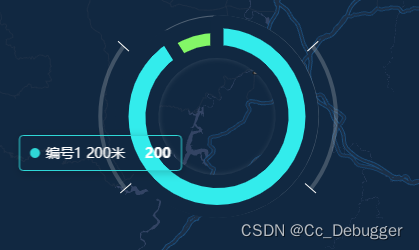
在这里插入图片描述

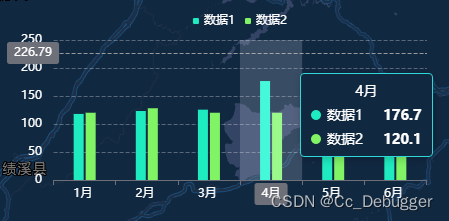
在这里插入图片描述

npm下载echarts

引入使用

<script>
import Box from "@/components/box.vue";
import { onMounted } from 'vue';
import { init } from 'echarts';
export default {
    components: {
        Box: Box
    },
    setup() {

        onMounted(() => {
        // 饼图
            const charEle = document.getElementById('echarts1');
            const charEch = init(charEle);
            const colorList = ['#2FD7D7 ', '#83F767', '#59CB74', '#FBD444', '#7F6AAD', '#585247', '#ff0000']
            const option = {
               
                tooltip: {
                    show: true,
                    trigger: 'item',
                    backgroundColor: 'transparent',
                    borderColor: '#2FD7D7',
                    textStyle: {
                        color: '#fff'
                    }
                },
               
                color: colorList,
                series: [
                    {
                        name: '',
                        type: 'pie',
                        radius: [65, 90],
                        center: ['48%', '49%'],
                        label: {
                            show: false
                        },
                        labelLine: {
                            show: false
                        },
                        itemStyle: {
                            borderWidth: 13,
                            borderColor: '#112841'
                        },
                        data: [
                            { name: '编号1 200米', value: 200 },
                            { name: '编号2 200米', value: 20 },
                        ],
                    }
                ]
            };
            charEch.setOption(option);


            const charEle2 = document.getElementById('echarts2');
            const charEch2 = init(charEle2);
            var xData = ['1月', '2月', '3月', '4月', '5月', '6月'];
            var moneyData = [118.0, 123.2, 125.6, 176.7, 115.6, 162.2];
            var numData = [120.1, 128.1, 120.1, 120.1, 128.1, 128.1];
            const option2 = {
                tooltip: {
                    // show: false,
                    trigger: 'axis',
                    backgroundColor: '#112841',
                    borderColor: '#2FD7D7',
                    textStyle: {
                        color: '#fff'
                    },
                    axisPointer: {
                        type: 'cross',
                        crossStyle: {
                            color: '#999',
                        },
                    },
                },
                grid: {
                    top: 50
                },
                legend: {
                    data: ['数据1',
                        '数据2'],
                    top: '20',
                    itemWidth: 6,
                    itemHeight: 6,
                    textStyle: {
                        color: '#fff'
                    }
                },
                xAxis: [{
                    type: 'category',
                    data: xData,
                    axisPointer: {
                        type: 'shadow',
                    },
                    axisLabel: {
                        formatter: '{value} ',
                        color: '#fff'
                    },
                },
                ],
                yAxis: [{
                    type: 'value',
                    name: '',
                    min: 0,
                    max: 250,
                    interval: 50,
                    splitLine: {
                        lineStyle: {
                            type: "dashed",
                            color: "#fff",
                            opacity: 0.3
                        }
                    },
                    axisLabel: {
                        formatter: '{value} ',
                        color: '#fff'
                    },
                },
                // y右侧轴
                    // {
                    //     type: 'value',
                    //     name: '',
                    //     min: 0,
                    //     max: 25,
                    //     interval: 5,
                    //     axisLabel: {
                    //         formatter: '{value} ',
                    //     },
                    // },
                ],
                series: [{
                    name: '数据1',
                    type: 'bar',
                    data: moneyData,
                    color: '#1FEBC0',
                    tooltip: {
                        valueFormatter: function (value) {
                            return value + '';
                        },
                    },
                    // 柱体上方显示数值
                    label: {
                        show: false,
                        position: 'top',
                    },
                    barWidth: 10
                },
                {
                    name: '数据2',
                    type: 'bar',
                    data: numData,
                    color: '#81F466',
                    // 柱体上方显示数值
                    label: {
                        show: false,
                        position: 'top',
                    },
                    barWidth: 10

                },
                ],
            };
            charEch2.setOption(option2);
        });


        return {}
    },
}
</script>
  • 0
    点赞
  • 1
    收藏
    觉得还不错? 一键收藏
  • 0
    评论

“相关推荐”对你有帮助么?

  • 非常没帮助
  • 没帮助
  • 一般
  • 有帮助
  • 非常有帮助
提交
评论
添加红包

请填写红包祝福语或标题

红包个数最小为10个

红包金额最低5元

当前余额3.43前往充值 >
需支付:10.00
成就一亿技术人!
领取后你会自动成为博主和红包主的粉丝 规则
hope_wisdom
发出的红包
实付
使用余额支付
点击重新获取
扫码支付
钱包余额 0

抵扣说明:

1.余额是钱包充值的虚拟货币,按照1:1的比例进行支付金额的抵扣。
2.余额无法直接购买下载,可以购买VIP、付费专栏及课程。

余额充值