echarts地图map鼠标移入区域颜色(渐变)

鼠标移入透明

在这里插入图片描述

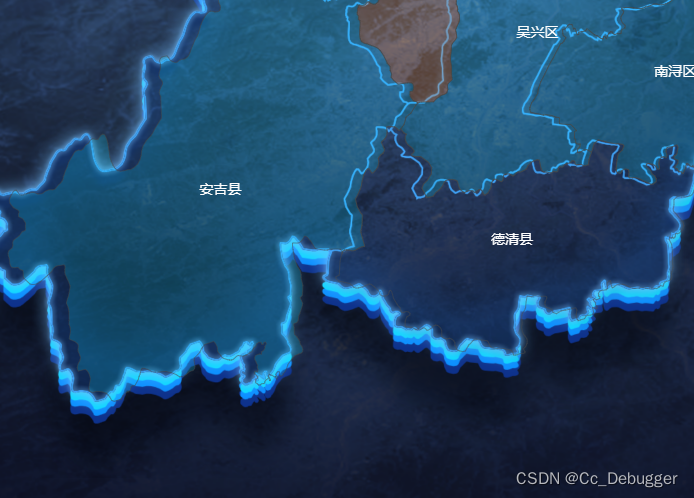
itemStyle下 emphasis属性

itemStyle: {
                //    # 在未设置dataRange或	visualMap时设置有效
                        normal: {
                            // borderColor: 'rgba(12, 222, 255, 1)',
                            // borderWidth: 0.8,
                            areaColor: {
                                type: 'linear-gradient',
                                x: 0,
                                y: 300,
                                x2: 0,
                                y2: 0,
                                colorStops: [
                                    {
                                        offset: 0,
                                        color: 'rgba(0,0,0, 1)', // 0% 处的颜色
                                    },
                                    {
                                        offset: 1,
                                        color: 'rgba(0,0,0, 0)',
                                    },
                                ],
                                global: true, // 缺省为 false
                            },
                        },
                        emphasis: {
                            shadowColor: 'rgba(0, 0, 0, 1)',
                            shadowBlur: 10,
                            shadowOffsetX: 5,
                            shadowOffsetY: 5,
                            areaColor: {
                                type: 'linear-gradient',
                                x: 0,
                                y: 0,
                                x2: 0,
                                y2: 1,
                                colorStops: [
                                    {
                                        offset: 0,
                                        color: 'rgba(243, 174, 48, 0)', // 0% 处的颜色
                                    },
                                    {
                                        offset: 1,
                                        color: 'rgba(243, 174, 48, 0)',
                                    },
                                ],
                            },
                        },
                    },
   series: [
                    {
                        type: 'map',
                        map: 'area',
                        selectedMode: 'single',
                        aspectScale: 0.73,
                        layoutCenter: ['50%', '51%'], //地图位置
                        layoutSize: '100%',
                        // borderWidth: 20,
                        // borderColor: "#ccc",
                        itemStyle: {
                    //    # 在未设置dataRange或	visualMap时设置有效
                            normal: {
                                // borderColor: 'rgba(12, 222, 255, 1)',
                                // borderWidth: 0.8,
                                areaColor: {
                                    type: 'linear-gradient',
                                    x: 0,
                                    y: 300,
                                    x2: 0,
                                    y2: 0,
                                    colorStops: [
                                        {
                                            offset: 0,
                                            color: 'rgba(0,0,0, 1)', // 0% 处的颜色
                                        },
                                        {
                                            offset: 1,
                                            color: 'rgba(0,0,0, 0)',
                                        },
                                    ],
                                    global: true, // 缺省为 false
                                },
                            },
                            emphasis: {
                                shadowColor: 'rgba(0, 0, 0, 1)',
                                shadowBlur: 10,
                                shadowOffsetX: 5,
                                shadowOffsetY: 5,
                                areaColor: {
                                    type: 'linear-gradient',
                                    x: 0,
                                    y: 0,
                                    x2: 0,
                                    y2: 1,
                                    colorStops: [
                                        {
                                            offset: 0,
                                            color: 'rgba(243, 174, 48, 0)', // 0% 处的颜色
                                        },
                                        {
                                            offset: 1,
                                            color: 'rgba(243, 174, 48, 0)',
                                        },
                                    ],
                                },
                            },
                        },
                        label: {
                            normal: {
                                show: true,
                                fontFamily: 'SourceHanSansCN',
                                fontSize: '14',
                                color: '#FEFEFE',
                            },
                            emphasis: {
                                show: true,
                                fontFamily: 'SourceHanSansCN',
                                fontSize: '14',
                                color: '#FEFEFE',
                            },
                        },
    
                        zlevel: 1,
                        data: outdata,
                    },
                ],
  • 8
    点赞
  • 8
    收藏
    觉得还不错? 一键收藏
  • 2
    评论
要在 ECharts 地图上实现移入时改变颜色的效果,你可以使用 ECharts 的事件监听和更新配置的功能。 以下是一个示例代码,演示了在移入地图区域时改变颜色的效果: ```javascript // 初始化 ECharts 实例 var myChart = echarts.init(document.getElementById('chart')); // 地图数据 var mapData = [ {name: '北京', value: 100}, {name: '上海', value: 200}, // 其他地区数据... ]; // 配置项 var option = { // 其他配置项... series: [{ type: 'map', map: 'china', data: mapData, // 在地图区域上添加事件监听 itemStyle: { // 默认状态下的样式 normal: { areaColor: '#ccc', borderColor: '#fff' }, // 鼠标移入时的样式 emphasis: { areaColor: '#ff0', borderColor: '#fff' } }, // 监听鼠标移入事件 // 在移入时更新配置项,改变样式 // 移出时还原样式 eventHandlers: { 'mouseover': function(params) { var dataIndex = params.dataIndex; myChart.setOption({ series: [{ emphasis: { itemStyle: { areaColor: '#ff0', borderColor: '#fff' } } }] }); }, 'mouseout': function(params) { var dataIndex = params.dataIndex; myChart.setOption({ series: [{ emphasis: {} }] }); } } }] }; // 使用配置项生成地图 myChart.setOption(option); ``` 在上面的代码中,我们通过配置项的 `itemStyle` 字段定义了地图区域的样式,其中 `normal` 表示默认状态下的样式,`emphasis` 表示鼠标移入时的样式。然后,在 `eventHandlers` 字段中监听了 `mouseover` 和 `mouseout` 事件,在移入和移出时更新配置项,从而改变样式。 你可以根据自己的需求修改 `areaColor`、`borderColor` 等样式属性来实现不同的效果。同时,你也可以根据实际情况修改地图数据和其他配置项。 希望以上信息对你有所帮助!如果还有其他问题,请随时提问。

“相关推荐”对你有帮助么?

  • 非常没帮助
  • 没帮助
  • 一般
  • 有帮助
  • 非常有帮助
提交
评论 2
添加红包

请填写红包祝福语或标题

红包个数最小为10个

红包金额最低5元

当前余额3.43前往充值 >
需支付:10.00
成就一亿技术人!
领取后你会自动成为博主和红包主的粉丝 规则
hope_wisdom
发出的红包
实付
使用余额支付
点击重新获取
扫码支付
钱包余额 0

抵扣说明:

1.余额是钱包充值的虚拟货币,按照1:1的比例进行支付金额的抵扣。
2.余额无法直接购买下载,可以购买VIP、付费专栏及课程。

余额充值