


 本文介绍如何使用ECharts构建日历热力图,展示特定日期的重要事件及节假日,通过热力图颜色变化直观反映事件密集度,同时提供事件详情及节假日信息。
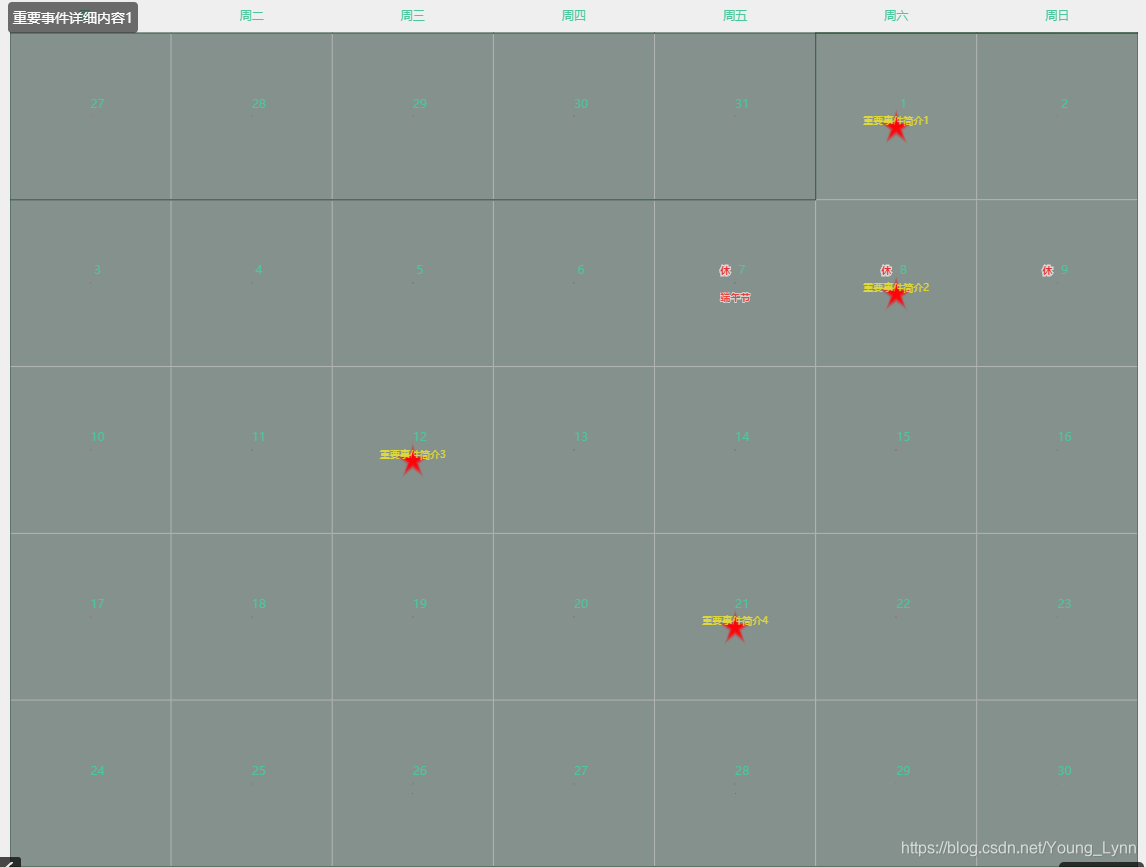
效果图
代码
    <!--01、 引入 ECharts 文件 -->
    <script src="../js/echarts-4.1.0/echarts.js"></script>
    <script src="../js/theme/customed.js"></script>
    <!--02、 构建 ECharts 数据源 -->
    <script type="text/javascript">
        var data = [
            //['日期', '是否有重要事件(80)','重要事件简介','节假日','是否是休息日或加班日','重要事件详细内容']
            ['2019-5-27', '','','','',''],
            ['2019-5-28', '','','','',''],
            ['2019-5-29', '','','','',''],
            ['2019-5-30', '','','','',''],
            ['2019-5-31', '','','','',''],
            ['2019-6-1', '80','重要事件简介1','','','重要事件详细内容1'],
            ['2019-6-2', '', '','','',''],
            ['2019-6-3', '', '','','',''],
            ['2019-6-4', '', '','','',''],
            ['2019-6-5', '', '','','',''],
            ['2019-6-6', '', '','','',''],
            ['2019-6-7', '','','端午节','休',''],
            ['2019-6-8', '80','重要事件简介2','','休','重要事件详细内容2'],
            ['2019-6-9', '','','','休',''],
            ['2019-6-10', '', '','','',''],
            ['2019-6-11', '', '','','',''],
            ['2019-6-12', '80','重要事件简介3','','','重要事件详细内容3'],
            ['2019-6-13', '', '','','',''],
            ['2019-6-14', '', '','','',''],
            ['2019-6-15', '', '','','',''],
            ['2019-6-16', '', '','','',''],
            ['2019-6-17', '', '','','',''],
            ['2019-6-18', '', '','','',''],
            ['2019-6-19', '', '','','',''],
            ['2019-6-20', '', '','','',''],
            ['2019-6-21', '80','重要事件简介4','','','重要事件详细内容4'],
            ['2019-6-22', '', '','','',''],
            ['2019-6-23', '', '','','',''],
            ['2019-6-24', '', '','','',''],
            ['2019-6-25', '', '','','',''],
            ['2019-6-26', '', '','','',''],
            ['2019-6-27', '', '','','',''],
            ['2019-6-28', '', '','','',''],
            ['2019-6-29', '', '','','',''],
            ['2019-6-30', '', '','','','']
        ];

        var jjrdata = [];
        var cdata = [];
        var data1 = [];
        var event = [];
        var heatmapData = [];//热力图,用来标记有重要事件的
        for (var i = 0; i < data.length; i++) {
            heatmapData.push([
                data[i][0],
                Math.random() * 10
            ]);
            event.push([data[i][0],data[i][5]]);
            data1.push([data[i][0],data[i][1]]);
            jjrdata.push([data[i][0],'', data[i][2], data[i][3], data[i][4]]);
            cdata.push([data[i][0], 1, data[i][2], data[i][3], data[i][4]]);
        }

        var option = {
            tooltip: {
                trigger: 'item',
                position: [-2, -8],
                formatter:function (params) {
                    for(var i = 0;i<event.length;i++){
                        if(event[i][0] == params.data[0]){
                           if(event[i][1] != ""){
                               return event[i][1];
                           }
                        }
                    }
                }
            },
            visualMap: {
                show: false,
                min: 0,
                max: 10,
                calculable: true,
                seriesIndex: [5],
                orient: 'horizontal',
                left: 'center',
                bottom: 20,
                inRange: {
                    // color: ['#e0ffff', '#006edd'],
                    opacity: 0.1
                },
                controller: {
                    inRange: {
                        opacity: 0.2
                    }
                }
            },

            calendar: [{
                left: 0,
                top: 23,
                range: [data1[0][0], data1[data1.length-1][0]],
                orient: 'vertical',
                cellSize: 'auto',
                splitLine: {
                    // show: false,
                    lineStyle: {
                        color:'#294c38',
                        // width: 5,
                        // type: 'solid'
                    }
                },
                yearLabel: {
                    margin:60,
                    show:false,
                    color:'#000000'
                },
                monthLabel: {
                    show:false,
                    firstDay: 1,
                    nameMap: 'cn',
                    margin:30,
                    color:'#000000'
                },
                dayLabel: {
                    color:'#4cc79b',
                    margin: 10,
                    firstDay: 1,
                    nameMap: ['周日', '周一', '周二', '周三', '周四', '周五', '周六'],
                },
                itemStyle:{
                    color:'#182724',
                    borderWidth: 1,
                    opacity:0.5
                }

            }],
            series: [ {
                name: '节假日',
                type: 'scatter',
                coordinateSystem: 'calendar',
                symbolSize: 1,
                label: {
                    normal: {
                        show: true,
                        formatter: function (params) {
                            return '\n\n' + (params.value[3] || '');
                        },
                        offset: [0, 5],
                        textStyle: {
                            fontSize: 10,
                            fontWeight: 700,
                            color: '#ee221a',
                            textBorderColor: '#eee'
                        }
                    }
                },
                data: cdata
            },
                {
                    name: '长假',
                    type: 'scatter',
                    coordinateSystem: 'calendar',
                    symbolSize: 1,
                    symbol: 'rect',
                    label: {
                        normal: {
                            show: true,
                            formatter: function (params) {
                                if(params.value[4] == '休'){
                                    return "{a|休}";
                                }
                            },
                            offset: [-10, -12],
                            rich: {
                                a: {
                                    fontSize: 10,
                                    fontWeight: 800,
                                    color: '#e00',
                                    textBorderColor: '#eee'
                                }
                            }
                        }
                    },
                    data: jjrdata
                },
                {
                    name: '周末上班',
                    type: 'scatter',
                    coordinateSystem: 'calendar',
                    symbolSize: 1,
                    symbol: 'rect',
                    label: {
                        normal: {
                            show: true,
                            formatter: function (params) {
                                if(params.value[4] == '班'){
                                    return "{a|班}";
                                }
                            },
                            offset: [-10, -15],
                            rich: {
                                a: {
                                    fontSize: 10,
                                    fontWeight: 800,
                                    color: '#11264f',
                                    textBorderColor: '#eee'
                                }
                            }
                        }
                    },
                    data: jjrdata
                },{
                    name: '事件',
                    type: 'scatter',
                    coordinateSystem: 'calendar',
                    symbolSize: 1,
                    label: {
                        normal: {
                            show: true,
                            formatter: function (params) {
                                return params.value[2];
                            },
                            offset: [0, 5],
                            textStyle: {
                                fontSize: 10,
                                color: '#f4e925'

                            }
                        }
                    },
                    data: cdata
                },{
                    name: '公立以及标记事件',
                    type: 'effectScatter',
                    coordinateSystem: 'calendar',
                    data: data1,
                    symbol:'path://m380.9075,231.05301l12.60495,0l3.89503,-12.22293l3.89503,12.22293l12.60495,0l-10.1976,7.5541l3.89523,12.22293l-10.19761,-7.55431l-10.19761,7.55431l3.89523,-12.22293l-10.19761,-7.5541z',
                    symbolSize: function(val) {
                        val = val[1] / 5;
                        val = val <5 ? 0.1 : Math.min(val, 30);
                        return val;
                    },
                    symbolOffset:[0, 10],
                    itemStyle: {
                        normal: {
                            color: '#ff030a'
                        }
                    },
                    label: {
                        show: true,
                        formatter:function(params) {
                            return params.value[0].split("-")[2]
                        },
                        offset: [7, -22],
                        color: '#4cc79b'
                    }
                }, {
                    name: '提示',
                    type: 'heatmap',
                    coordinateSystem: 'calendar',
                    data: heatmapData
                }]
            };
 </script>
工作中使用到的,总结归纳后,仅供各位大神们参考......


 673
673

 被折叠的 条评论
为什么被折叠?
被折叠的 条评论
为什么被折叠?
 到【灌水乐园】发言


