


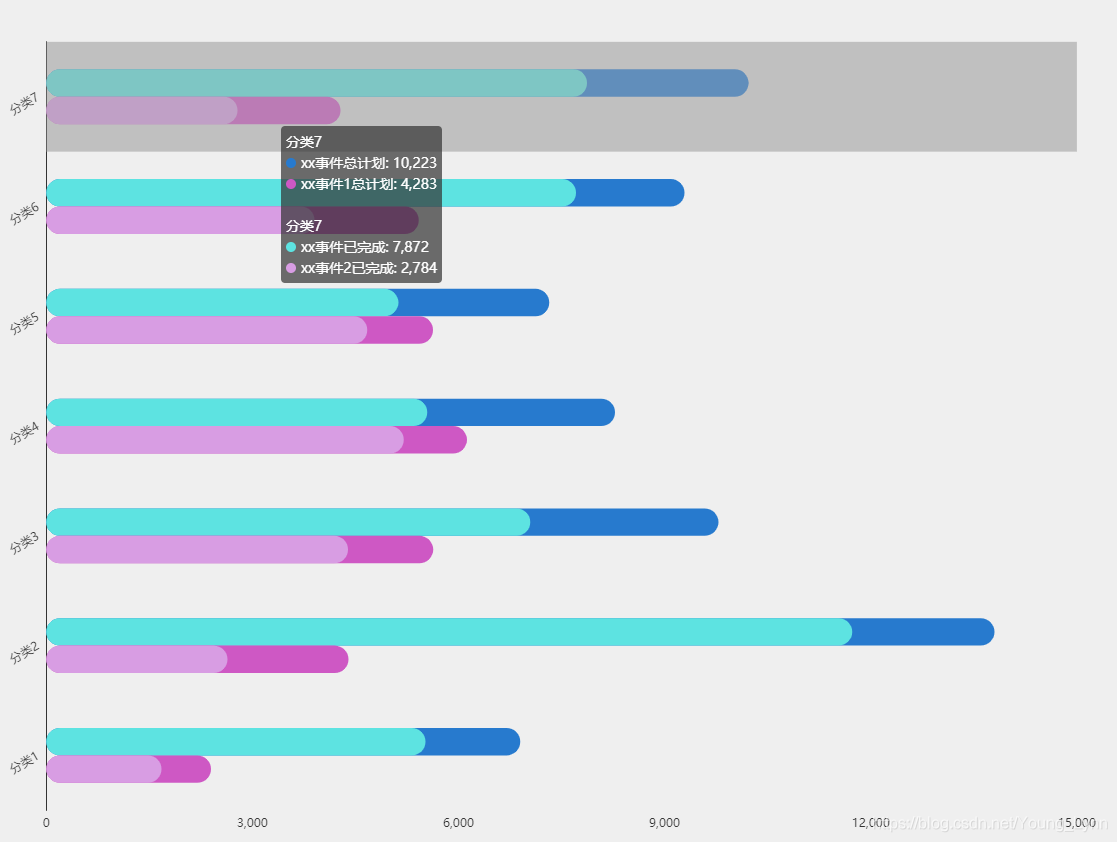
效果图
代码
<script src="../js/echarts-4.1.0/echarts.js"></script>
<script src="../js/theme/customed.js"></script>
<script type="text/javascript">
    var legendData = ['xx事件总计划','xx事件已完成','xx事件1总计划','xx事件2已完成'];
    var yAxisData = ['分类1','分类2','分类3','分类4','分类5','分类6','分类7'];
    var llData = [5520,11730,7044,5547,5126,7710,7872];
    var llwwcData = [1380,2070,2739,2732,2197,1579,2351];

    var jsData = [1680,2640,4393,5205,4673,3905,2784];
    var jswwcData = [720,1760,1239,918,957,1518,1499];

    //总计
    var allllData = function() {
        var datas = [];
        for (var i = 0; i < llData.length; i++) {
            datas.push(llData[i] + llwwcData[i]);
        }
        return datas;
    }();

    //总计
    var alljsData = function() {
        var datas = [];
        for (var i = 0; i < jsData.length; i++) {
            datas.push(jsData[i] + jswwcData[i]);
        }
        return datas;
    }();

    var option = {
        // legend: {
        //     icon: "circle",
        //     itemWidth: 10,  // 设置宽度
        //     itemHeight: 10, // 设置高度
        //     itemGap: 2, // 设置间距
        //     textStyle:{
        //         fontSize:10,
        //     },
        //     x: 'right',
        //     top:'-1',
        //     data: legendData
        // },
        grid: {
            top:'5%',
            left: '1%',
            right: '4%',
            bottom: '3%',
            containLabel: true
        },

        tooltip: {
            show:"true",
            trigger: 'axis',
            axisPointer: { // 坐标轴指示器,坐标轴触发有效
                type: 'shadow' // 默认为直线,可选为:'line' | 'shadow'
            }
        },
        xAxis:  {
            type: 'value',
            axisTick : {show: false},
            axisLine: {
                show: false,
                // lineStyle:{
                //     color:'#fff',
                // }
            },
            splitLine: {
                show: false
            },
        },
        yAxis: [
            {
                type: 'category',
                axisLabel: {
                    interval: 0,
                    rotate: 30
                },
                axisTick : {show: false},
                axisLine: {
                    show: true,
                    // lineStyle:{
                    //     color:'#fff',
                    // }
                },
                data: yAxisData
            },
            {
                type: 'category',
                axisLine: {show:false},
                axisTick: {show:false},
                axisLabel: {show:false},
                splitArea: {show:false},
                splitLine: {show:false},
                data: yAxisData
            },

        ],
        series: [
            {
                name: legendData[0],
                type: 'bar',
                yAxisIndex:1,
                itemStyle:{
                    normal: {
                        show: true,
                        color: '#277ace',
                        barBorderRadius:50,
                        borderWidth:0,
                        borderColor:'#333',
                    }
                },
                barGap:'0%',
                barCategoryGap:'50%',
                data: allllData
            },
            {
                name: legendData[1],
                type: 'bar',
                itemStyle:{
                    normal: {
                        show: true,
                        color: '#5de3e1',
                        barBorderRadius:50,
                        borderWidth:0,
                        borderColor:'#333',
                    }
                },
                barGap:'0%',
                barCategoryGap:'50%',
                data: llData
            },{
                name: legendData[2],
                type: 'bar',
                yAxisIndex:1,
                itemStyle:{
                    normal: {
                        show: true,
                        color: '#ce58c4',
                        barBorderRadius:50,
                        borderWidth:0,
                        borderColor:'#333',
                    }
                },
                barGap:'0%',
                barCategoryGap:'50%',
                data: alljsData
            },
            {
                name: legendData[3],
                type: 'bar',
                itemStyle:{
                    normal: {
                        show: true,
                        color: '#d89de3',
                        barBorderRadius:50,
                        borderWidth:0,
                        borderColor:'#333',
                    }
                },
                barGap:'0%',
                barCategoryGap:'50%',
                data: jsData
            }


        ]
    };
</script>
工作中使用到的,总结归纳后,仅供各位大神们参考......


 2782
2782


 被折叠的 条评论
为什么被折叠?
被折叠的 条评论
为什么被折叠?
 到【灌水乐园】发言


