


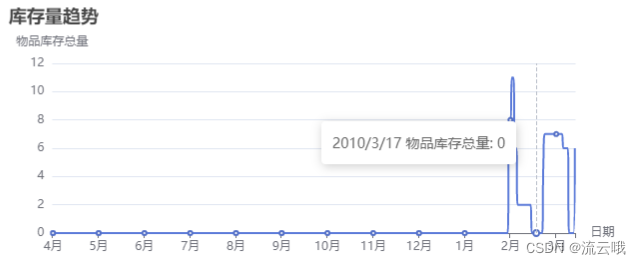
X轴使用的 type: 'category'显示的月份不能对齐每天的日期,2月到三月之间还有3月10号
使用之前
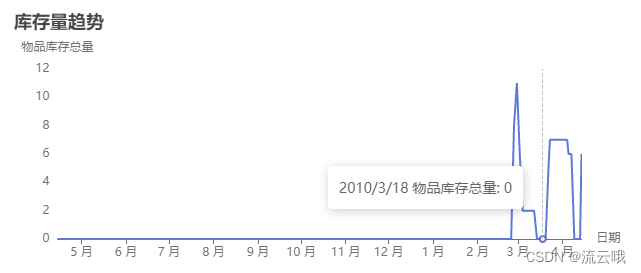
使用type:'time' time时间轴,只接受时间格式
value: [new Date(item.time).getTime(), item.count]
默认是英文月份自定义:
axisLabel: { formatter: function (value) { const date = new Date(value); const month = date.getMonth() + 1; return${month} 月; } }
默认的分成6份,自定义坐标间隔,让月份更清晰,通过属性splitNumber: 12// 将 X 轴分为 12 份
使用之后:
下面具体代码demo:
import React, { memo, useEffect, useRef } from 'react';
import * as echarts from 'echarts';
import styles from './index.module.less';
interface Iprops {
data?: ISafeAny[];
}
function xxTrend(props: Iprops) {
const { data = [] } = props;
const divRef = useRef<HTMLDivElement | null>(null);
const echartsRef = useRef<ISafeAny>(null);
const option: ISafeAny = {
title: {
text: 'xx量趋势',
left: '17',
top: '0'
},
//之前X轴使用的 type: 'category'
// tooltip: {
// trigger: 'axis',
// formatter: function (params) {
// params = params[0];
// const date = new Date(params.name);
// return date.getFullYear() + '/' + (date.getMonth() + 1) + '/' + date.getDate() + ' 物品库存总量: ' + params.value;
// },
// axisPointer: {
// animation: false
// }
// },
// xAxis: {
// name: '日期',
// type: 'category',
// data: data.map((item) => item.time),
// axisLabel: {
// formatter: function (value) {
// return echarts.format.formatTime('MM月', value); // 仅显示月份
// }
// }
// },
// yAxis: {
// name: '物品库存总量',
// type: 'value'
// },
// series: [
// {
// data: data.map((item) => item.count),
// type: 'line',
// smooth: true
// }
// ]
tooltip: {
trigger: 'axis',
formatter: function (params) {
params = params[0];
const date = new Date(params.axisValueLabel);
console.log('date222', date);
return date.getFullYear() + '/' + (date.getMonth() + 1) + '/' + date.getDate() + ' 物xxx总量: ' + params.value[1];
},
axisPointer: {
animation: false
}
},
xAxis: {
name: '日期',
type: 'time',
splitLine: {
show: false
},
boundaryGap: false,
splitNumber: 12, // 将 X 轴分为 12 份
axisLabel: {
formatter: function (value) {
const date = new Date(value);
const month = date.getMonth() + 1;
return `${month} 月`;
}
}
},
yAxis: {
name: '物xx总量',
type: 'value',
splitLine: {
show: false
}
},
series: [
{
type: 'line',
showSymbol: false,
data: data.map((item) => {
return {
value: [new Date(item.time).getTime(), item.count]
};
})
}
]
};
useEffect(() => {
if (divRef.current) {
echartsRef.current = echarts.init(divRef.current);
echartsRef.current.setOption(option);
} else if (echartsRef.current) {
echartsRef.current.setOption({
series: { data }
});
}
}, [data]);
return (
<div className={styles['echart-box']}>
<div ref={divRef} className={styles['echart-con']} />
</div>
);
}
export default memo(xxTrend);


 1043
1043


 被折叠的 条评论
为什么被折叠?
被折叠的 条评论
为什么被折叠?
 到【灌水乐园】发言


