


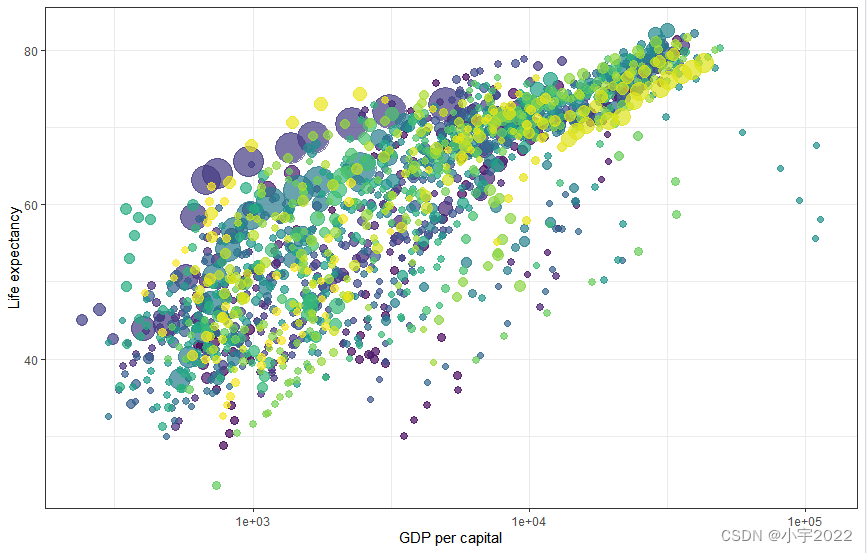
单位GDP与寿命的关系统计绘图
library(ggplot2)
library(gganimate)
theme_set(theme_bw())
library(gapminder)
head(gapminder)
p <- ggplot(
  gapminder,
  aes(x = gdpPercap, y=lifeExp, size = pop, colour = country)
) +
  geom_point(show.legend = FALSE, alpha = 0.7) +
  scale_color_viridis_d() +
  scale_size(range = c(2, 12)) +
  scale_x_log10() +
  labs(x = "GDP per capital", y = "Life expectancy")
p
通过不同州的时间数据进行转换

library(ggplot2)
library(gganimate)
theme_set(theme_bw())
library(gapminder)
head(gapminder)
p <- ggplot(
  gapminder,
  aes(x = gdpPercap, y=lifeExp, size = pop, colour = country)
) +
  geom_point(show.legend = FALSE, alpha = 0.7) +
  scale_color_viridis_d() +
  scale_size(range = c(2, 12)) +
  scale_x_log10() +
  labs(x = "GDP per capital", y = "Life expectancy")
p + transition_time(year) +
  labs(title = "Year: {frame_time}")
根据不同大洲创建不同面:
 最低0.47元/天 解锁文章


 54
54


 被折叠的 条评论
为什么被折叠?
被折叠的 条评论
为什么被折叠?
 到【灌水乐园】发言


