


目录
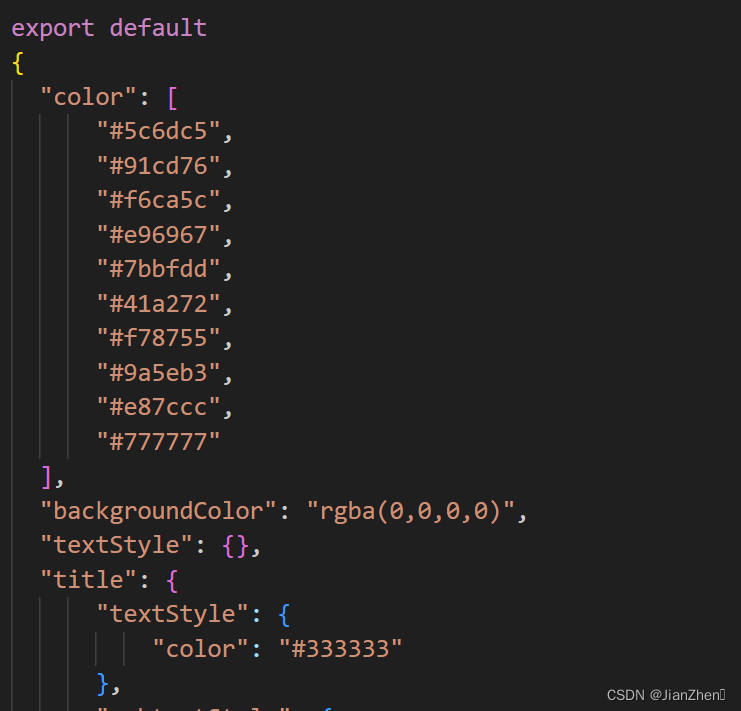
编辑 新建js文件,把复制的内容放进去,注意要使用export default 复制的JSON内容
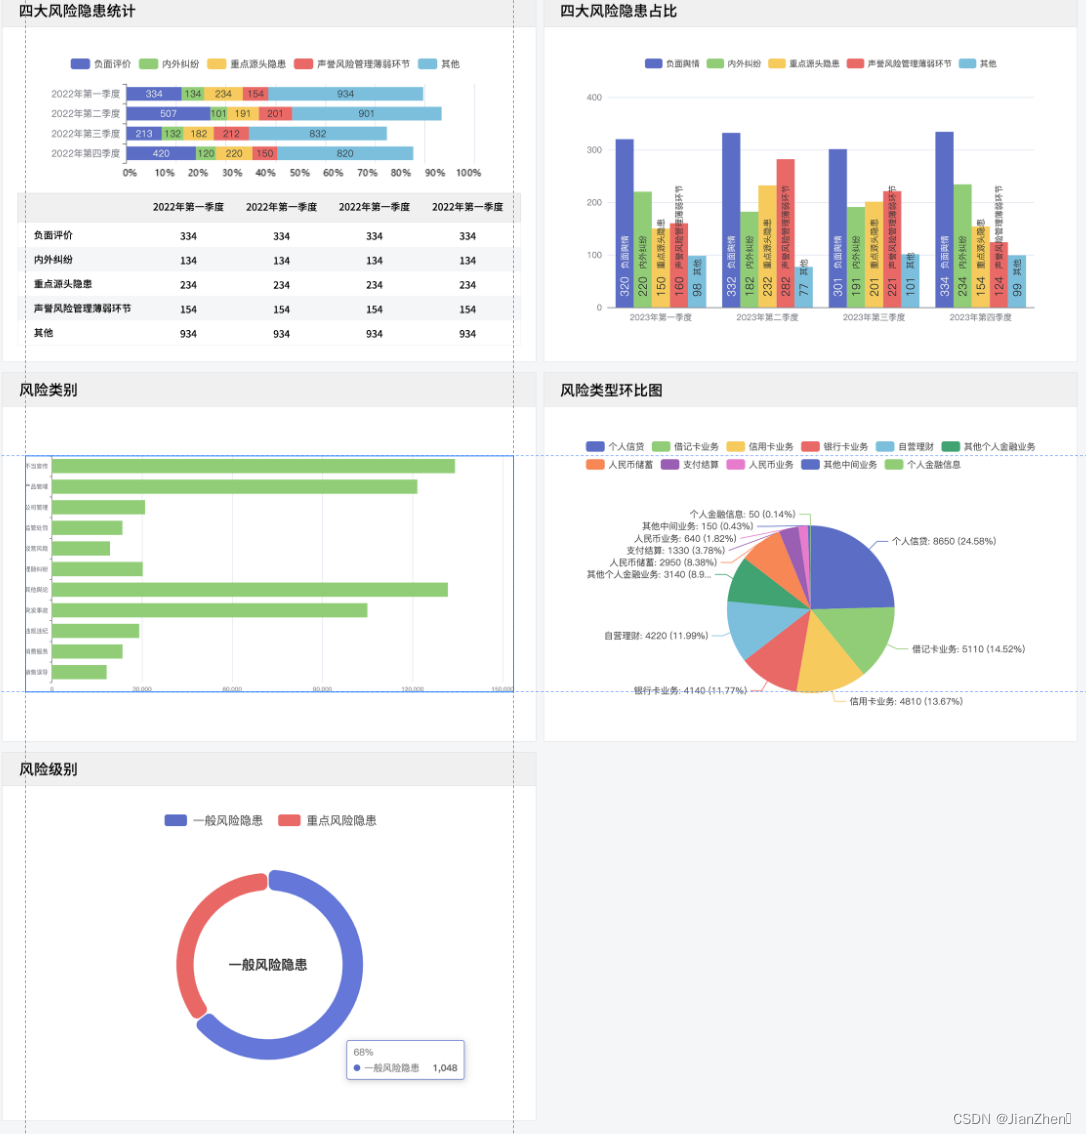
数据处理
有时候接口返回来的一堆数据有很多不同的图表和表格使用,这时候就不得不一直重组数据格式,有时候拼来拼去,花费很长时间
比如
<div class="flex-content">
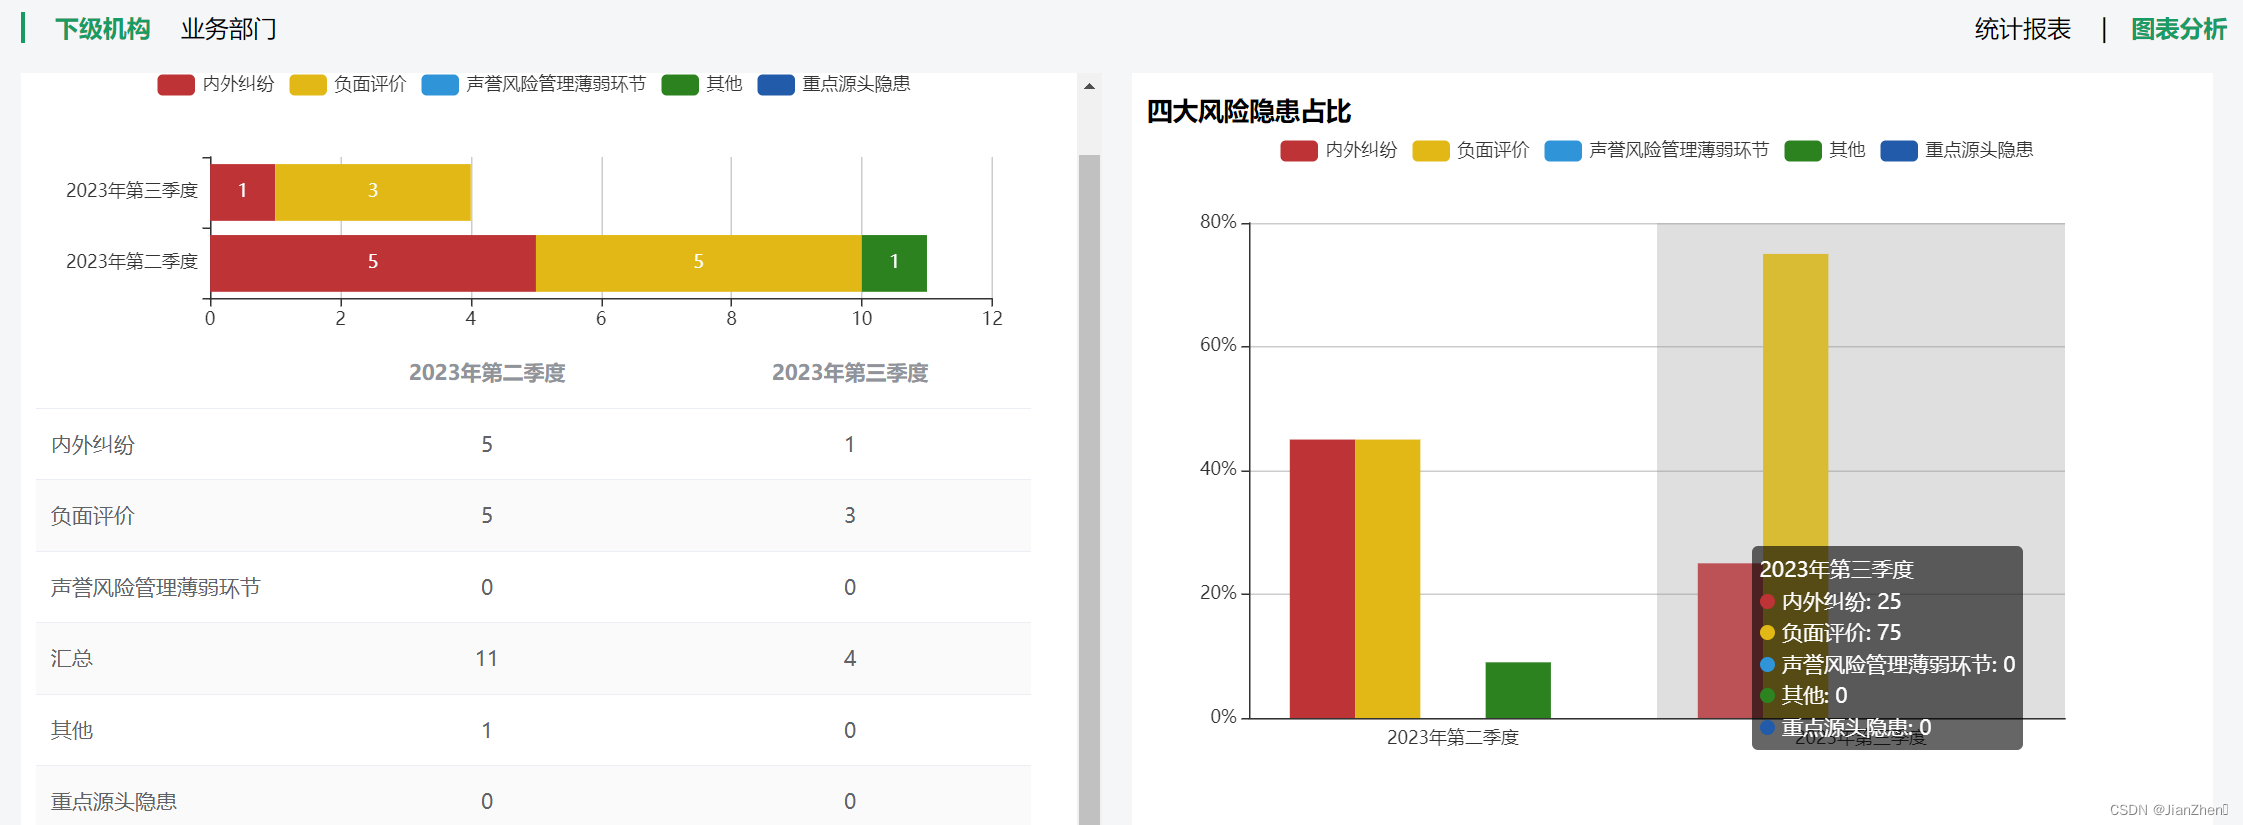
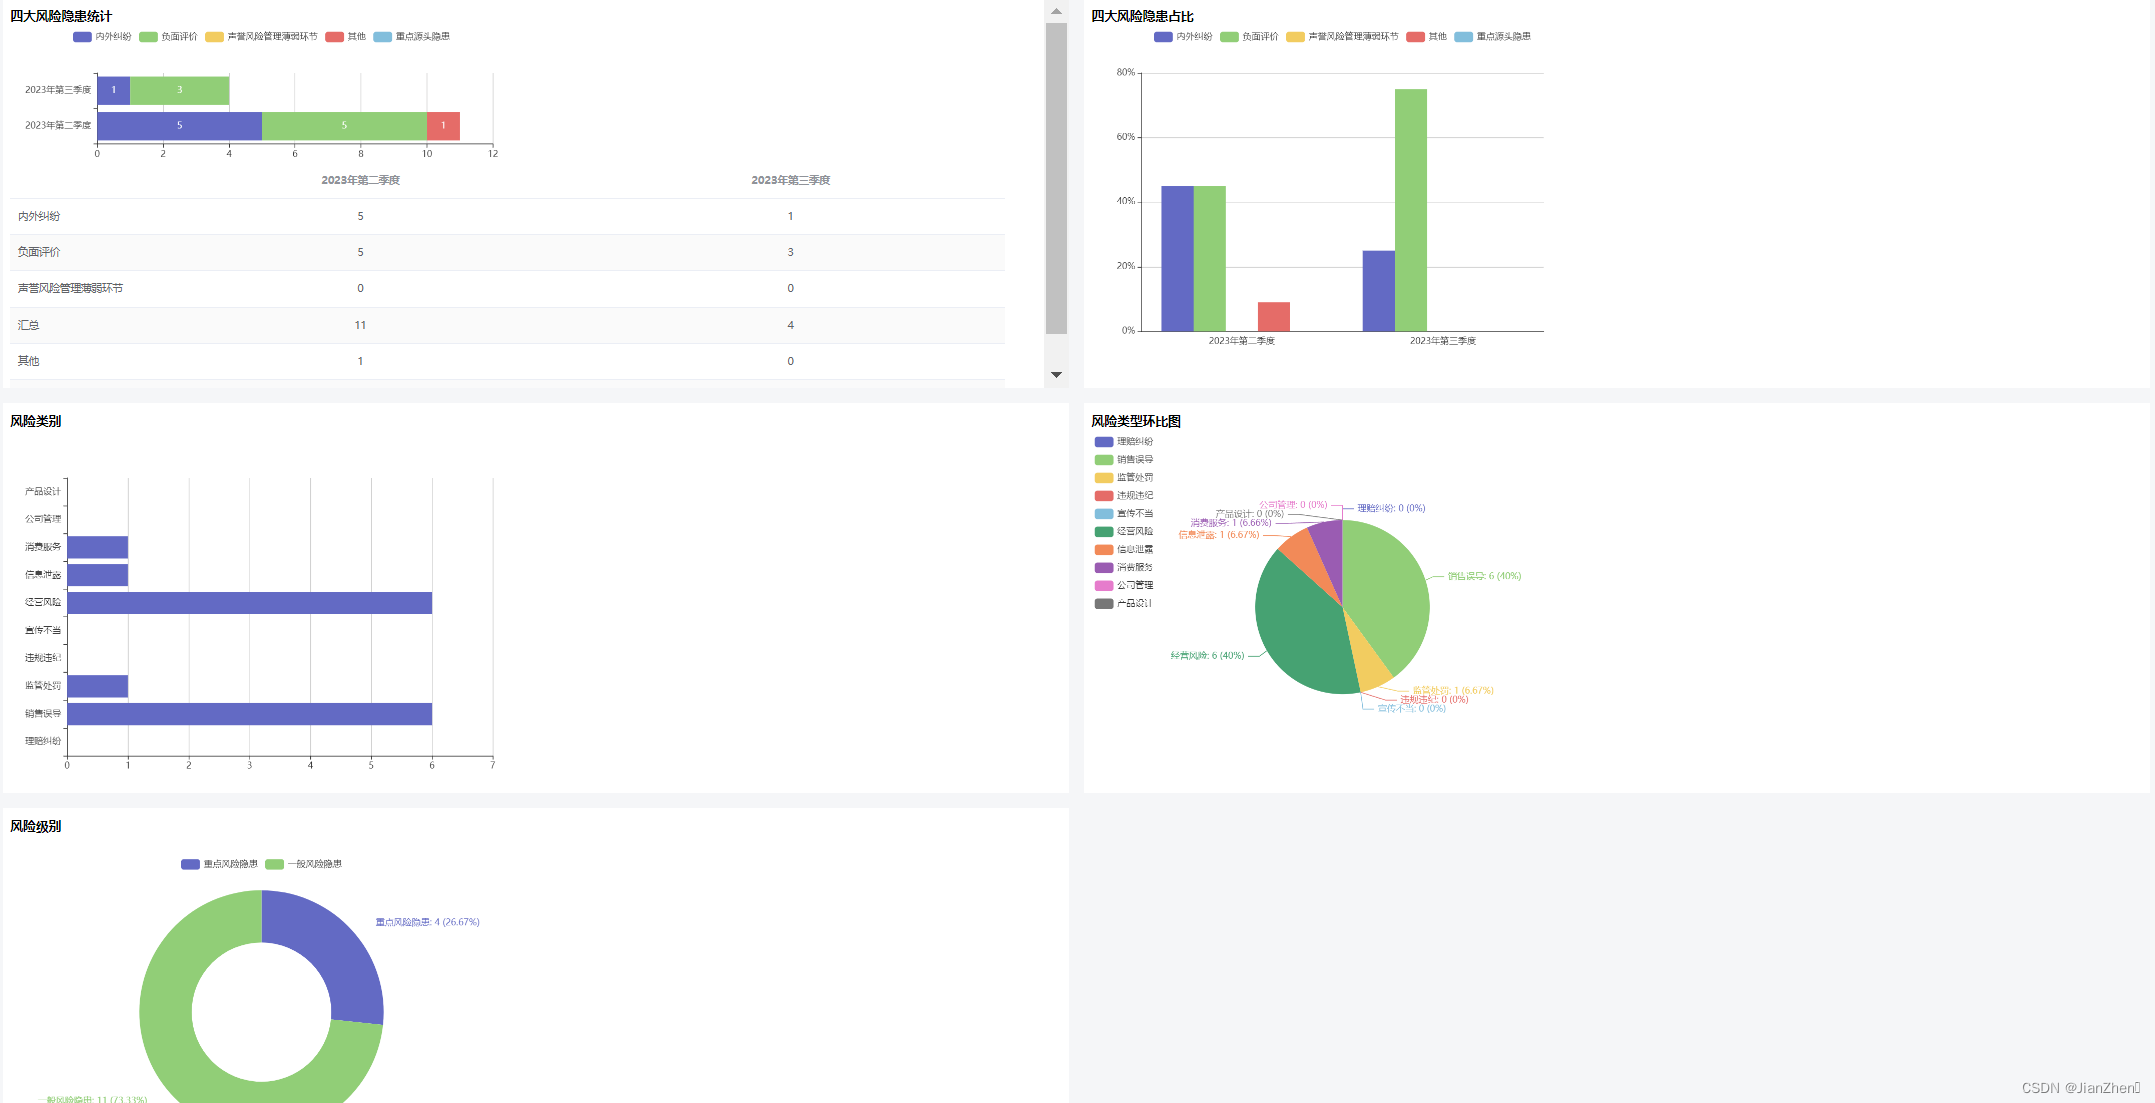
<h4>四大风险隐患统计</h4>
<div v-show="chart1AndChart2Data" class="chart1" id="chart1"></div>
<div v-show="!chart1AndChart2Data" class="chart1">
<p class="empty-text">暂无数据</p>
</div>
<el-table
v-if="chart1AndChart2Data"
:data="tableData"
stripe
style="width: 97%"
>
<el-table-column prop="name" label="" width="180"> </el-table-column>
<el-table-column
v-for="(item, index) in Object.keys(chart1AndChart2Data)"
:key="index"
:prop="item"
:label="item"
align="center"
>
</el-table-column>
</el-table>
</div>
<div class="flex-content">
<h4>四大风险隐患占比</h4>
<div
v-show="chart1AndChart2Data"
class="common-style"
id="chart2"
></div>
<div v-show="!chart1AndChart2Data" class="common-style">
<p class="empty-text">暂无数据</p>
</div>
</div>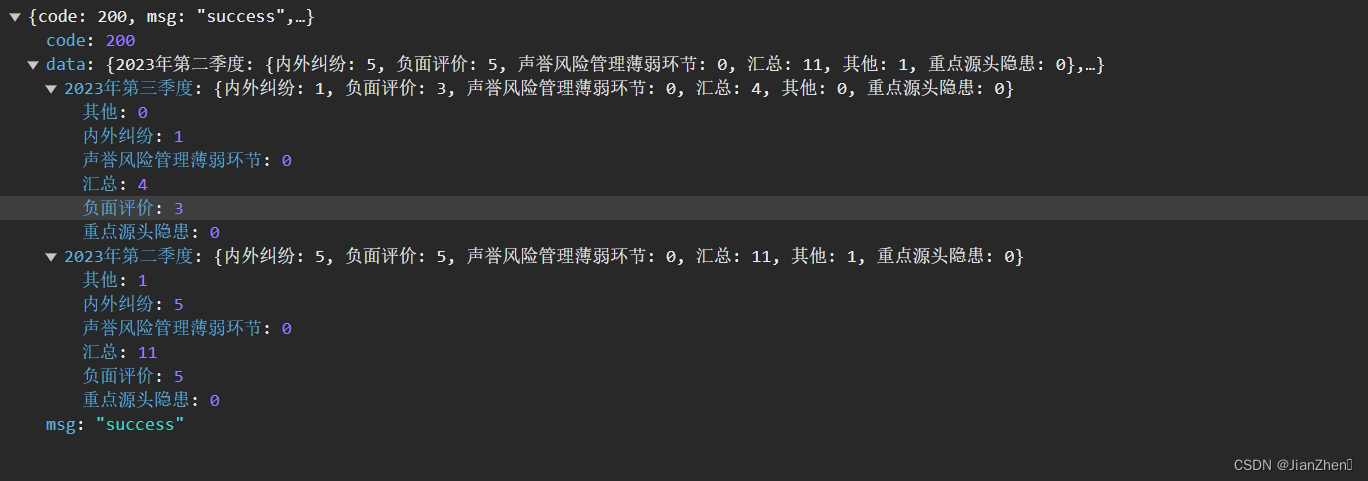
 //堆叠条形图
    enableChart1() {
      const entriesInfo = Object.entries(this.chart1AndChart2Data);
      const outKey = Object.keys(this.chart1AndChart2Data);
      const outPutValue = Object.values(this.chart1AndChart2Data);
      const key = Object.keys(outPutValue[0]);

      let disposeOverObject = {};
      outPutValue.forEach(e => {
        key.forEach(i => {
          disposeOverObject[i]
            ? disposeOverObject[i].push(e[i])
            : (disposeOverObject[i] = [e[i]]);
        });
      });
      let tableList = [];

      // 启用表格----重组数据格式
      key.forEach((e, index) => {
        tableList[index]
          ? (tableList[index].name = e)
          : (tableList[index] = { name: e });
        entriesInfo.forEach(i => {
          tableList[index][i[0]] = i[1][e];
        });
      });
      this.tableData = JSON.parse(JSON.stringify(tableList));
      var chartDom = document.getElementById("chart1");
      var myChart = echarts.init(chartDom, "shine");
      var option;

      option = {
        tooltip: {
          trigger: "axis",
          axisPointer: {
            // Use axis to trigger tooltip
            type: "shadow" // 'shadow' as default; can also be 'line' or 'shadow'
          }
        },
        legend: {},
        grid: {
          left: "3%",
          right: "4%",
          bottom: "3%",
          containLabel: true
        },
        xAxis: {
          type: "value"
        },
        yAxis: {
          type: "category",
          data: Object.keys(this.chart1AndChart2Data)
        },
        series: Object.entries(disposeOverObject)
          .map(e => {
            if (e[0] != "汇总") {
              return {
                name: e[0],
                type: "bar",
                stack: "total",
                label: {
                  show: true
                },
                emphasis: {
                  focus: "series"
                },
                data: e[1].map(i => {
                  if (i) return i;
                })
              };
            }
          })
          .filter(n => {
            if (n) {
              return n;
            }
          })
      };

      option && myChart.setOption(option);
      myChart.resize();
    },

    //柱状图标签旋转
    enableChart2() {
      const entriesInfo = Object.entries(this.chart1AndChart2Data);
      const outKey = Object.keys(this.chart1AndChart2Data);
      const outPutValue = Object.values(this.chart1AndChart2Data);
      const key = Object.keys(outPutValue[0]);
      let disposeOverObject = {};
      outPutValue.forEach(e => {
        key.forEach(i => {
          disposeOverObject[i]
            ? disposeOverObject[i].push(e[i])
            : (disposeOverObject[i] = [e[i]]);
        });
      });

      // 获取汇总数据
     const allNumList= Object.entries(disposeOverObject).map(e => {
        if(e[0] == "汇总")return e[1];
      }).filter(n => {
            if (n) {
              return n;
            }
          })[0];
      var app = {};

      var chartDom = document.getElementById("chart2");
      var myChart = echarts.init(chartDom, "shine");
      var option;

      const posList = [
        "left",
        "right",
        "top",
        "bottom",
        "inside",
        "insideTop",
        "insideLeft",
        "insideRight",
        "insideBottom",
        "insideTopLeft",
        "insideTopRight",
        "insideBottomLeft",
        "insideBottomRight"
      ];
      app.configParameters = {
        rotate: {
          min: -90,
          max: 90
        },
        align: {
          options: {
            left: "left",
            center: "center",
            right: "right"
          }
        },
        verticalAlign: {
          options: {
            top: "top",
            middle: "middle",
            bottom: "bottom"
          }
        },
        position: {
          options: posList.reduce(function(map, pos) {
            map[pos] = pos;
            return map;
          }, {})
        },
        distance: {
          min: 0,
          max: 100
        }
      };
      app.config = {
        rotate: 90,
        align: "left",
        verticalAlign: "middle",
        position: "insideBottom",
        distance: 15,
        onChange: function() {
          const labelOption = {
            rotate: app.config.rotate,
            align: app.config.align,
            verticalAlign: app.config.verticalAlign,
            position: app.config.position,
            distance: app.config.distance
          };
          myChart.setOption({
            series: [
              {
                label: labelOption
              },
              {
                label: labelOption
              },
              {
                label: labelOption
              },
              {
                label: labelOption
              }
            ]
          });
        }
      };
      const labelOption = {
        show: false,
        position: app.config.position,
        distance: app.config.distance,
        align: app.config.align,
        verticalAlign: app.config.verticalAlign,
        rotate: app.config.rotate,
        formatter: "{c}  {name|{a}}",
        fontSize: 16,
        rich: {
          name: {}
        }
      };
      option = {
        tooltip: {
          trigger: "axis",
          axisPointer: {
            type: "shadow"
          }
        },
        legend: {
          data: key
        },
        toolbox: {
          show: false,
          orient: "vertical",
          left: "right",
          top: "center",
          feature: {
            mark: { show: true },
            dataView: { show: true, readOnly: false },
            magicType: { show: true, type: ["line", "bar", "stack"] },
            restore: { show: true },
            saveAsImage: { show: true }
          }
        },
        xAxis: [
          {
            type: "category",
            axisTick: { show: false },
            data: outKey
          }
        ],
        yAxis: [
          {
            type: "value",
        axisLabel:{
            //函数模板
            formatter:function (value, index) {

                return value+'%';
            }}

          }
        ],
        series: Object.entries(disposeOverObject)
          .map(e => {
            if (e[0] != "汇总") {
              return {
                name: e[0],
                type: "bar",
                barGap: 0,
                label: labelOption,
                emphasis: {
                  focus: "series"
                },
                data: e[1].map((z,index)=>(z/allNumList[index]).toFixed(2)*100)
              };
            }
          })
          .filter(n => {
            if (n) {
              return n;
            }
          })
      };

      option && myChart.setOption(option);
    }
3个图表共用一个一个接口,前端进行数据处理,绕来绕去。
遇到的问题
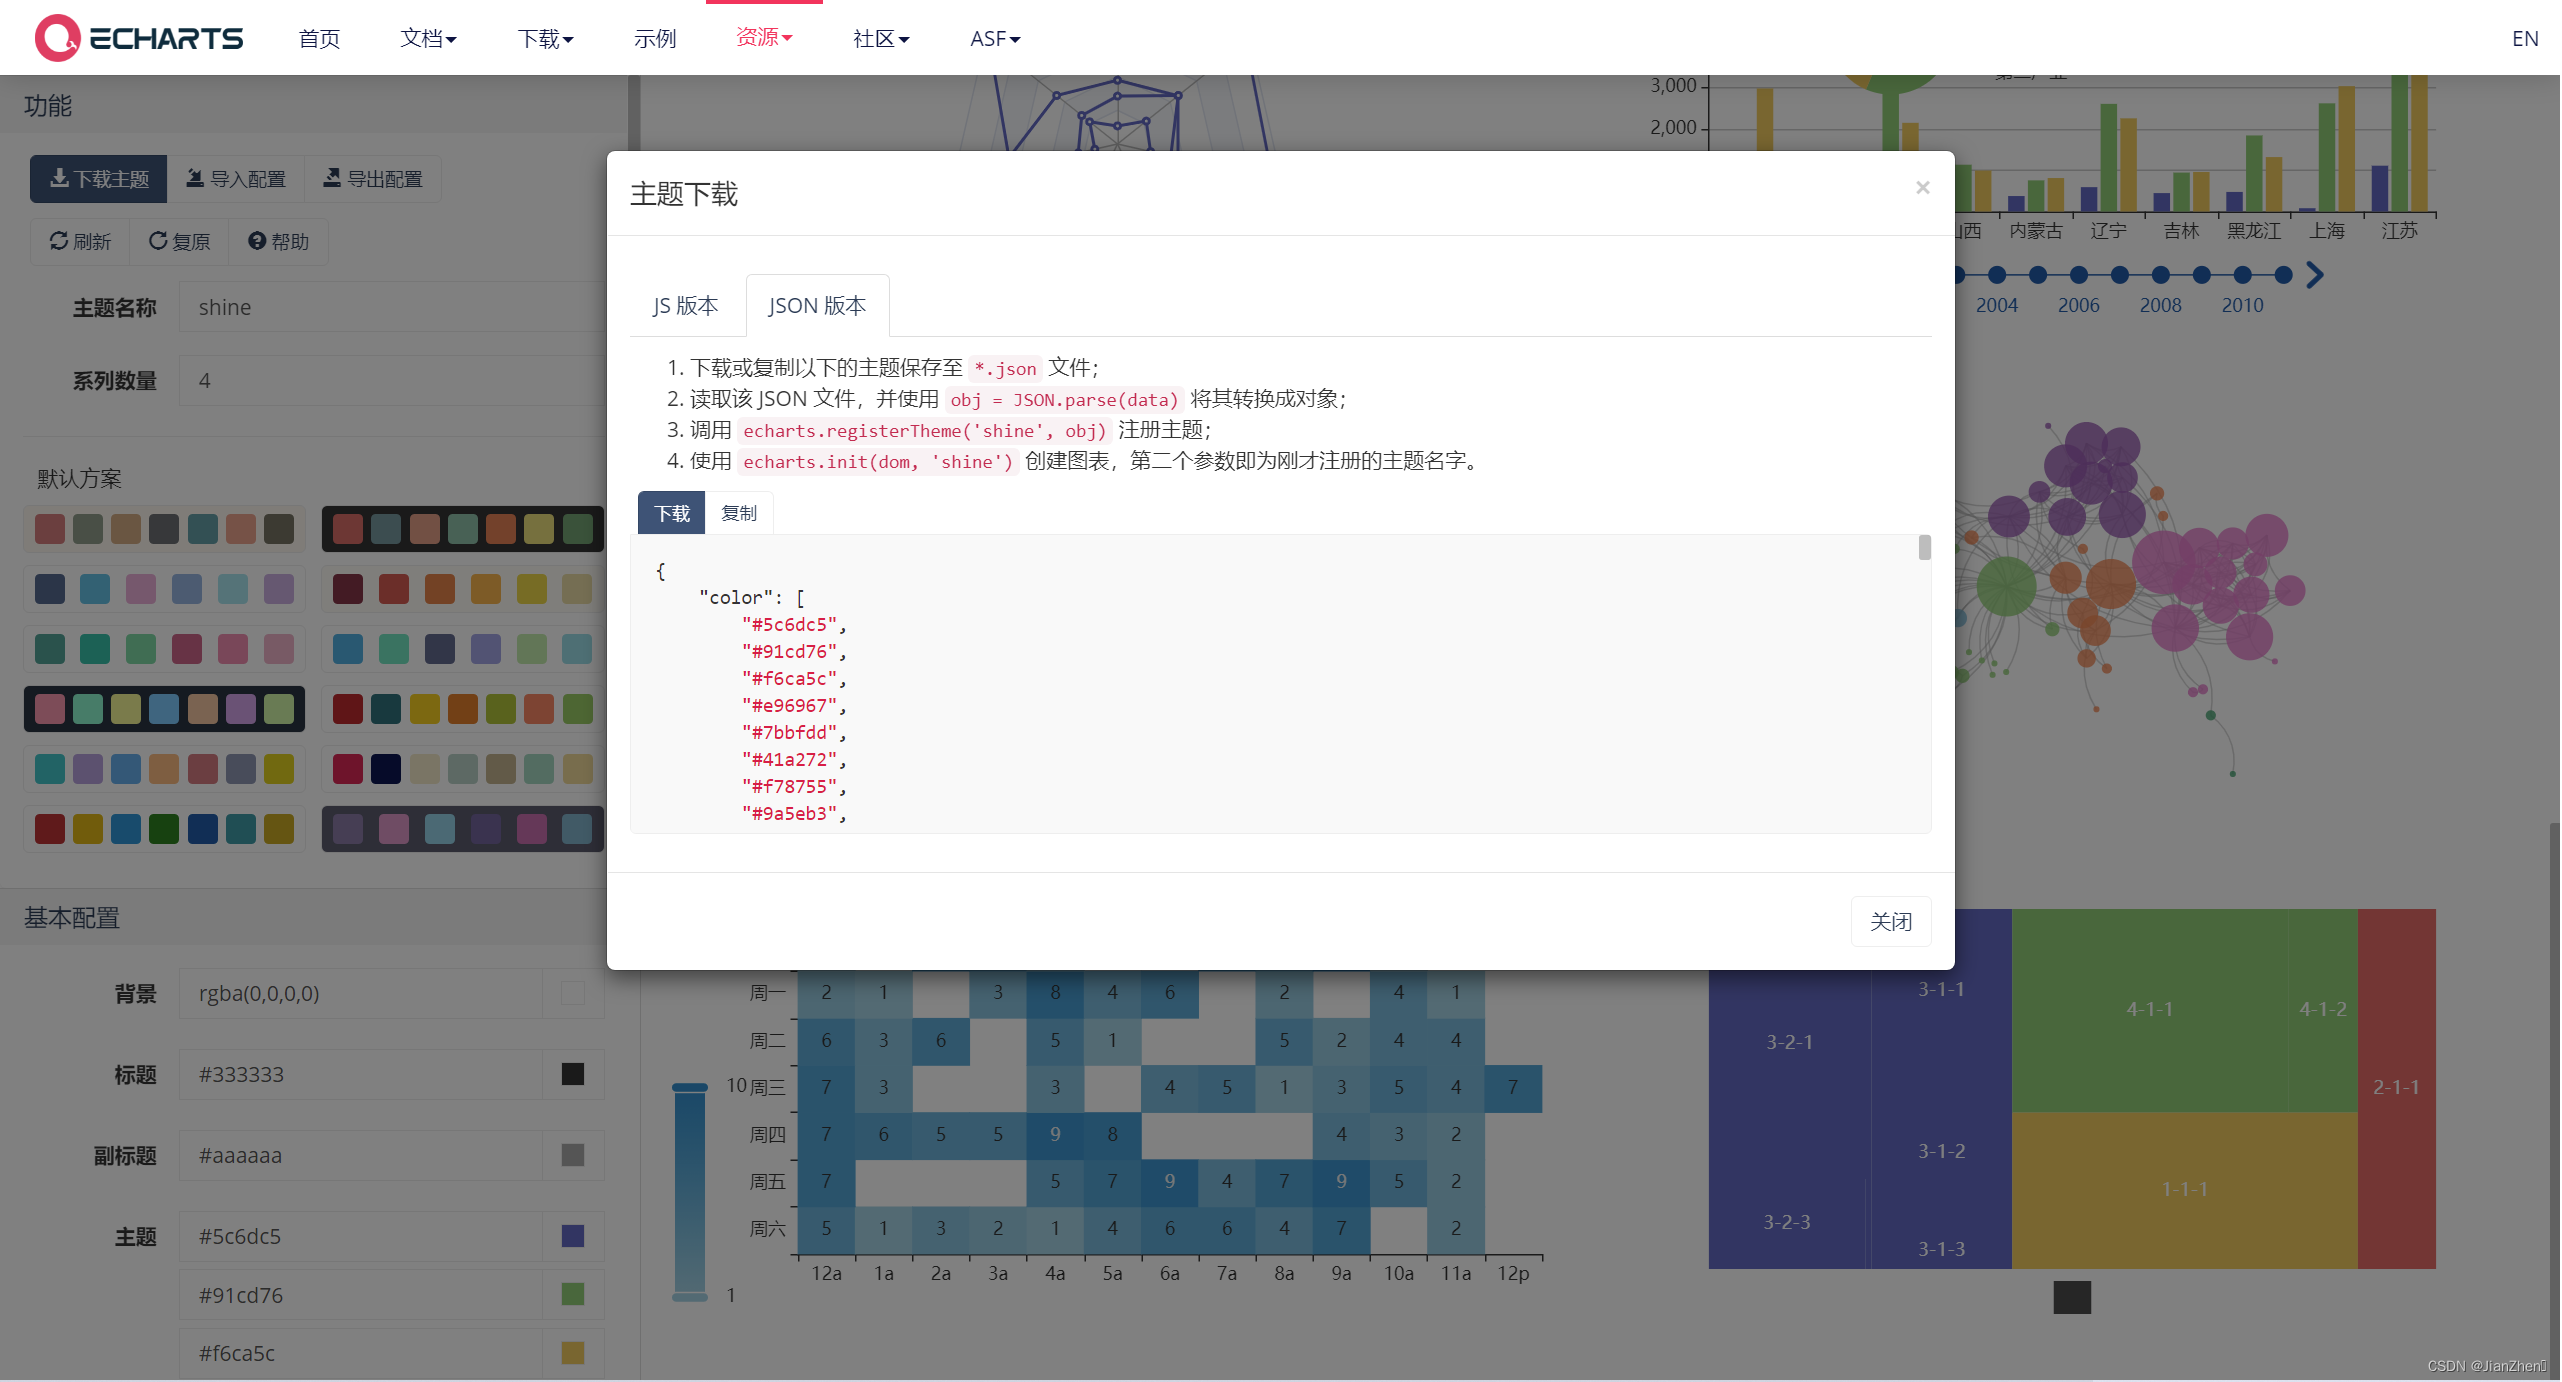
更换echart主题
echarts换主题颜色(在vue中使用)_51CTO博客_vue中使用echarts
如果需要自定义主题(主题下载 - Apache ECharts),建议去下载snipaste这个软件,可以吸色、截图、贴图等操作,方便我们结合UI图自定义主题
Y轴数字后添加百分比号
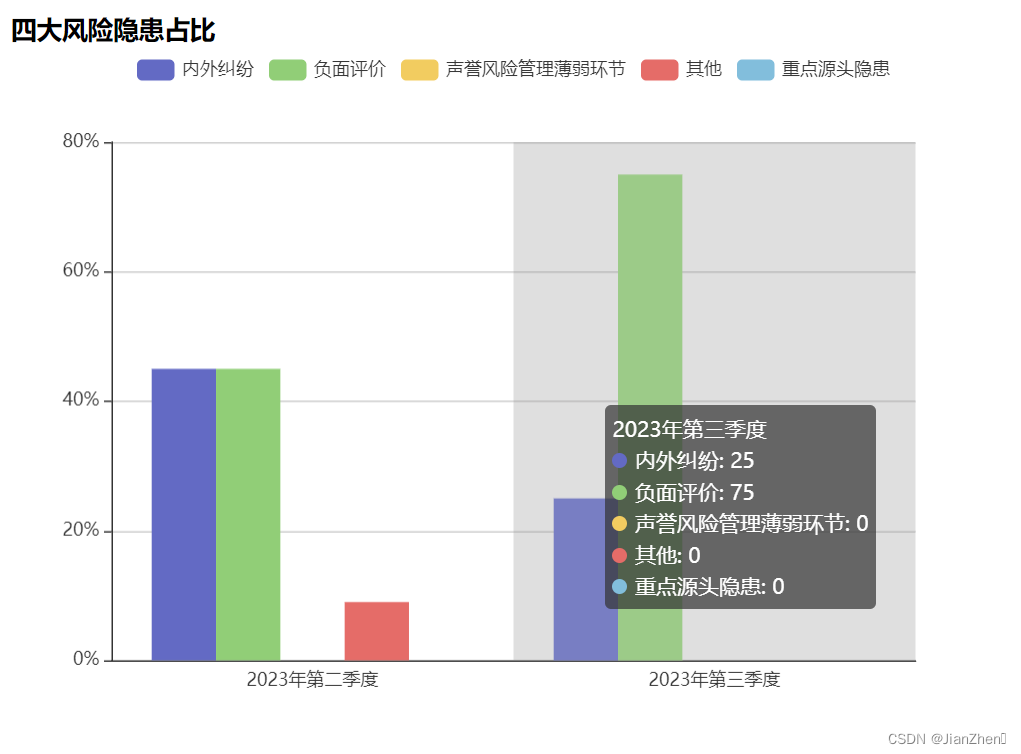
ECharts 使用yAxis.axisLabel.formatter自定义Y轴刻度标签--两种方法(字符串模板和函数模板)_echarts y轴刻度自定义-CSDN博客
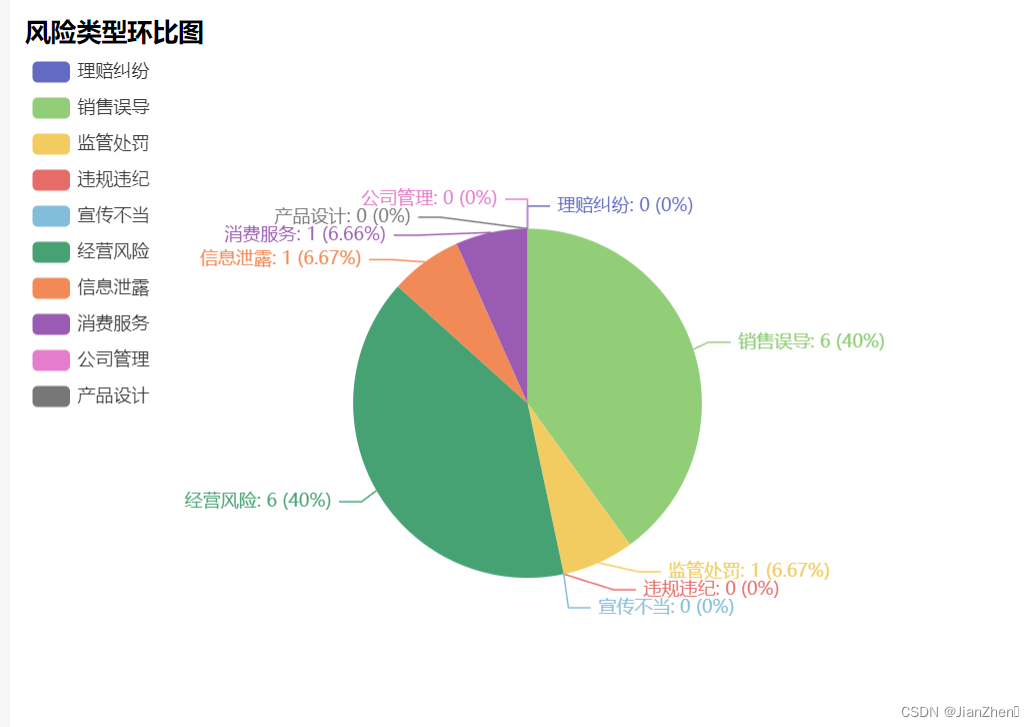
eCharts饼图显示百分比
ECharts 使用yAxis.axisLabel.formatter自定义Y轴刻度标签--两种方法(字符串模板和函数模板)_echarts y轴刻度自定义-CSDN博客
echarts自定义主题的手把手教学
注意:接下来是我对echarts主题覆盖的手把手教学(vue)
查看UI图
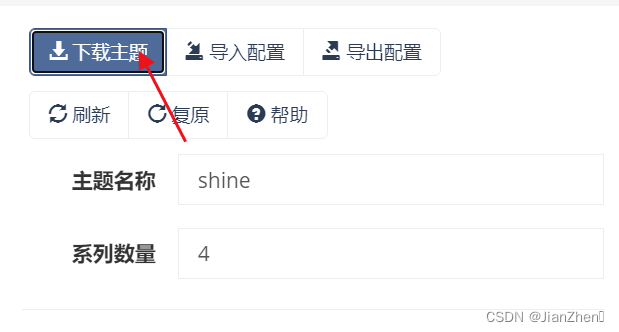
点击下方链接页面的定制主题按钮

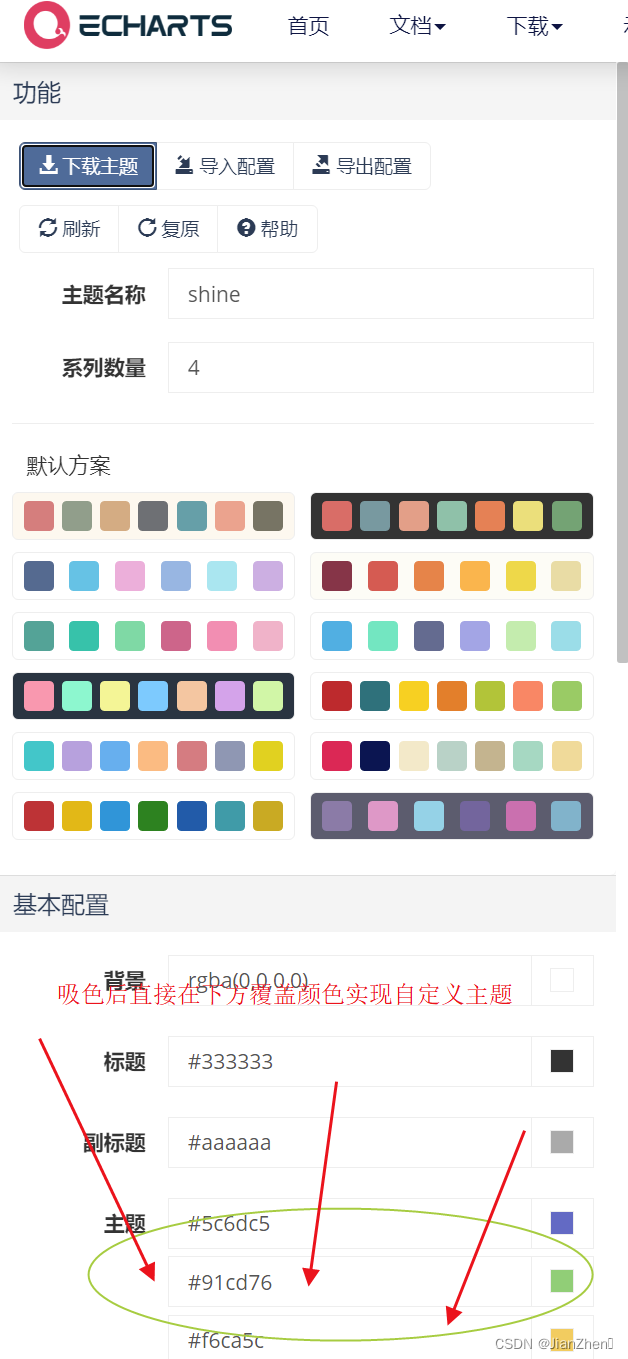
点击下载主题
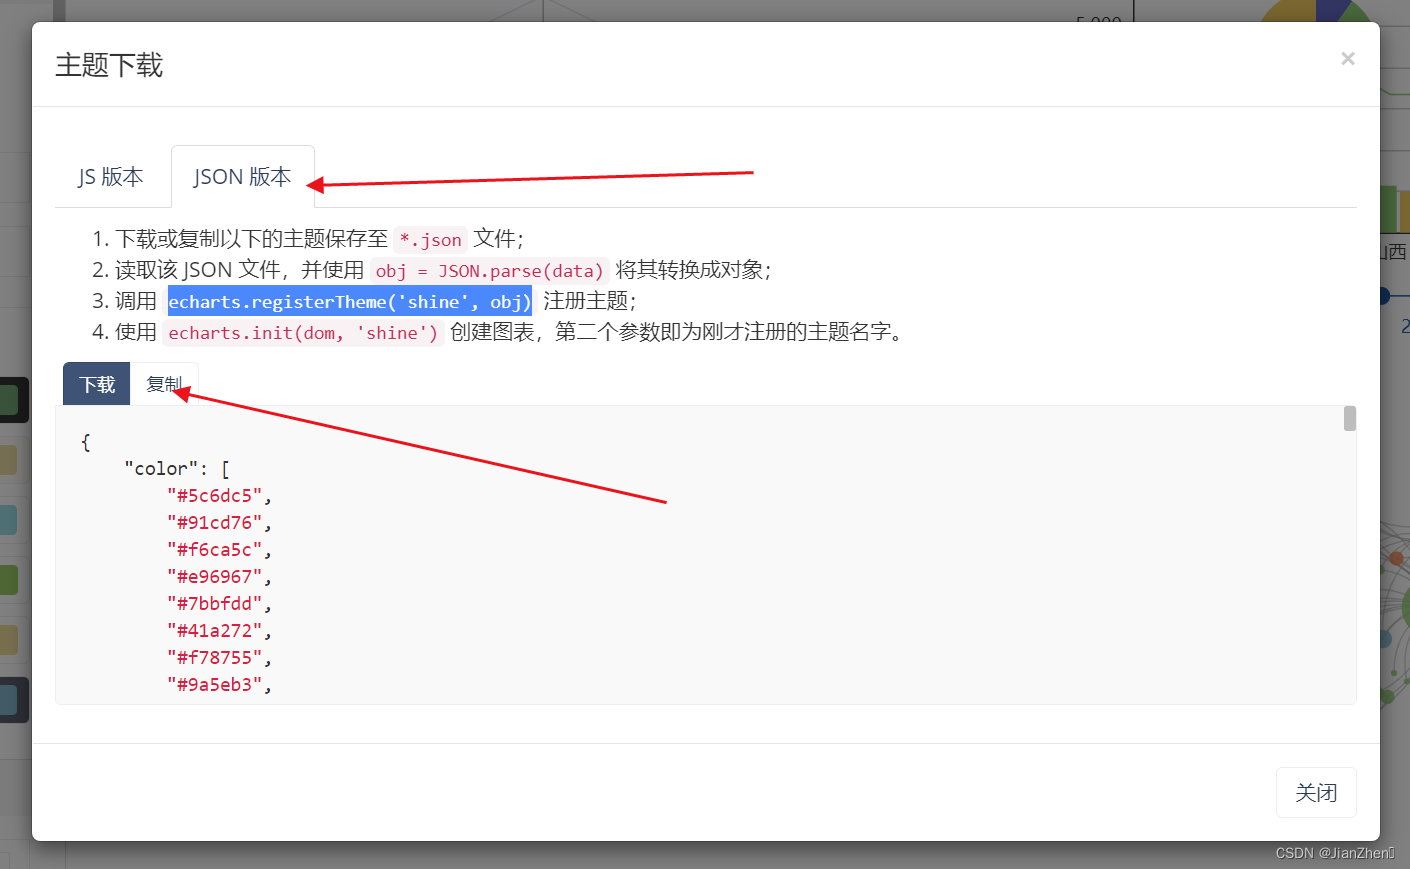
点击主题下载的JSON版本,点击复制
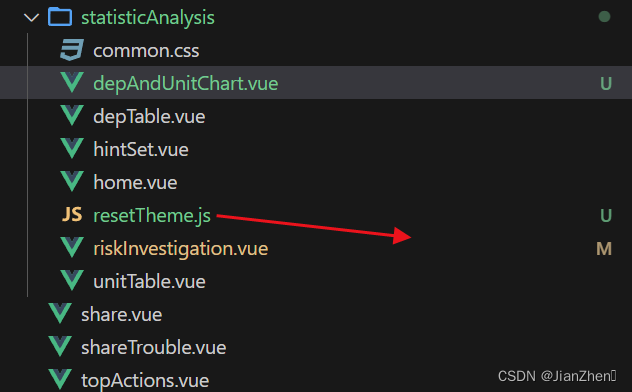
 新建js文件,把复制的内容放进去,注意要使用export default 复制的JSON内容
在相关页面的script标签里引入使用
import resetTheme from './resetTheme.js';
在mounted里设置该主题,可以自定义主题名
  mounted() {
    echarts.registerTheme('guoshou', resetTheme)
  },
在echart图表挂载时通过参数注入
  var chartDom = document.getElementById("chart1");
      var myChart = echarts.init(chartDom, 'guoshou');
      var option;
//...............
最终效果:
echarts地图展示
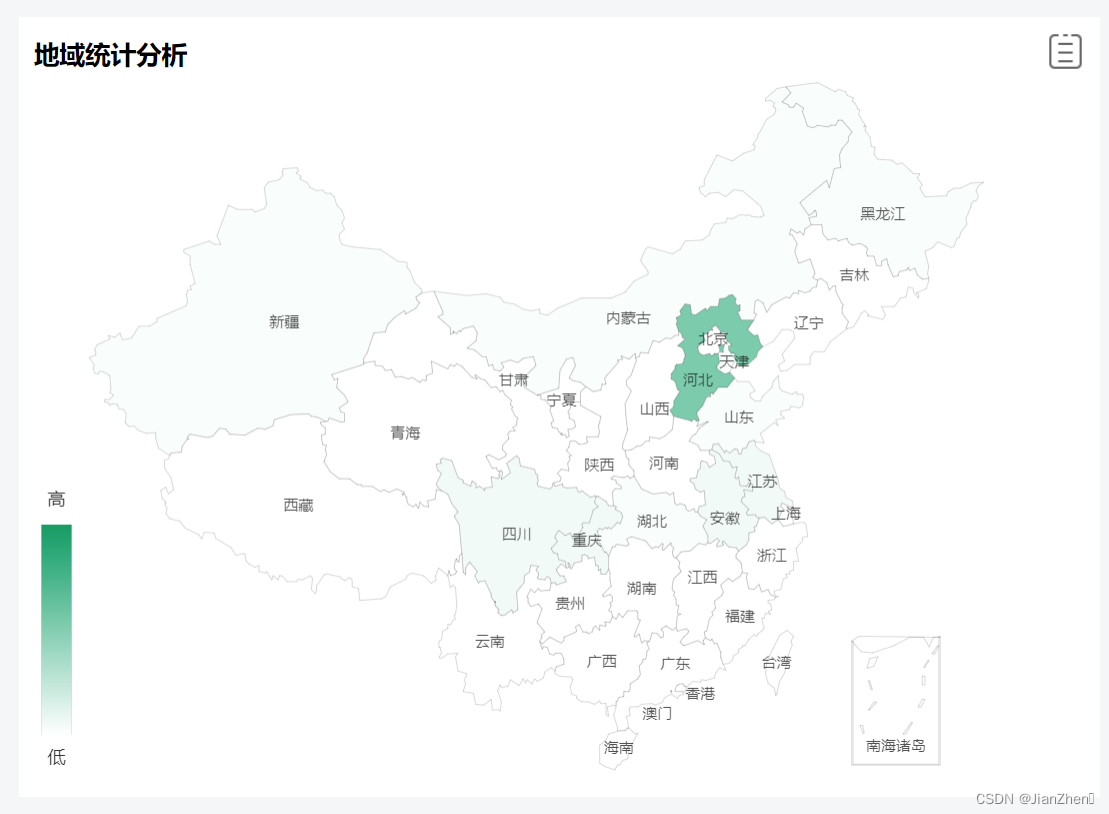
echart官网找不到合适的地图?
结合下方两个文章可以实现展示中国地图
【echarts 中国地图】vue实现中国地图,省份居中china.json文件下载_以中国为中心的世界地图json文件_接口写好了吗的博客-CSDN博客
最终效果
全部代码
<template>
<div>
<div class="flex-box">
<div class="flex-content">
<h4>
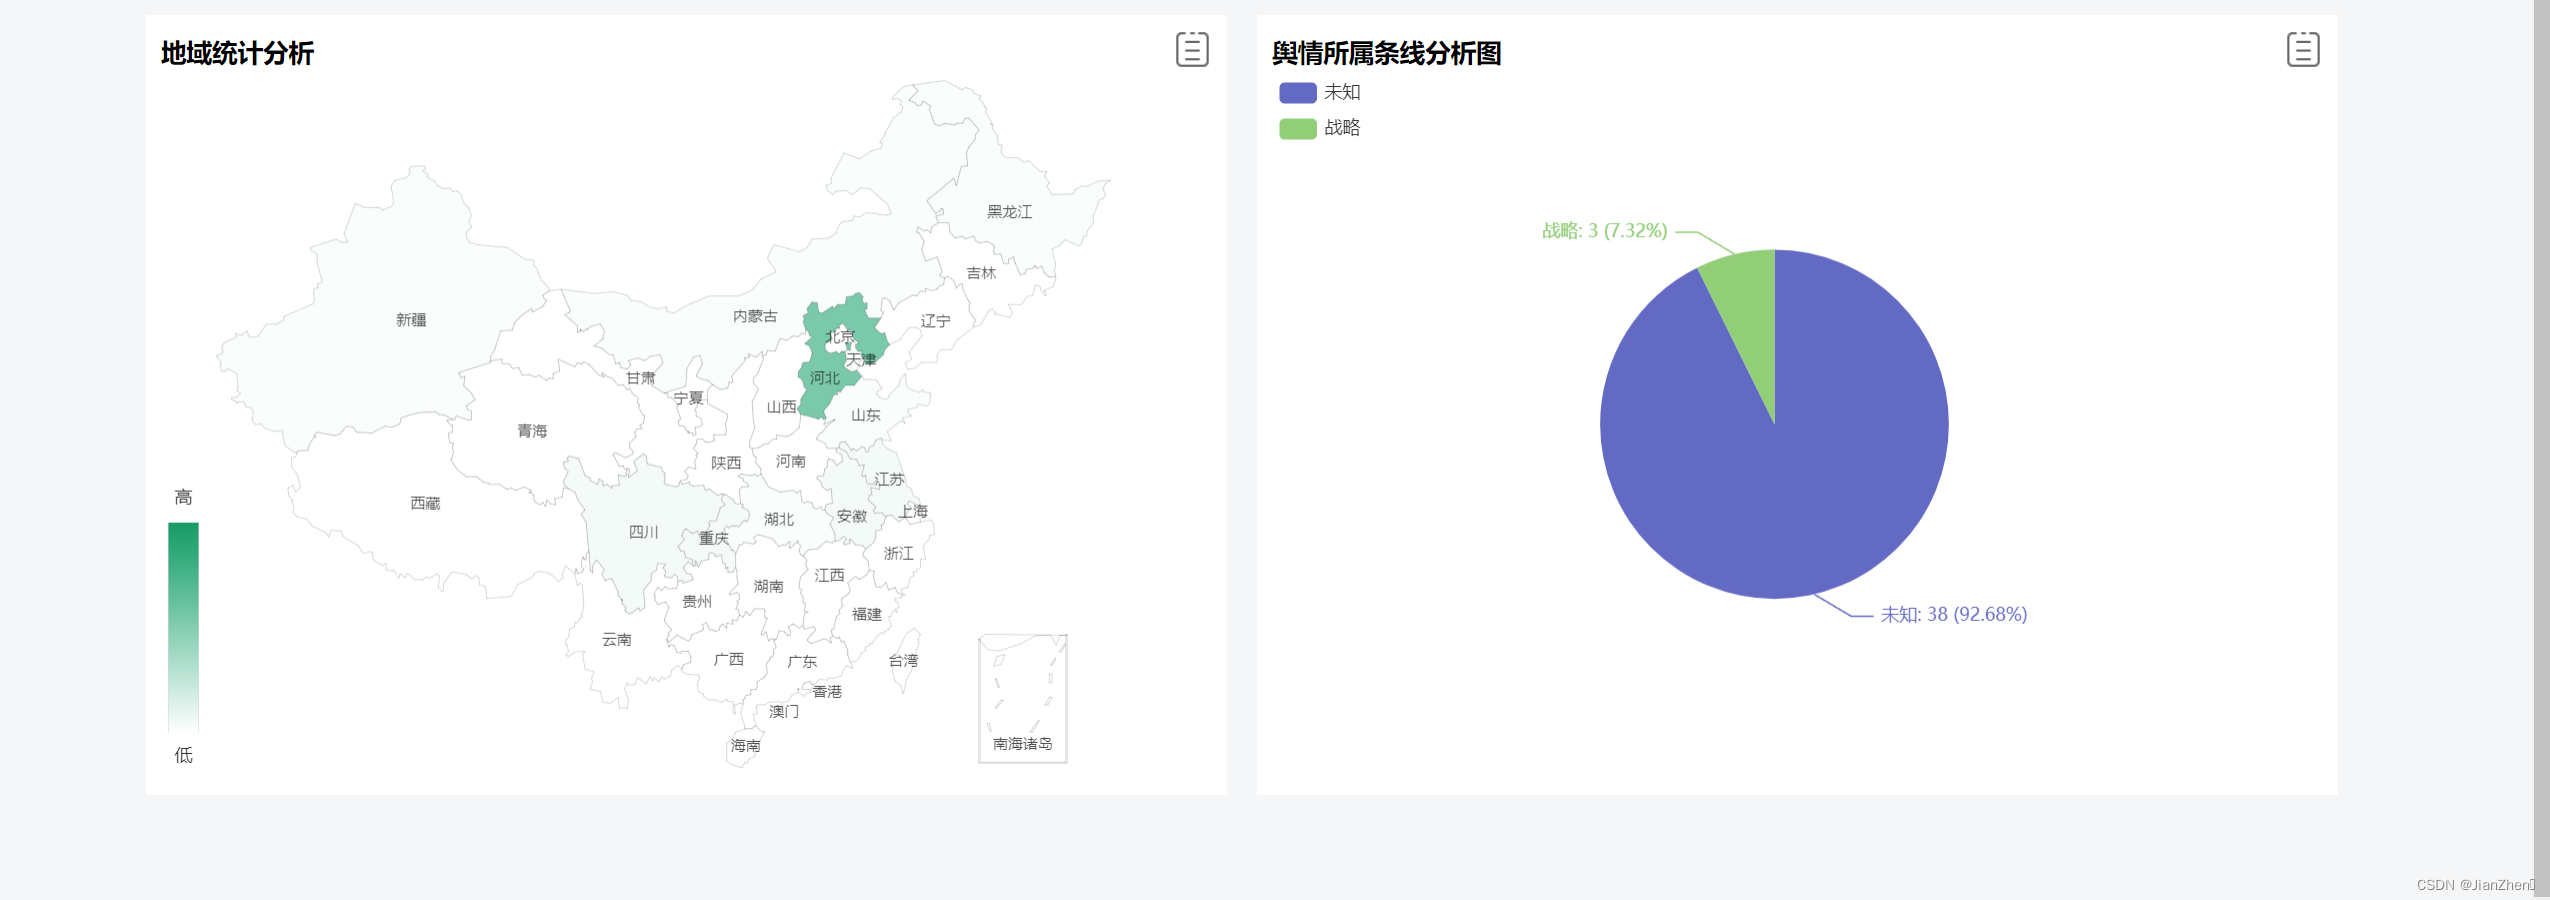
地域统计分析
<span
v-if="chart1Data"
:class="chart1DataTableStatus ? 'clickStyle' : ''"
@click="chart1DataTableStatus = !chart1DataTableStatus"
></span>
<div v-if="chart1DataTableStatus">
<el-table :data="tableData1" stripe style="width: 250px">
<el-table-column
prop="fullName"
label="地域"
width="80"
align="center"
>
</el-table-column>
<el-table-column
prop="allSum"
label="舆情总量"
width="80"
align="center"
>
</el-table-column>
<el-table-column
prop="allSumOdds"
label="办结率"
width="80"
align="center"
>
</el-table-column>
</el-table>
</div>
</h4>
<div v-show="chart1Data" class="common-style" id="chart1"></div>
<div v-show="!chart1Data" class="common-style">
<p class="empty-text">暂无数据</p>
</div>
</div>
<div class="flex-content">
<h4>
舆情所属条线分析图
<span
v-if="chart2Data"
:class="chart2DataTableStatus ? 'clickStyle' : ''"
@click="chart2DataTableStatus = !chart2DataTableStatus"
></span>
<div v-if="chart2DataTableStatus">
<el-table :data="tableData2" stripe style="width: 250px">
<el-table-column
prop="fullName"
label="条线"
width="125"
align="center"
>
</el-table-column>
<el-table-column
prop="allSum"
label="舆情总量"
width="125"
align="center"
>
</el-table-column>
</el-table>
</div>
</h4>
<div v-show="chart2Data" class="common-style" id="chart2"></div>
<div v-show="!chart2Data" class="common-style">
<p class="empty-text">暂无数据</p>
</div>
</div>
</div>
</div>
</template>
<script>
import * as echarts from "echarts";
import resetTheme from "./resetTheme.js";
import geoJson from "./china.json";
echarts.registerMap("china", geoJson);
export default {
props: {
createTime: {
type: String,
required: true
}
},
data() {
return {
chart1DataTableStatus: false,
chart1Data: "",
tableData1: [],
tableData2: [],
chart2Data: "",
chart2DataTableStatus: false
};
},
created() {
this.reloadPage();
},
mounted() {
echarts.registerTheme("guoshou", resetTheme);
},
methods: {
enableChart1() {
this.chart1Data.addressList = [
...this.chart1Data.addressList,
{ fullName: "南海诸岛", allSum: 0,allSumOdds:'0%' }
];
this.chart1Data.addressList = this.chart1Data.addressList.filter(
a => a.fullName != "全国"
);
// 启用表格----重组数据格式
this.tableData1 = this.chart1Data.addressList.map(e => {
return {
fullName: e.fullName,
allSum: e.allSum,
allSumOdds: e.allOfficeRate
};
});
var myChart = echarts.init(document.getElementById("chart1"));
let option = {
tooltip: {
// params.seriesName+'<br />'+
formatter: function(params, ticket, callback) {
return params.name + ":" + params.value;
} //数据格式化
},
visualMap: {
min: 0,
max: this.chart1Data.sum, //总量
left: "left",
top: "bottom",
text: ["高", "低"], //取值范围的文字
inRange: {
color: ["#fff", "#009b63"] //取值范围的颜色
},
show: true //图注
},
geo: {
map: "china",
roam: false, //不开启缩放和平移
zoom: 1.23, //视角缩放比例
label: {
normal: {
show: true,
fontSize: "10",
color: "rgba(0,0,0,0.7)"
}
},
itemStyle: {
normal: {
borderColor: "rgba(0, 0, 0, 0.2)"
},
emphasis: {
areaColor: "#62c09d", //鼠标选择区域颜色
shadowOffsetX: 0,
shadowOffsetY: 0,
shadowBlur: 20,
borderWidth: 0,
shadowColor: "rgba(0, 0, 0, 0.5)"
}
}
},
series: [
{
name: "信息量",
type: "map",
geoIndex: 0,
//注意查看接口返回数据,不要只返回有数据的省,没数据数值是0也要返,不然展示会出现NAN,必要时前端出手赋值吧
//接口返回省和区的名字不能是全称,要用简称,比如新疆维吾尔自治区=》新疆
data: this.chart1Data.addressList.map(a => {
return { name: a.fullName, value: a.allSum };
})
}
]
};
myChart.setOption(option);
myChart.resize();
},
async getAllData() {
const query = {
createTime: this.$props.createTime,
order: "asc",
orderBy: "create_time"
};
await this.getChart1AndChart2Data(query);
},
setAllChart() {
this.$nextTick(function() {
if (this.chart1Data) {
this.enableChart1();
}
if (this.chart2Data) {
this.enableChart2();
}
});
},
async reloadPage() {
const loading = this.$loading({
lock: true,
text: "加载中,请稍候",
spinner: "el-icon-loading",
background: "rgba(0, 0, 0, 0.7)"
});
try {
await this.getAllData();
this.setAllChart();
} catch (error) {
this.$message.warning(error || "数据加载出错");
} finally {
loading.close();
}
},
async getChart1AndChart2Data(query) {
await this.$http({
method: "POST",
url: "/cbrc/work/statistics/tableHint",
data: query
}).then(res => {
if (res && res.data) {
if (!!res.data.data && JSON.stringify(res.data.data) != "{}") {
if (res.data.data.address) {
this.chart1Data = JSON.parse(
JSON.stringify(res.data.data.address)
);
} else {
this.chart1Data = "";
}
if (res.data.data.depLine) {
this.chart2Data = JSON.parse(
JSON.stringify(res.data.data.depLine)
);
} else {
this.chart2Data = "";
}
}
}
});
},
// 饼图
enableChart2() {
// 启用表格----重组数据格式
this.tableData2 = this.chart2Data.depLineList.map(e => {
return {
fullName: e.fullName || "未知",
allSum: e.allSum
};
});
var chartDom = document.getElementById("chart2");
var myChart = echarts.init(chartDom, "guoshou");
var option;
option = {
// title: {
// text: "Referer of a Website",
// subtext: "Fake Data",
// left: "center"
// },
tooltip: {
trigger: "item"
},
legend: {
orient: "vertical",
left: "left"
},
series: [
{
name: "",
type: "pie",
radius: "50%",
//百分比
label: {
normal: {
show: true,
formatter: "{b}: {c} ({d}%)" //自定义显示格式(b:name, c:value, d:百分比)
}
},
data: this.chart2Data.depLineList.map(e => {
return { name: e.fullName || "未知", value: e.allSum };
}),
emphasis: {
itemStyle: {
shadowBlur: 10,
shadowOffsetX: 0,
shadowColor: "rgba(0, 0, 0, 0.5)"
}
}
}
]
};
option && myChart.setOption(option);
myChart.resize();
}
},
watch: {
createTime: function() {
this.reloadPage();
},
}
};
</script>
<style scoped>
.flex-box >>> .el-table thead tr th {
background: var(--mainColor);
color: #fff;
}
</style>
<style lang="less" scoped>
.flex-box {
display: flex;
flex-wrap: wrap;
gap: 20px;
width: 100%;
height: 100%;
}
.flex-content {
width: 47%;
height: 500px;
padding: 10px;
background: #fff;
overflow-y: auto;
h4 {
position: relative;
font-size: 17px;
line-height: 30px;
span {
width: 26px;
height: 26px;
cursor: pointer;
float: right;
background: url(~@images/disposalDoc.png) no-repeat;
background-size: 26px 26px;
}
.clickStyle {
background: url(~@images/disposalDoc-hover.png) no-repeat;
background-size: 26px 26px;
}
div {
position: absolute;
width: 250px;
height: 300px;
overflow-y: auto;
right: 0;
z-index: 10000;
}
}
}
.chart1 {
width: 670px;
height: 180px;
}
.common-style {
width: 670px;
height: 465px;
}
.empty-text {
color: var(--mainColor);
text-align: center;
line-height: 350px;
}
</style>
感谢支持


 1210
1210


 被折叠的 条评论
为什么被折叠?
被折叠的 条评论
为什么被折叠?
 到【灌水乐园】发言


