


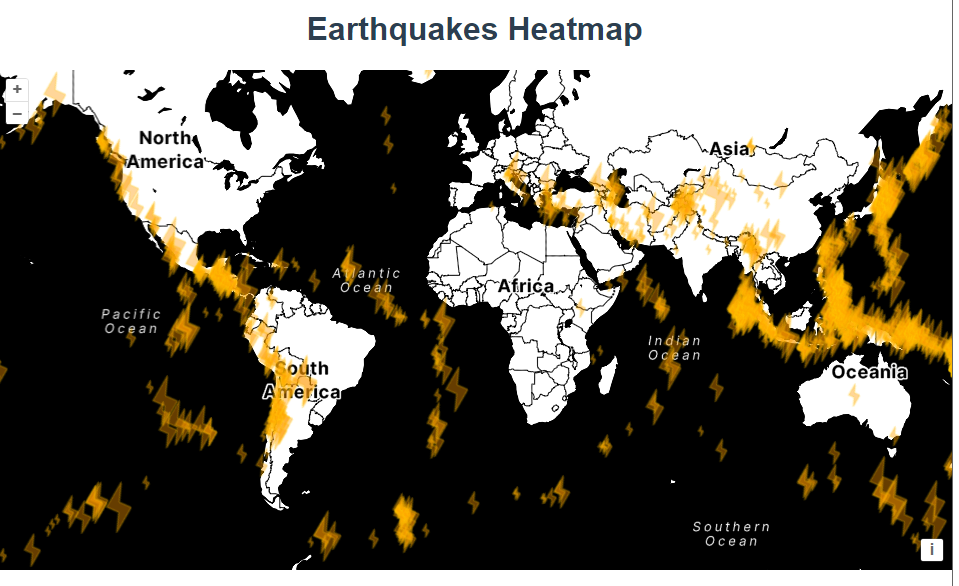
官网demo地址:
上一篇我们使用星星表示了地震数据,能绘制星星图形主要依靠 openlayers中的RegularShape类,那如果想要绘制自定义图形该怎么写呢,这篇提供了解决方案。
const vector = new VectorLayer({
      source: new VectorSource({
        url: "https://openlayers.org/en/latest/examples/data/kml/2012_Earthquakes_Mag5.kml",
        format: new KML({
          extractStyles: false,
        }),
      }),
      style: styleFunction,
    });
依然是通过样式函数styleFunction设置图形。
styleCache做了一个缓存,以免每次都要重新生成。
从feature中获取自定义属性地震等级大小name决定图形大小。
 const styleFunction = function (feature) {
      const name = feature.get("name");
      const magnitude = parseFloat(name.substr(2));
      const size = parseInt(10 + 40 * (magnitude - 5), 10);
      scale = size / 10;
      let style = styleCache[size];
      if (!style) {

        styleCache[size] = style;
      }
      return style;
    };
symbol 是一个坐标数组,定义了一个多边形的形状。scaleFunction 根据当前的缩放比例 scale 对每个坐标进行缩放。
    const symbol = [
      [0, 0],
      [4, 2],
      [6, 0],
      [10, 5],
      [6, 3],
      [4, 5],
      [0, 0],
    ];
    let scale;
    const scaleFunction = function (coordinate) {
      return [coordinate[0] * scale, coordinate[1] * scale];
    };

    new Polygon([symbol.map(scaleFunction)])
修改后的某一个图形的坐标数组:
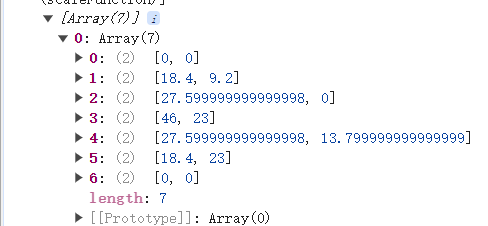
如果不修改会怎样?
如果使用缩放前的坐标,每个图形会是一样大的。
vectorContext.drawGeometry(new Polygon([symbol]));
在一个新的 HTML canvas 元素上绘制一个多边形,并使用这个 canvas 作为图标图像,然后创建一个样式对象。
const canvas = document.createElement("canvas");
        const vectorContext = toContext(canvas.getContext("2d"), {
          size: [size, size],
          pixelRatio: 1,
        });
        vectorContext.setStyle(
          new Style({
            fill: new Fill({ color: "rgba(255, 153, 0, 0.4)" }),
            stroke: new Stroke({ color: "rgba(255, 204, 0, 0.2)", width: 2 }),
          })
        );
        vectorContext.drawGeometry(new Polygon([symbol.map(scaleFunction)]));
        style = new Style({
          image: new Icon({
            img: canvas,
            rotation: 1.2,//设置图标的旋转角度为 1.2 弧度。
          }),
        });
toContext方法获取Canvas 的 2D 渲染上下文,使我们可以使用 OpenLayers 的矢量绘图功能在 Canvas 上绘制图形。比如setStyle、drawGeometry等方法。如果不使用toContext方法则需要使用原生canvas的方法绘制图形
var context2D = canvas.getContext("2d");
context2D.fillStyle = "rgba(255, 153, 0, 0.4)";
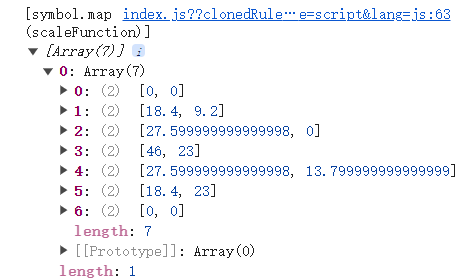
context2D.fillRect(0, 0, 50, 50);小细节:
[symbol.map(scaleFunction)]生成出来的坐标数组并不是每个图形相对于整个canvas画布的坐标数组。而是相对于每个feature生成的画布的坐标数组。也就是说这个图形的坐标数组和feature的坐标是不一样的。它是在每个feature上再绘制了一个图形。
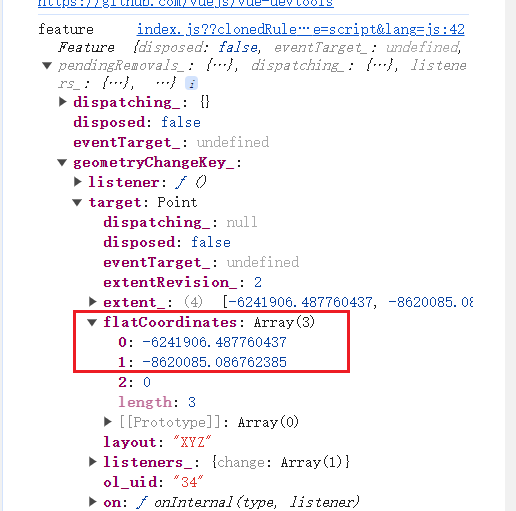
原本的feature是已经存在的只不过没有给样式所以显示不出来,这个数组源给的是点坐标,如果在这个函数里返回一个普通的圆圈的样式页面会是这样:
// 测试代码;
      style = new Style({
        image: new CircleStyle({
          radius: 20,
          fill: new Fill({
            color: "red",
          }),
        }),
      });
      return style;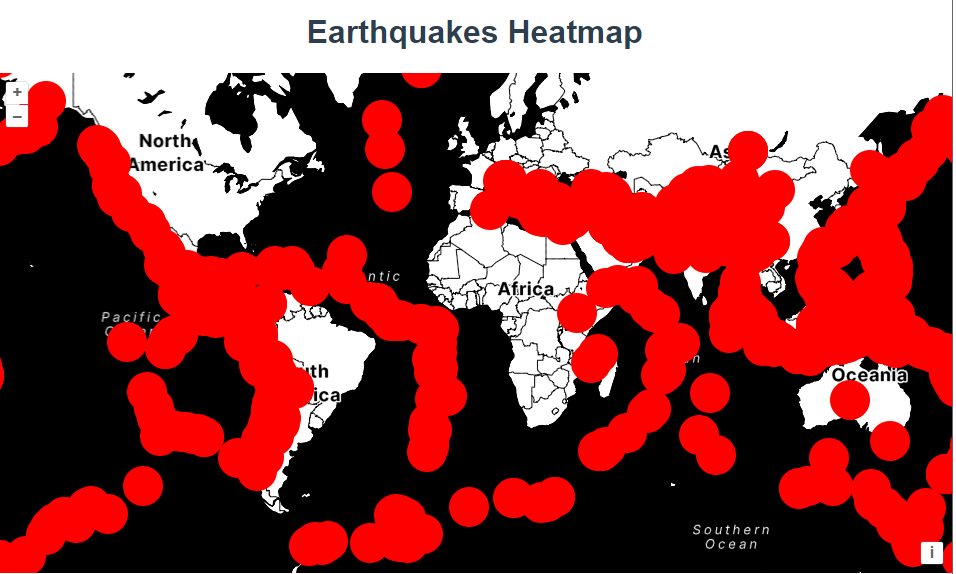
完整代码:
<template>
  <div class="box">
    <h1>Earthquakes Heatmap</h1>
    <div id="map"></div>
  </div>
</template>

<script>
import KML from "ol/format/KML.js";
import Map from "ol/Map.js";
import Polygon from "ol/geom/Polygon.js";
import StadiaMaps from "ol/source/StadiaMaps.js";
import VectorSource from "ol/source/Vector.js";
import View from "ol/View.js";
import { Fill, Icon, Stroke, Style, Circle as CircleStyle } from "ol/style.js";
import { Tile as TileLayer, Vector as VectorLayer } from "ol/layer.js";
import { toContext } from "ol/render.js";
export default {
  name: "",
  components: {},
  data() {
    return {
      map: null,
    };
  },
  computed: {},
  created() {},
  mounted() {
    const symbol = [
      [0, 0],
      [4, 2],
      [6, 0],
      [10, 5],
      [6, 3],
      [4, 5],
      [0, 0],
    ];
    let scale;
    const scaleFunction = function (coordinate) {
      return [coordinate[0] * scale, coordinate[1] * scale];
    };

    const styleCache = {};
    const styleFunction = function (feature) {
      const name = feature.get("name");
      const magnitude = parseFloat(name.substr(2));
      const size = parseInt(10 + 40 * (magnitude - 5), 10);
      scale = size / 10;
      let style = styleCache[size];
      if (!style) {
        const canvas = document.createElement("canvas");
        const vectorContext = toContext(canvas.getContext("2d"), {
          size: [size, size],
          pixelRatio: 1,
        });
        vectorContext.setStyle(
          new Style({
            fill: new Fill({ color: "rgba(255, 153, 0, 0.4)" }),
            stroke: new Stroke({ color: "rgba(255, 204, 0, 0.2)", width: 2 }),
          })
        );
        vectorContext.drawGeometry(new Polygon([symbol.map(scaleFunction)]));
        //测试代码
        // var context2D = canvas.getContext("2d");
        // context2D.fillStyle = "rgba(255, 153, 0, 0.4)";
        // context2D.fillRect(0, 0, 50, 50);
        style = new Style({
          image: new Icon({
            img: canvas,
            rotation: 1.2, //设置图标的旋转角度为 1.2 弧度。
          }),
        });
        styleCache[size] = style;
      }
      // 测试代码;
      //   style = new Style({
      //     image: new CircleStyle({
      //       radius: 20,
      //       fill: new Fill({
      //         color: "red",
      //       }),
      //     }),
      //   });
      return style;
    };

    const vector = new VectorLayer({
      source: new VectorSource({
        url: "https://openlayers.org/en/latest/examples/data/kml/2012_Earthquakes_Mag5.kml",
        format: new KML({
          extractStyles: false,
        }),
      }),
      style: styleFunction,
    });

    const raster = new TileLayer({
      source: new StadiaMaps({
        layer: "stamen_toner",
      }),
    });

    const map = new Map({
      layers: [raster, vector],
      target: "map",
      view: new View({
        center: [0, 0],
        zoom: 2,
      }),
    });
  },
  methods: {},
};
</script>

<style lang="scss" scoped>
#map {
  width: 100%;
  height: 500px;
}
.box {
  height: 100%;
}
</style>


 36
36

 被折叠的 条评论
为什么被折叠?
被折叠的 条评论
为什么被折叠?
 到【灌水乐园】发言


