官网demo地址:
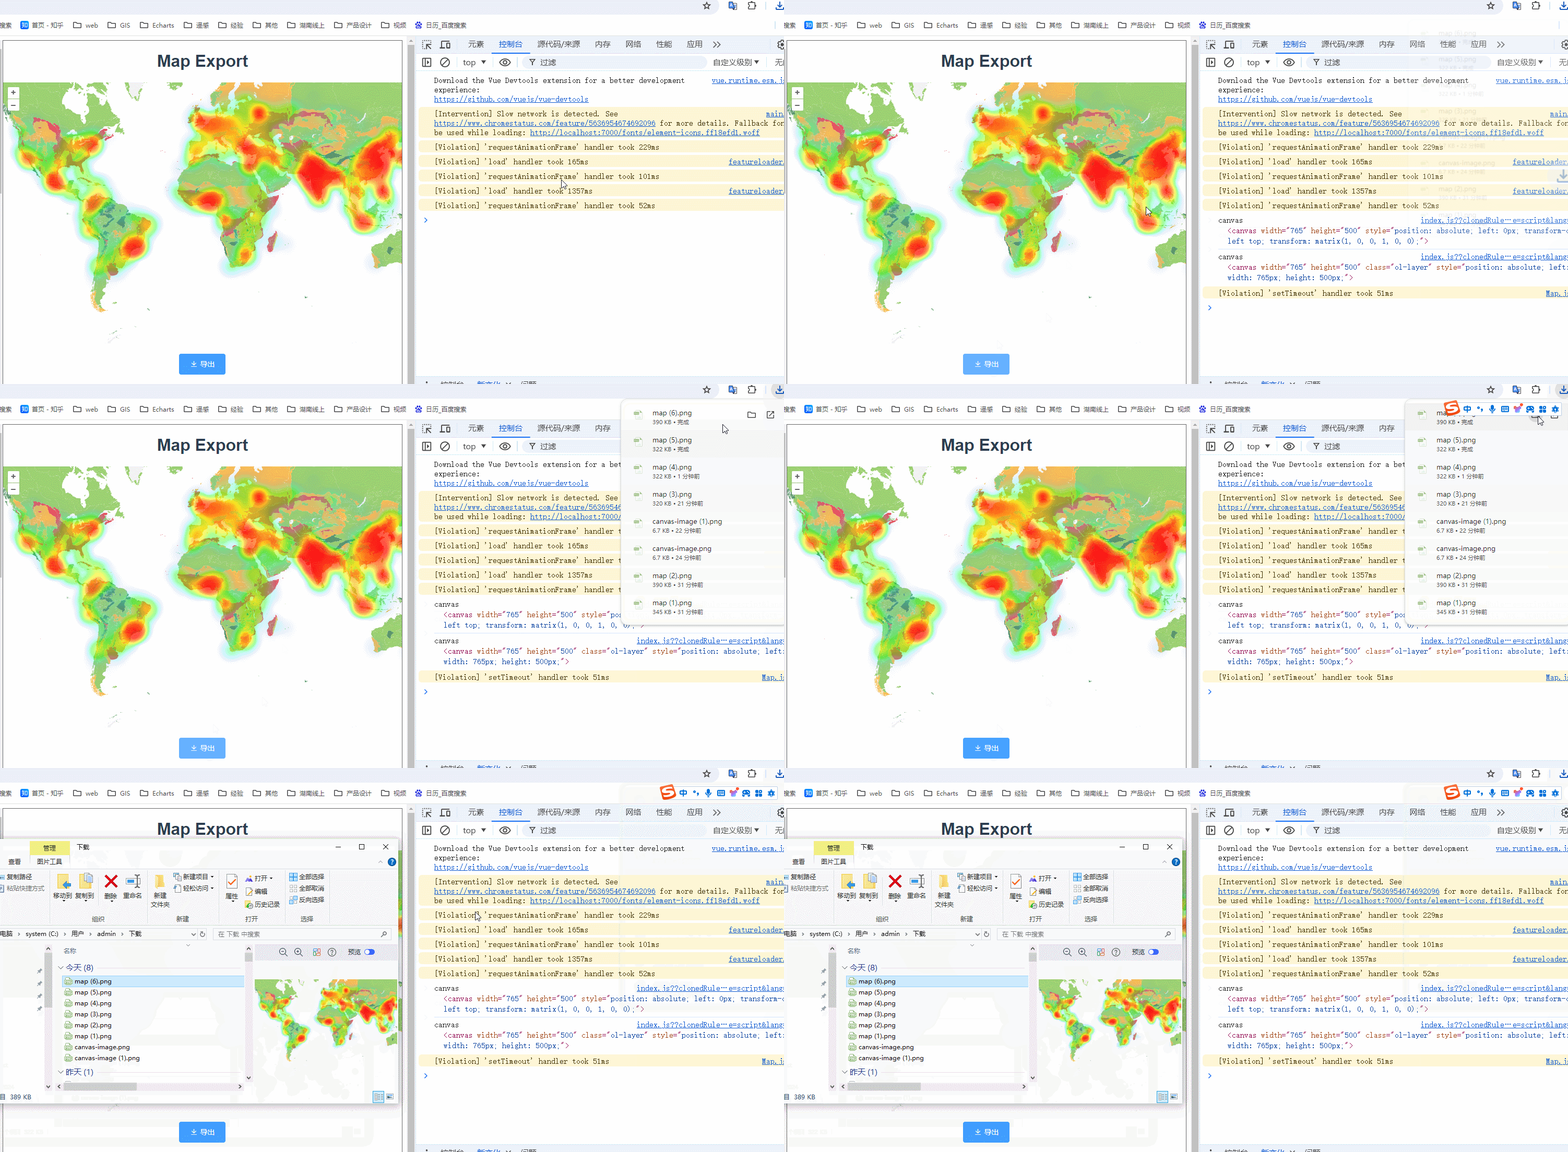
这篇介绍了如何把地图导出为图片。
先在地图上添加两个图层。
 const style = new Style({
      fill: new Fill({
        color: "#eeeeee",
      }),
    });

    this.map = new Map({
      layers: [
        new VectorLayer({
          source: new VectorSource({
            url: "https://openlayers.org/data/vector/ecoregions.json",
            format: new GeoJSON(),
          }),
          background: "white",
          style: function (feature) {
            const color = asArray(feature.get("COLOR_NNH") || "#eeeeee");
            color[3] = 0.75;
            style.getFill().setColor(color);
            return style;
          },
        }),
        new HeatmapLayer({
          source: new VectorSource({
            url: "https://openlayers.org/en/latest/examples/data/geojson/world-cities.geojson",
            format: new GeoJSON(),
          }),
          weight: function (feature) {
            return feature.get("population") / 1e7;
          },
          radius: 15,
          blur: 15,
          opacity: 0.75,
        }),
      ],
      target: "map",
      view: new View({
        center: [0, 0],
        zoom: 2,
      }),
    });
然后绑定一个点击事件,使用this.map.renderSync()同步渲染一次地图,让地图触发rendercomplete事件。
exportData() {
      this.map.once("rendercomplete", () => {


      });
      this.map.renderSync();
    },
说地图导出前,我们先来看一个例子。
在canvas上绘制图形,并导出为图片。
 // 获取canvas和context
        const canvas = document.getElementById('myCanvas');
        const context = canvas.getContext('2d');

        // 绘制一个图形
        context.fillStyle = 'blue';
        context.fillRect(50, 50, 100, 100);

        // 添加按钮点击事件
        document.getElementById('export-png').addEventListener('click', function () {
            // 创建一个新的canvas用于导出
            const exportCanvas = document.createElement('canvas');
            exportCanvas.width = canvas.width;
            exportCanvas.height = canvas.height;
            const exportContext = exportCanvas.getContext('2d');

            // 将原始canvas的内容绘制到新的canvas上
            exportContext.drawImage(canvas, 0, 0);

            // 获取下载链接
            const link = document.getElementById('image-download');
            link.href = exportCanvas.toDataURL();
            link.download = 'canvas-image.png';
            link.style.display = 'block';
            link.click();
        });
其实canvas导出为图片非常简单,直接toDataURL就行。
也就是说,只要写以下几行代码,就可以实现基本的导出功能。
 this.map.once("rendercomplete", () => {
        const mapCanvas = document.createElement("canvas");
        const size = this.map.getSize();
        mapCanvas.width = size[0];
        mapCanvas.height = size[1];
        const mapContext = mapCanvas.getContext("2d");
        Array.prototype.forEach.call(
          this.map
            .getViewport()
            .querySelectorAll(".ol-layer canvas, canvas.ol-layer"),
          function (canvas) {
            if (canvas.width > 0) {
              mapContext.drawImage(canvas, 0, 0);
            }
          }
        );
        const link = document.getElementById("image-download");
        link.href = mapCanvas.toDataURL();
        link.click();
      });
      this.map.renderSync();
因为openlayers绘制的地图上有好几canvas画布,所以要把它们都拿到,并把图像绘制到一个新的canvas上。
但是,还有一些特殊情况需要处理一下。
比如透明度
 const opacity =canvas.parentNode.style.opacity || canvas.style.opacity;
              mapContext.globalAlpha = opacity === "" ? 1 : Number(opacity);
比如transform的matrix矩阵属性,若存在,需要将transform重新设置给新的mapContext。
 let matrix;
 const transform = canvas.style.transform;
 if (transform) {
      matrix = transform.match(/^matrix\(([^\(]*)\)$/)[1].split(",").map(Number);
   } else {
      matrix = [
                  parseFloat(canvas.style.width) / canvas.width,
                  0,
                  0,
                  parseFloat(canvas.style.height) / canvas.height,
                  0,
                  0,
                ];
     }
    CanvasRenderingContext2D.prototype.setTransform.apply(
                mapContext,
                matrix
    );
再比如背景颜色。
 const backgroundColor = canvas.parentNode.style.backgroundColor;
 if (backgroundColor) {
    mapContext.fillStyle = backgroundColor;
    mapContext.fillRect(0, 0, canvas.width, canvas.height);
 }
完整代码:
<template>
  <div class="box">
    <h1>Map Export</h1>
    <div id="map" class="map"></div>
    <el-button type="primary" icon="el-icon-download" @click="exportData"
      >导出</el-button
    >
    <a id="image-download" download="map.png"></a>
  </div>
</template>

<script>
import GeoJSON from "ol/format/GeoJSON.js";
import Map from "ol/Map.js";
import VectorSource from "ol/source/Vector.js";
import View from "ol/View.js";
import { Fill, Style } from "ol/style.js";
import { Heatmap as HeatmapLayer, Vector as VectorLayer } from "ol/layer.js";
import { asArray } from "ol/color.js";
export default {
  name: "",
  components: {},
  data() {
    return {
      map: null,
    };
  },
  computed: {},
  created() {},
  mounted() {
    const style = new Style({
      fill: new Fill({
        color: "#eeeeee",
      }),
    });

    this.map = new Map({
      layers: [
        new VectorLayer({
          source: new VectorSource({
            url: "https://openlayers.org/data/vector/ecoregions.json",
            format: new GeoJSON(),
          }),
          background: "white",
          style: function (feature) {
            const color = asArray(feature.get("COLOR_NNH") || "#eeeeee");
            color[3] = 0.75;
            style.getFill().setColor(color);
            return style;
          },
        }),
        new HeatmapLayer({
          source: new VectorSource({
            url: "https://openlayers.org/en/latest/examples/data/geojson/world-cities.geojson",
            format: new GeoJSON(),
          }),
          weight: function (feature) {
            return feature.get("population") / 1e7;
          },
          radius: 15,
          blur: 15,
          opacity: 0.75,
        }),
      ],
      target: "map",
      view: new View({
        center: [0, 0],
        zoom: 2,
      }),
    });
  },
  methods: {
    exportData() {
      this.map.once("rendercomplete", () => {
        const mapCanvas = document.createElement("canvas");
        const size = this.map.getSize();
        mapCanvas.width = size[0];
        mapCanvas.height = size[1];
        const mapContext = mapCanvas.getContext("2d");
        Array.prototype.forEach.call(
          this.map
            .getViewport()
            .querySelectorAll(".ol-layer canvas, canvas.ol-layer"),
          function (canvas) {
            if (canvas.width > 0) {
              const opacity =
                canvas.parentNode.style.opacity || canvas.style.opacity;
              mapContext.globalAlpha = opacity === "" ? 1 : Number(opacity);
              let matrix;
              const transform = canvas.style.transform;
              console.log('transform',transform);
              if (transform) {
                // Get the transform parameters from the style's transform matrix
                matrix = transform
                  .match(/^matrix\(([^\(]*)\)$/)[1]
                  .split(",")
                  .map(Number);
                  console.log('matrix',matrix);
              } else {
                matrix = [
                  parseFloat(canvas.style.width) / canvas.width,
                  0,
                  0,
                  parseFloat(canvas.style.height) / canvas.height,
                  0,
                  0,
                ];
              }
              CanvasRenderingContext2D.prototype.setTransform.apply(
                mapContext,
                matrix
              );
              const backgroundColor = canvas.parentNode.style.backgroundColor;
              if (backgroundColor) {
                mapContext.fillStyle = backgroundColor;
                mapContext.fillRect(0, 0, canvas.width, canvas.height);
              }
              mapContext.drawImage(canvas, 0, 0);
            }
          }
        );
        mapContext.globalAlpha = 1;
        mapContext.setTransform(1, 0, 0, 1, 0, 0);
        const link = document.getElementById("image-download");
        link.href = mapCanvas.toDataURL();
        link.click();
      });
      this.map.renderSync();
    },
  },
};
</script>

<style lang="scss" scoped>
#map {
  width: 100%;
  height: 500px;
}
.box {
  height: 100%;
}
</style>


 被折叠的 条评论
为什么被折叠?


