


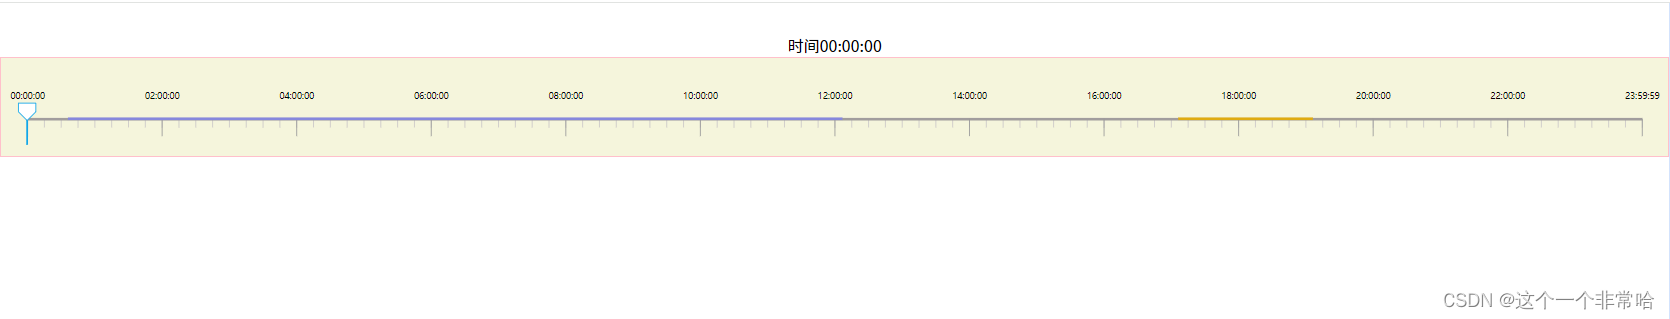
效果如上面所示
1.安装D3.js
官网传送带:Getting started | D3 by Observable
2.创建所需数据
这里需要1天的时间数据,用for循环模拟了一下
for (let index = 0; index <= 24; index++) {
this.list.push({
time: `2023-12-26 ${index.toString().padStart(2, '0')}:00:00`
});
}
3. 创建一个dom容器
<div ref="rulerRef" :class="$style.ruler"></div>
 const height = 100;
 const margin = { top: 10, right: 30, left: 30, bottom: 30 };
 const svg = d3.create('svg').attr('viewBox', [0, 0, this.width, height]).attr('font-size', 16);
this.$refs.rulerRef.appendChild(svg.node());
4.初始化刻度
4-1.用2个x轴重叠模拟刻度
const scale = d3
        .scaleTime()
        .domain(d3.extent(this.list, d => new Date(d.time)))
        .range([margin.left, this.width - margin.left]);

      const xAxis = d3
        .axisBottom(scale)
        .ticks(d3.timeHour.every(2))
        .tickSize(20)
        .tickSizeOuter(0)
        .tickFormat((d, i) => {
          return i == 12 ? '23:59:59' : d3.timeFormat('%H:%M:%S')(d);
        })
        .tickPadding(-50);
      const axis = d3
        .axisBottom(scale)
        .ticks(80)
        .tickSize(10)
        .tickFormat(() => null);
      svg
        .append('g')
        .attr('class', 'lines')
        .attr('transform', `translate(0,${height - margin.bottom})`)
        .call(axis)
        .select('.domain')
        .remove();
      svg
        .append('g')
        .attr('class', 'base')
        .attr('transform', `translate(0,${height - margin.bottom})`)
        .call(xAxis)
        .selectAll('path')
        .style('stroke', '#a19d9d')
        .style('stroke-width', 3);

      // 更改线段颜色
      svg.selectAll('.base line').style('stroke', '#999');
svg.selectAll('.lines line').style('stroke', '#cbc7c7'); 
4-2.创建白色方块
// 画圆和线条
      const g = svg.append('g');
      const line = g
        .append('line')
        .attr('x1', margin.left)
        .attr('y1', height - margin.bottom)
        .attr('x2', margin.left)
        .attr('y2', height)
        .attr('stroke', '#11a6e9')
        .attr('stroke-width', 2)
        .attr('fill', '#11a6e9');
      // ====用圆形==
      // g.append('circle')
      //   .attr('class', 'drag')
      //   .attr('cx', margin.left)
      //   .attr('cy', margin.bottom)
      //   .attr('r', 10)
      //   .attr('stroke', 'pink')
      //   .attr('fill', 'pink')
      // ==end===
      const x = 20;
      const y = height - margin.bottom - 18;
      g.append('polygon')
        .attr('class', 'drag')
        .attr('points', `${x},${y} ${x + 20},${y} ${x + 20},${y + 10} ${x + 10},${y + 20} ${x},${y + 10}`)
        .attr('stroke', '#11a6e9')
.attr('fill', 'white'); 
4-3.白色方块可拖动
 const _this = this;
      function started(event) {
        const circle = d3.select(this).classed('dragging', true);
        const dragged = event => {
          // 限制可拖动时间范围
          let min = event.x < margin.left ? margin.left : event.x;
          min = min + margin.left > _this.width ? _this.width - margin.left - 1 : min;
          // ====用圆形==
          // circle
          //   .raise()
          //   .attr('cx', (this.x = min))
          //   .attr('cy', 50);
          // ==end===
          const x = min - 10; //减去滑块自身宽度
          circle.attr('points', `${x},${y} ${x + 20},${y} ${x + 20},${y + 10} ${x + 10},${y + 20} ${x},${y + 10}`);
          _this.time = moment(scale.invert(min)).format('HH:mm:ss');
          // 精度不准确,加上粗略显示时间
          if (moment(scale.invert(min)).format('HH:mm') == '23:59') {
            _this.time = '23:59:59';
          }
          // 设置线条移动
          line.attr('x1', min).attr('x2', min);
        };
        const ended = () => circle.classed('dragging', false);
        event.on('drag', dragged).on('end', ended);
      }
      g.select('polygon').call(d3.drag().on('start', started));
5.模拟时间段数据情况,比如9-12点人流量大显示蓝色,下午13-14人少是橙色
用数组表示,主要是获取初始值和最终值,中间那些值不重要
const blue = ['2023-12-29 01:00:00', '2023-12-29 12:30:30'];
const yellow = ['2023-12-29 17:30:00', '2023-12-29 19:30:15'];
5-1.获取初始值的第一点
// 获取第一个点
const first = parseInt(scale(new Date('2023-12-29 00:00:00')));
5-2.根据时间画两条时间段
 svg
        .append('line')
        .attr('x1', parseInt(scale(new Date(blue[0]))) - first)
        .attr('y1', height - margin.bottom)
        .attr('x2', parseInt(scale(new Date(blue[1]))) - first)
        .attr('y2', height - margin.bottom)
        .attr('stroke', '#8688dd')
        .attr('stroke-width', 3)
        .attr('fill', '#8688dd');

      svg
        .append('line')
        .attr('x1', parseInt(scale(new Date(yellow[0]))) - first)
        .attr('y1', height - margin.bottom)
        .attr('x2', parseInt(scale(new Date(yellow[1]))) - first)
        .attr('y2', height - margin.bottom)
        .attr('stroke', '#dfab11')
        .attr('stroke-width', 3)
        .attr('fill', '#dfab11');
以上就是整体的代码过程,完整版组件可看下方
<template>
  <div :class="$style.root">
    <!-- <svg width="200" height="200">
      <polygon points="50,50 150,50 150,100 95,150 50,100" stroke="black" fill="none" />
      <polygon points="30,50 40,50 40,55 35,60 30,55" stroke="black" fill="none" />
    </svg> -->
    <div :class="$style.time">时间{{ time }}</div>
    <div ref="rulerRef" :class="$style.ruler"></div>
  </div>
</template>
<script>
import * as d3 from "https://cdn.jsdelivr.net/npm/d3@7/+esm";
import moment from 'moment';
export default {
  data() {
    return {
      x: null,
      svg: null,
      g: null,
      list: [],
      width: 1920,
      time: '00:00:00'
    };
  },
  mounted() {
    for (let index = 0; index <= 24; index++) {
      this.list.push({
        time: `2023-12-26 ${index.toString().padStart(2, '0')}:00:00`
      });
    }
    this.init();
  },
  methods: {
    init() {
      const height = 100;
      const margin = { top: 10, right: 30, left: 30, bottom: 30 };
      const svg = d3.create('svg').attr('viewBox', [0, 0, this.width, height]).attr('font-size', 16);
      const scale = d3
        .scaleTime()
        .domain(d3.extent(this.list, d => new Date(d.time)))
        .range([margin.left, this.width - margin.left]);

      const xAxis = d3
        .axisBottom(scale)
        .ticks(d3.timeHour.every(2))
        .tickSize(20)
        .tickSizeOuter(0)
        .tickFormat((d, i) => {
          return i == 12 ? '23:59:59' : d3.timeFormat('%H:%M:%S')(d);
        })
        .tickPadding(-50);
      const axis = d3
        .axisBottom(scale)
        .ticks(80)
        .tickSize(10)
        .tickFormat(() => null);
      svg
        .append('g')
        .attr('class', 'lines')
        .attr('transform', `translate(0,${height - margin.bottom})`)
        .call(axis)
        .select('.domain')
        .remove();
      svg
        .append('g')
        .attr('class', 'base')
        .attr('transform', `translate(0,${height - margin.bottom})`)
        .call(xAxis)
        .selectAll('path')
        .style('stroke', '#a19d9d')
        .style('stroke-width', 3);

      // 画颜色线条(模拟数据)===start===
      const blue = ['2023-12-29 01:00:00', '2023-12-29 12:30:30'];
      const yellow = ['2023-12-29 17:30:00', '2023-12-29 19:30:15'];
      // 获取第一个点
      const first = parseInt(scale(new Date('2023-12-29 00:00:00')));
      svg
        .append('line')
        .attr('x1', parseInt(scale(new Date(blue[0]))) - first)
        .attr('y1', height - margin.bottom)
        .attr('x2', parseInt(scale(new Date(blue[1]))) - first)
        .attr('y2', height - margin.bottom)
        .attr('stroke', '#8688dd')
        .attr('stroke-width', 3)
        .attr('fill', '#8688dd');

      svg
        .append('line')
        .attr('x1', parseInt(scale(new Date(yellow[0]))) - first)
        .attr('y1', height - margin.bottom)
        .attr('x2', parseInt(scale(new Date(yellow[1]))) - first)
        .attr('y2', height - margin.bottom)
        .attr('stroke', '#dfab11')
        .attr('stroke-width', 3)
        .attr('fill', '#dfab11');
      // =====end==========
      // 画圆和线条
      const g = svg.append('g');
      const line = g
        .append('line')
        .attr('x1', margin.left)
        .attr('y1', height - margin.bottom)
        .attr('x2', margin.left)
        .attr('y2', height)
        .attr('stroke', '#11a6e9')
        .attr('stroke-width', 2)
        .attr('fill', '#11a6e9');
      // ====用圆形==
      // g.append('circle')
      //   .attr('class', 'drag')
      //   .attr('cx', margin.left)
      //   .attr('cy', margin.bottom)
      //   .attr('r', 10)
      //   .attr('stroke', 'pink')
      //   .attr('fill', 'pink')
      // ==end===
      const x = 20;
      const y = height - margin.bottom - 18;
      g.append('polygon')
        .attr('class', 'drag')
        .attr('points', `${x},${y} ${x + 20},${y} ${x + 20},${y + 10} ${x + 10},${y + 20} ${x},${y + 10}`)
        .attr('stroke', '#11a6e9')
        .attr('fill', 'white');

      const _this = this;
      function started(event) {
        const circle = d3.select(this).classed('dragging', true);
        const dragged = event => {
          // 限制可拖动时间范围
          let min = event.x < margin.left ? margin.left : event.x;
          min = min + margin.left > _this.width ? _this.width - margin.left - 1 : min;
          // ====用圆形==
          // circle
          //   .raise()
          //   .attr('cx', (this.x = min))
          //   .attr('cy', 50);
          // ==end===
          const x = min - 10; //减去滑块自身宽度
          circle.attr('points', `${x},${y} ${x + 20},${y} ${x + 20},${y + 10} ${x + 10},${y + 20} ${x},${y + 10}`);
          _this.time = moment(scale.invert(min)).format('HH:mm:ss');
          // 精度不准确,加上粗略显示时间
          if (moment(scale.invert(min)).format('HH:mm') == '23:59') {
            _this.time = '23:59:59';
          }
          // 设置线条移动
          line.attr('x1', min).attr('x2', min);
        };
        const ended = () => circle.classed('dragging', false);
        event.on('drag', dragged).on('end', ended);
      }
      g.select('polygon').call(d3.drag().on('start', started));

      // 更改线段颜色
      svg.selectAll('.base line').style('stroke', '#999');
      svg.selectAll('.lines line').style('stroke', '#cbc7c7');
      this.$refs.rulerRef.appendChild(svg.node());
    }
  }
};
</script>
<style lang="scss" module>
.root {
  padding-top: 30px;
  width: 100%;
  .time {
    text-align: center;
    width: 100%;
  }
  .ruler {
    width: 100%;
    height: 100px;
    border: 1px solid pink;
    box-sizing: border-box;
    background: beige;
  }
}
</style>


 被折叠的 条评论
为什么被折叠?
被折叠的 条评论
为什么被折叠?
 到【灌水乐园】发言


