


一、pyEcharts是什么?
ECharts是一款基于JavaScript的数据可视化图表库,提供直观,生动,可交互,可个性化定制的数据可视化图表。ECharts最初由百度团队开源,并于2018年初捐赠给Apache基金会,成为ASF孵化级项目。
pyEcharts库是一个用于生成 ECharts 图表的类库。
二、使用步骤
1.pip 安装
pip install pyecharts
2.引入
代码如下(示例):
import pyecharts
3.简单使用
开始来绘制你的第一个图表
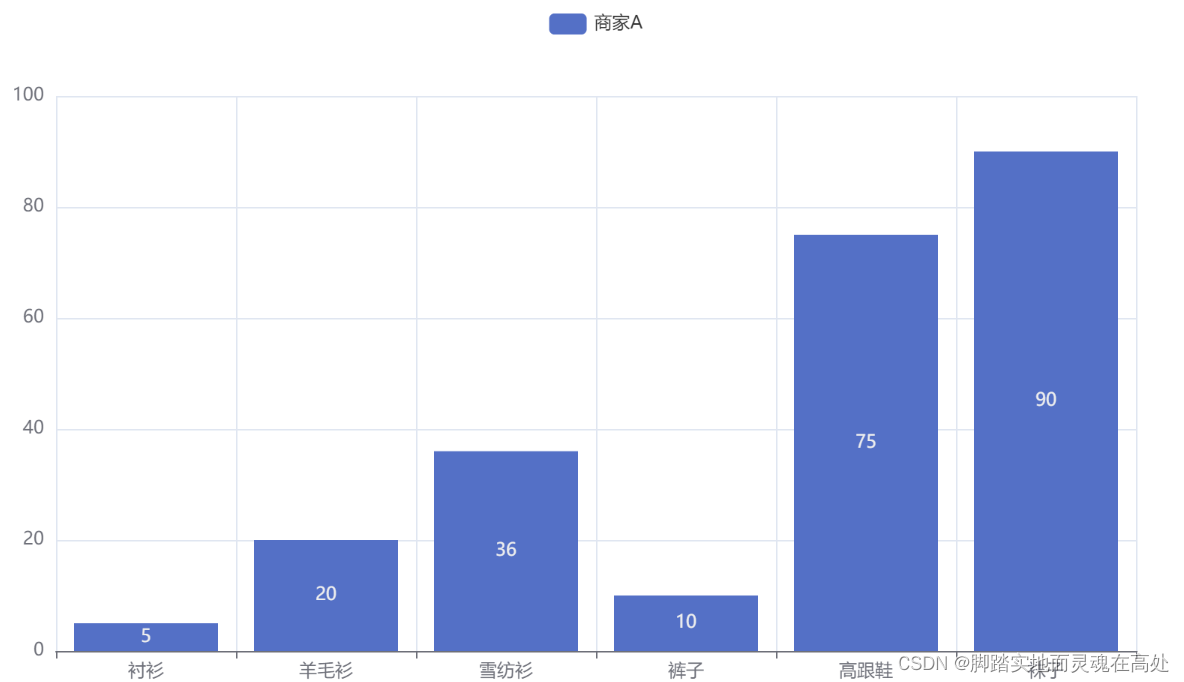
from pyecharts.charts import Bar

bar = Bar()
bar.add_xaxis(["衬衫", "羊毛衫", "雪纺衫", "裤子", "高跟鞋", "袜子"])
bar.add_yaxis("商家A", [5, 20, 36, 10, 75, 90])
# render 会生成本地 HTML 文件,默认会在当前目录生成 render.html 文件
# 也可以传入路径参数,如 bar.render("mycharts.html")
bar.render()
效果:
三、python连接Mysql数据库
import pymysql as pymysql
db = pymysql.connect(host="192.xxx.xxx.xxx", user="root", password="123456", database="ads_finance")
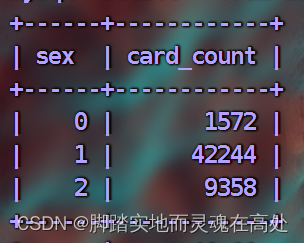
sql = "SELECT CASE sex WHEN 0 THEN '男' WHEN 1 THEN '女' WHEN 2 THEN '未知' END AS sex, card_count FROM ads_finance_sex_count;"
try:
cursor = db.cursor()
cursor.execute(sql)
cos = cursor.fetchall()
except Exception as e:
db.rollback()
print('连接失败',e)
else:
db.commit()
print('连接成功',cos)
cursor.close()
db.close()
数据样式
四、使用pyEcharts绘图
costomer = list(map(itemgetter(0), cos))
quantity = list(map(itemgetter(1), cos))
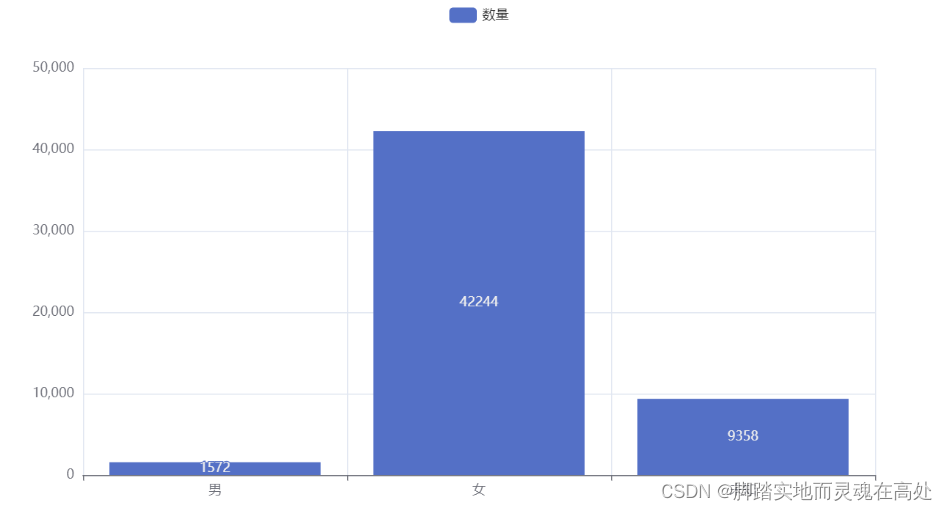
bar = Bar()
bar.add_xaxis(costomer)
bar.add_yaxis("数量", quantity)
# render 会生成本地 HTML 文件,默认会在当前目录生成 render.html 文件
# 也可以传入路径参数,如 bar.render("mycharts.html")
bar.render("firstChart.html")
效果:
五、绘制一张地图
完整代码:
from pyecharts import options as opts
from pyecharts.charts import Map
import pymysql as pymysql
from operator import itemgetter

db = pymysql.connect(host="192.xxx.xxx.xxx", user="root", password="123456", database="nshop_bi")
sql = "select customer_natives,sum(order_amounts) from ads_nshop_oper_stat group by customer_natives;"

try:
    cursor = db.cursor()
    cursor.execute(sql)
    cos = cursor.fetchall()
except Exception as e:
    db.rollback()
    print('连接失败',e)
else:
    db.commit()
    print('连接成功',cos)

provience = list(map(itemgetter(0), cos))
money = list(map(itemgetter(1), cos))

c = (
    Map()
    .add("省份", [list(z) for z in zip(provience, money)], "china")
    .set_global_opts(
        visualmap_opts=opts.VisualMapOpts(max_=70000),
    )
    .render("china_map.html")
)
cursor.close()
db.close()
效果:


 1286
1286


 被折叠的 条评论
为什么被折叠?
被折叠的 条评论
为什么被折叠?
 到【灌水乐园】发言


