


 本文介绍如何在Android项目中利用aChartEngine库制作一个x轴为日期/时间,拥有两条Y轴(柱状图表示运动量,折线图表示体重变化)的图表。由于CombinedXYChart不支持时间坐标,作者通过研究源码,扩展了一个CombinedTimeChart类来实现这一功能。文章附带了遇到的问题和最终效果图,但未提供完整源码。
在做一个安卓项目时需要做一个x轴为时间,两个y轴,一个用折线表示的体重,一个用柱状图表示的运动量的图。找到了achart这个开源的引擎,找了一圈,没发现做类似图的教程。只好去看官方的文档,下图是引擎中图表类之间的关系图:
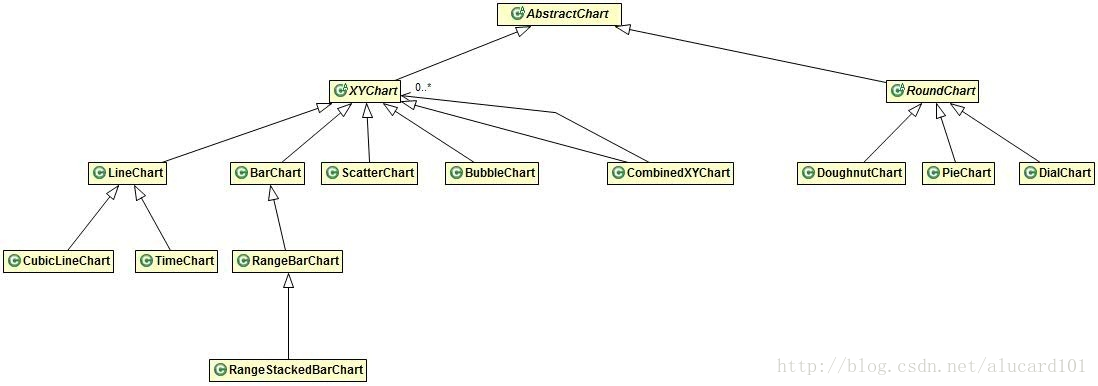
x坐标为时间(日期)的图表是TimeChart,他继承自折线图(LineChart),而要制作折线-柱形复合图却需要用combinedXYChart,而CombinedXyChart没有的对横坐标时间的支持。看了下源码,决定模仿TimeChart,自己扩展一个CombinedTimeChart。
先写一个支持双y轴的数据类:
public class MyTimeSeries extends XYSeries {
	/**
	 * Builds a new date / time series.
	 *
	 * @param title
	 *            the series title
	 */
	public MyTimeSeries(String title) {
		super(title);
	}

	public MyTimeSeries(String title, int scaleNumber) {
		super(title, scaleNumber);//其实相比原来的TimeSeries只是加了这个构造函数
	}
	/**
	 * Adds a new value to the series.
	 *
	 * @param x
	 *            the date / time value for the X axis
	 * @param y
	 *            the value for the Y axis
	 */
	public synchronized void add(Date x, double y) {
		super.add(x.getTime(), y);
	}

	protected double getPadding(double x) {
		return 1;
	}
}
public class CombinedTimeChart extends CombinedXYChart {
	 /** The constant to identify this chart type. */
	  public static final String TYPE = "Time";
	  /** The number of milliseconds in a day. */
	  public static final long DAY = 24 * 60 * 60 * 1000;
	  /** The date format pattern to be used in formatting the X axis labels. */
	  private String mDateFormat;
	  /** The starting point for labels. */
	  private Double mStartPoint;


	  /**
	   * Builds a new time chart instance.
	   *
	   * @param dataset the multiple series dataset
	   * @param renderer the multiple series renderer
	   */
	  public CombinedTimeChart(XYMultipleSeriesDataset dataset, XYMultipleSeriesRenderer renderer,
		      String[] types) {
	    super(dataset, renderer, types);
	  }

	  /**
	   * Returns the date format pattern to be used for formatting the X axis
	   * labels.
	   *
	   * @return the date format pattern for the X axis labels
	   */
	  public String getDateFormat() {
	    return mDateFormat;
	  }

	  /**
	   * Sets the date format pattern to be used for fo
最低0.47元/天 解锁文章


 被折叠的 条评论
为什么被折叠?
被折叠的 条评论
为什么被折叠?
 到【灌水乐园】发言


