Antv G2 雷达图 单层 双层效果图

雷达图

在这里插入图片描述

import React, { useEffect, useState, useRef } from "react"
import "./chart.less"
import { Chart } from "@antv/g2";
import DataSet from '@antv/data-set';

const Charts = () => {
    const fields = new Map()
    fields.set(1, "产品功能")
    fields.set(2, "服务质量")
    fields.set(3, "项目管理")
    fields.set(4, "实施过程")
    fields.set(5, "整体效果")
    fields.set(6, "专业技能")
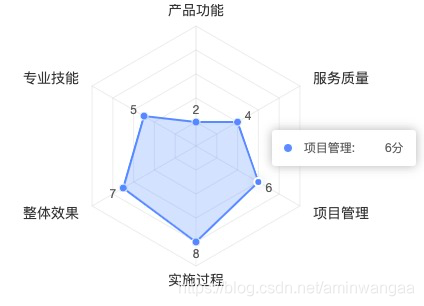
    const data = [
        { item: fields.get(1), a: 2 },
        { item: fields.get(2), a: 4 },
        { item: fields.get(3), a: 6 },
        { item: fields.get(4), a: 8 },
        { item: fields.get(5), a: 7 },
        { item: fields.get(6), a: 5 },
    ]
    const [chart, setChart] = useState(null)
    const chartRef = useRef()
    const { DataView } = DataSet;
    const dv = new DataView().source(data);
    // 转化数据  数据格式正好的情况 可以不用 
    dv.transform({
        type: 'fold',
        fields: ['a'], // 展开字段集
        key: 'user', // key字段
        value: 'score', // value字段
    });

    useEffect(() => {
    	// 初始化设置chart
        const chart = new Chart({
            container: 'c8',
            autoFit: true,
            height: 300,
        });
        setChart(() => chart)
    }, [])

    useEffect(() => {
   		// 监听chart  有了之后再渲染  加个监听数据的 可以更新视图
        chart && renderChart()
    }, [chart])

    const renderChart = () => {
        chart.clear()
        chart.data(dv.rows);

        chart.scale('score', {
            min: 0, // 坐标轴的最小值
            max: 10, // 坐标轴的最大值
            tickCount: 6, // 控制坐标轴刻度数量 0-10 不使用这个的话 会变成 0 0.25 0.5 0.75 1
            nice: true // 一般用nice: true 就不用调样式了
        });
        // 控制图形状 大小
        chart.coordinate('polar', {
            radius: 0.8, // 缩放图的比例
        });

        chart.axis('item', {
            line: null,
            tickLine: null,
            grid: {
                line: {
                    style: {
                        lineDash: null,
                    },
                },
            },
            label: {
                style: {
                    fontSize: 14,
                    fill: '#333', // 文本的颜色
                },
                offset: 15 // label文本的偏移量
            }
        });

        chart.axis('score', {
            line: null,
            tickLine: null,
            grid: {
                line: {
                    type: 'line',
                    style: {
                        lineDash: null,
                    },
                },
            },
            label: {
                formatter: () => "" // 隐藏坐标轴的刻度文本 0 2 4 6 8 10 产品需要
            }
        });
		// 设置连线
        chart
            .line()
            .position('item*score')
            .size(2)
		// 设置点
        chart
            .point()
            .position('item*score')
            .shape('circle')
            .size(4)
            .label("score", (score) => {
            	// 点的关联文本 显示分数 并且不旋转
                return {
                    textStyle: {
                        rotate: 0
                    },
                    autoRotate: false,
                    content: score, // 一个坑 上面axis的label用formatter 这里是content
                }
            })
            .style({
                stroke: '#fff',
                lineWidth: 1,
                fillOpacity: 1,
            })
		// 下面设置showTitle: false无效 就用了这种 关闭所有的title
        chart.tooltip({
            showTitle: false,
        })

        chart
            .area()
            .position('item*score')
            .tooltip("score*item", (score, item) => {
                // 不用自定义模板的时候  字段name  value
                return {
                    showTitle: false,
                    // name: `用户${user}`,
                    name: item, // 将title的位置改变
                    value: `${score}分`,
                }
            })
        chart.render();
    }

    return (
        <div className={"chart8"}>
            <div id="c8" ref={chartRef} />
        </div>
    )
}

export default Charts
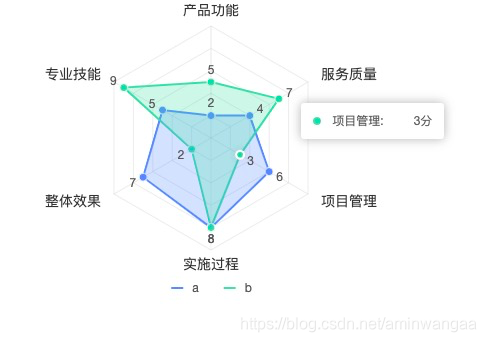
在这里插入图片描述

 const data = [
        { item: fields.get(1), a: 2, b: 5 },
        { item: fields.get(2), a: 4, b: 7 },
        { item: fields.get(3), a: 6, b: 3 },
        { item: fields.get(4), a: 8, b: 8 },
        { item: fields.get(5), a: 7, b: 2 },
        { item: fields.get(6), a: 5, b: 9 },
    ]
// 修改data数据 增加b
// line point area 增加  .color('user')

        chart
            .line()
            .position('item*score')
            .size(2)
            .color('user')

        chart
            .point()
            .position('item*score')
            .shape('circle')
            .size(4)
            .label("score", (score) => {
                return {
                    textStyle: {
                        rotate: 0
                    },
                    autoRotate: false,
                    content: score,
                }
            })
            .style({
                stroke: '#fff',
                lineWidth: 1,
                fillOpacity: 1,
            })
            .color('user')

        chart.tooltip({
            showTitle: false,
        })

        chart
            .area()
            .position('item*score')
            .tooltip("score*item", (score, item) => {
                // 不用自定义模板的时候  字段name  value
                return {
                    showTitle: false,
                    // name: `用户${user}`,
                    name: item,
                    value: `${score}分`,
                }
            })
            .color('user')
  • 1
    点赞
  • 1
    收藏
    觉得还不错? 一键收藏
  • 0
    评论

“相关推荐”对你有帮助么?

  • 非常没帮助
  • 没帮助
  • 一般
  • 有帮助
  • 非常有帮助
提交
评论
添加红包

请填写红包祝福语或标题

红包个数最小为10个

红包金额最低5元

当前余额3.43前往充值 >
需支付:10.00
成就一亿技术人!
领取后你会自动成为博主和红包主的粉丝 规则
hope_wisdom
发出的红包
实付
使用余额支付
点击重新获取
扫码支付
钱包余额 0

抵扣说明:

1.余额是钱包充值的虚拟货币,按照1:1的比例进行支付金额的抵扣。
2.余额无法直接购买下载,可以购买VIP、付费专栏及课程。

余额充值