


Diary1 2010-08-16
These few days I am working with the MS Chart and Telerik RadChart. I did a very simple web site to show the test correctness result based on Version, Task, Scenario and Method. In the following step, I am gonna give the performance chart and code coverage Chart. Here are a few pics to show it.
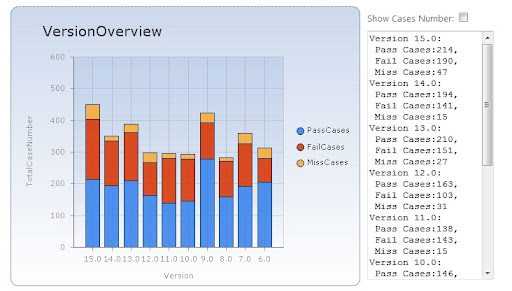
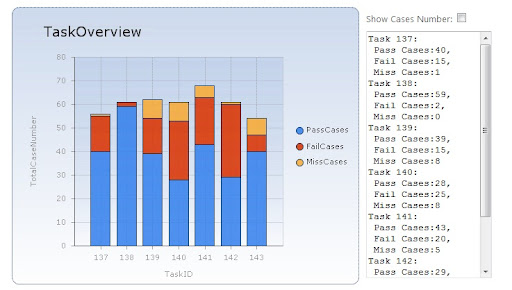
The first 2 pics are done by Telerik RadChart. The second one can be got by click the particular version column. The term for this functionality is “Drill Down”. The click event will be captured and encapsulated to ChartClickEventArgs With the object of this class, we can get Series and SeriesItem. Usually we will get the index of the one we are cliking by obj.SeriesItem.Index. Once we get the index, we can get the value of XAxis and YAxis.
There are some useful links, when I am doing this.
First one is about the chart element.
http://www.telerik.com/help/aspnet-ajax/stylingelements.html
This one is about the Drill-Down Feature.
http://demos.telerik.com/aspnet-ajax/chart/examples/functionality/drilldown/defaultcs.aspx
This one is the fancy feature provided by RadChart.
http://demos.telerik.com/aspnet-ajax/chart/examples/newfeatures/zoomingscrolling/defaultcs.aspx
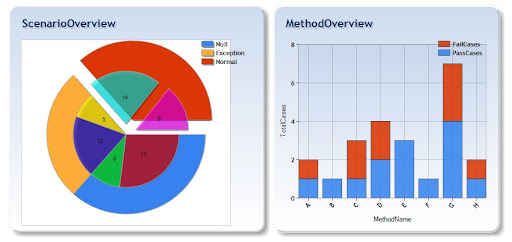
The following pic is done by MS Chart. The term for the left pic of the third one is 2D grouped pie chart. I can click the outer pie slice to reload the right chart. The pie slice has the Exploded=true . I can also click the inner pie slice to reload the right chart. The click event is encapsulated to ImageMapEventArgs . obj.PostBackValue could help to get the PostBackValue of the one you clicked.
Therefore, to make sure this one could work, you have to set the PostBackValue to series. Here is the one statement I used in my case “innerSer.PostBackValue = "D:#LEGENDTEXT:#INDEX";” I want to get the Legendtext and the”D” is a mark for me to specify which series is clicked.
There are not a lot of work when you understand this stuff.
For MS chart, this link is fancy helpful. It gives the simple samples.
http://code.msdn.microsoft.com/mschart
For me I do like MS Chart more than RadChart. Maybe I haven’t try the fancy stuff provided by RadChart. Whatever, RadChart is very popular now.
Hope this all could help the dummys like me! Welcome to comment. Plus, I do speak Chinese!


 786
786

 被折叠的 条评论
为什么被折叠?
被折叠的 条评论
为什么被折叠?
 到【灌水乐园】发言


