


 该项目使用Python网络爬虫技术抓取新闻网站各版块的最新数据,进行分类、分词、关键词统计和词云、词群分析。通过Flask搭建后台,Echarts实现前端可视化,包括新闻热度分布直方图。更新日志显示,系统已优化网络爬虫、前端页面和增加了话题趋势预测算法。
温馨提示:文末有 CSDN 平台官方提供的学长 QQ 名片 :)
1. 项目简介
利用网络爬虫技术从某新闻网站爬取最新的新闻数据,并进行版块分类,对某篇版块下的所有新闻进行中文分词,保留表征能力强名词和动词作为关键词,并进行关键词词频统计,同时对新闻进行词云统计和词群分析。对不同版块的新闻热度进行统计分析。利用 flask 搭建后台,构建标准的 restful 接口,前端利用 bootstrap + echarts + jquery 调用后台接口,并进行前端的渲染可视化。
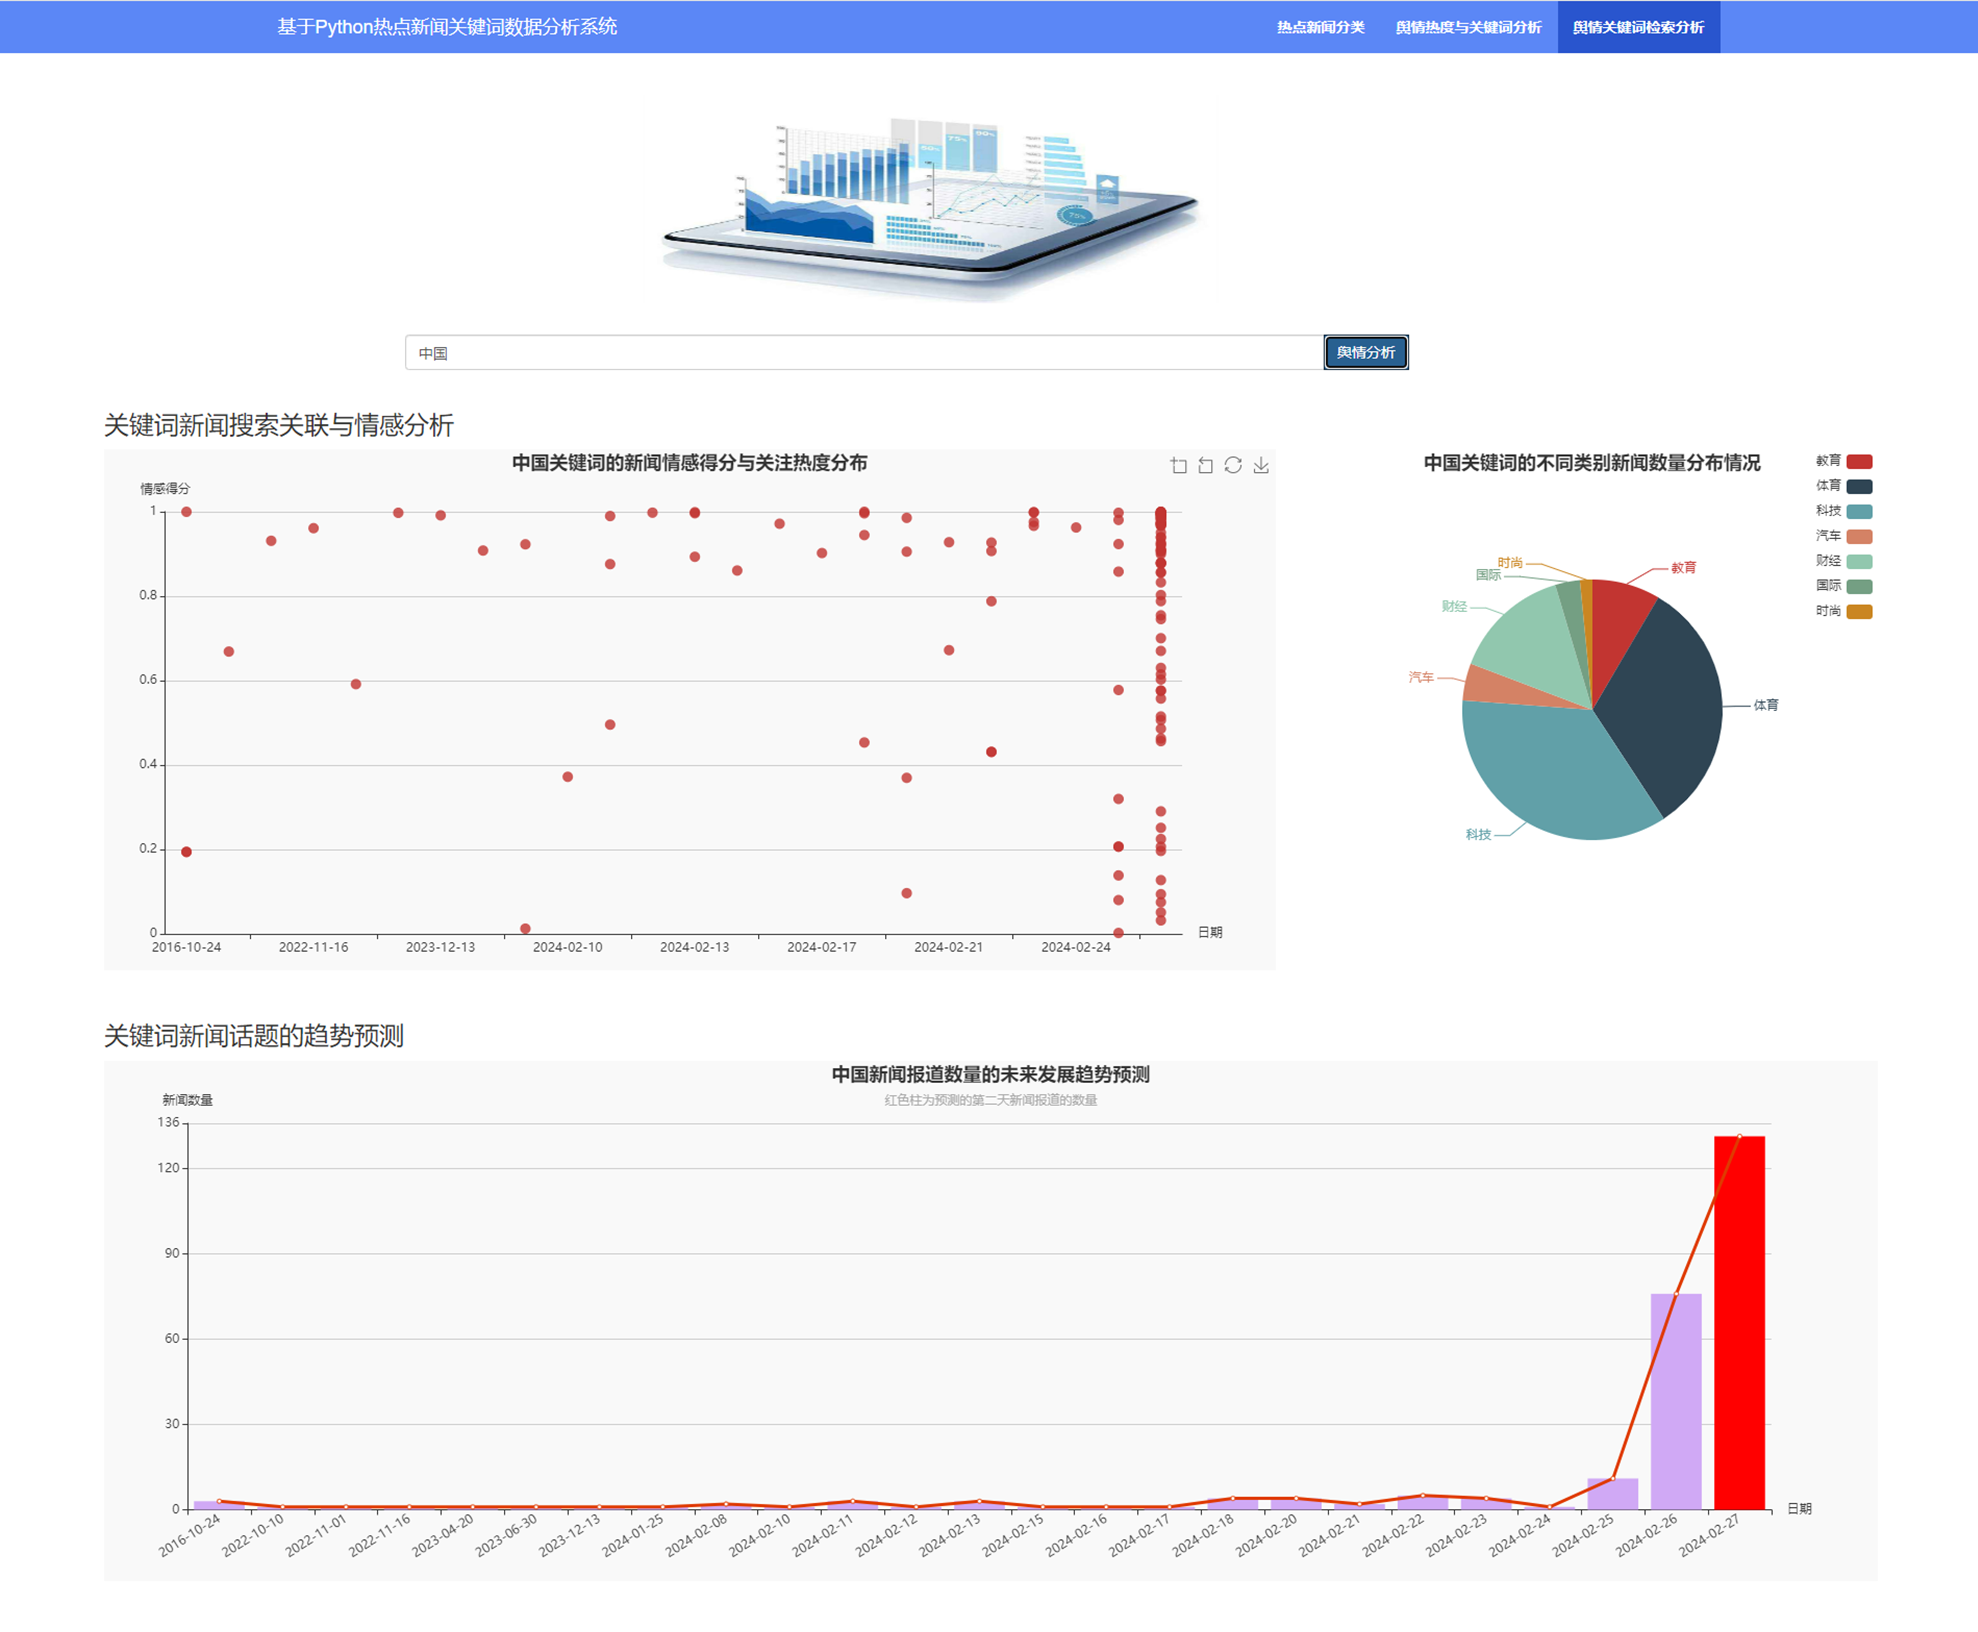
更新日志:优化网络爬虫、前端页面和交互逻辑,增加话题趋势预测算法。
2. 功能组成
基于Python社会热点新闻关键词数据分析系统的功能主要包括:
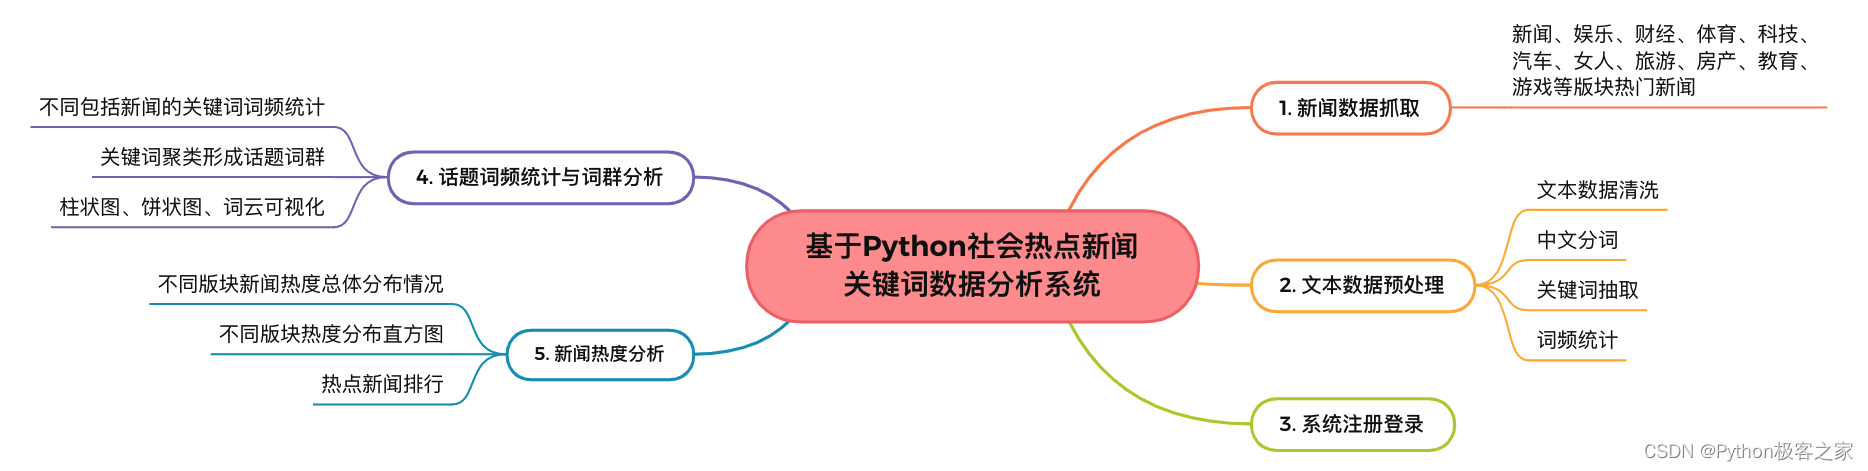
3. 新闻数据爬虫
利用 Python 的 request + beautifulsoup 实现某新闻网站的新闻、娱乐、财经、体育、科技、汽车、女人、旅游、房产、教育、游戏等版块的最新新闻数据,完成数据清洗后存储到文件系统或数据库中。
......

news_infoes = []
# 分别爬取每个版块的热门新闻
for category in all_categories_map:
    cate_url = all_categories_map[category]
    print('--> 爬取 {} 版块:{}'.format(category, cate_url))
    html = get_html(cate_url)
    soup = BeautifulSoup(html, 'lxml')
    items = soup.find_all('tr')

    news_title_set = set()
    for item in tqdm(items):
        try:
            tds = item.select('td')
            if len(tds) < 2:
                continue

            news_url = tds[0].a['href']

            news_soup = BeautifulSoup(get_html(news_url), 'lxml')
            if news_soup.title is None or news_soup.title.string.strip() == '':
                news_title = tds[0].a.text.strip()
            else:
                news_title = news_soup.title.string

            # 避免新闻爬取重复
            if news_title in news_title_set:
                continue
            news_title_set.add(news_title)

            click_count = int(tds[1].text.strip())

            news_info = {'category': category, 'title': news_title, 'url': news_url, 'click_count': click_count}
            news_infoes.append(news_info)
            if len(news_infoes) == 10:
                file_out.writelines([json.dumps(info, ensure_ascii=False) + '\n' for info in news_infoes])
                file_out.flush()
                news_infoes.clear()
            time.sleep(0.5)
        except:
            continue

......
4. 基于Python热点新闻关键词数据分析系统
4.1 系统注册登录

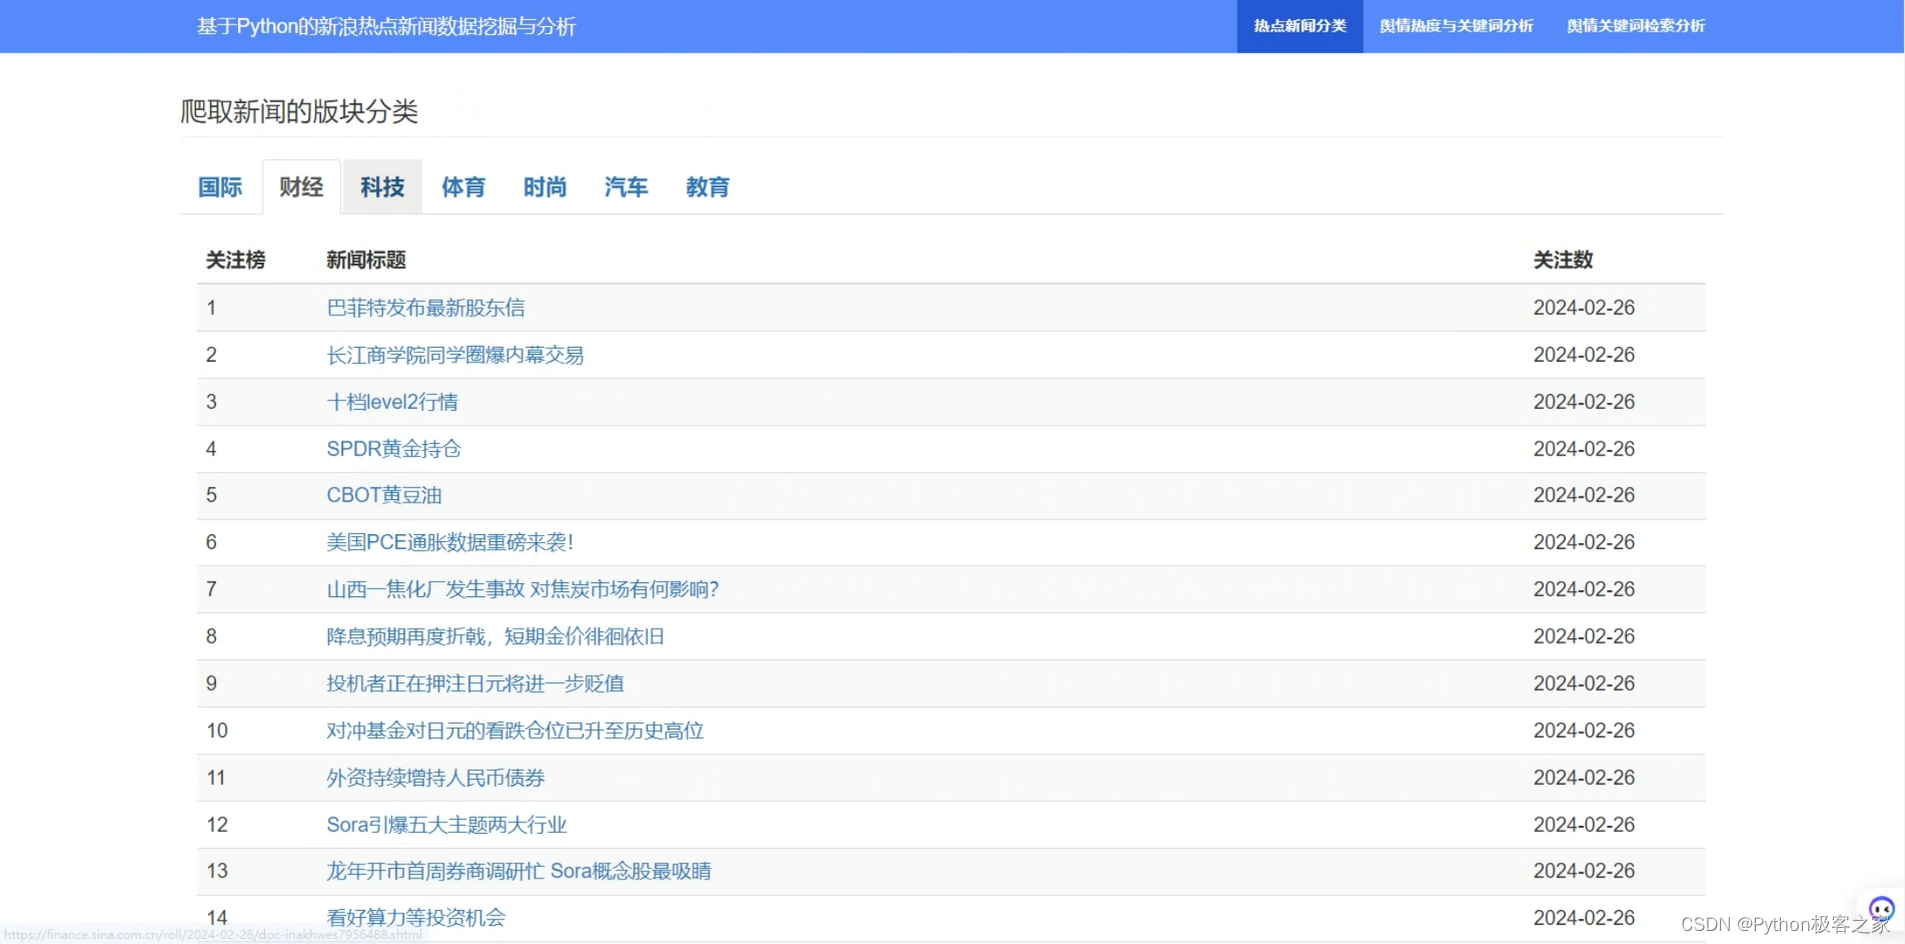
4.2 热点新闻分类展示
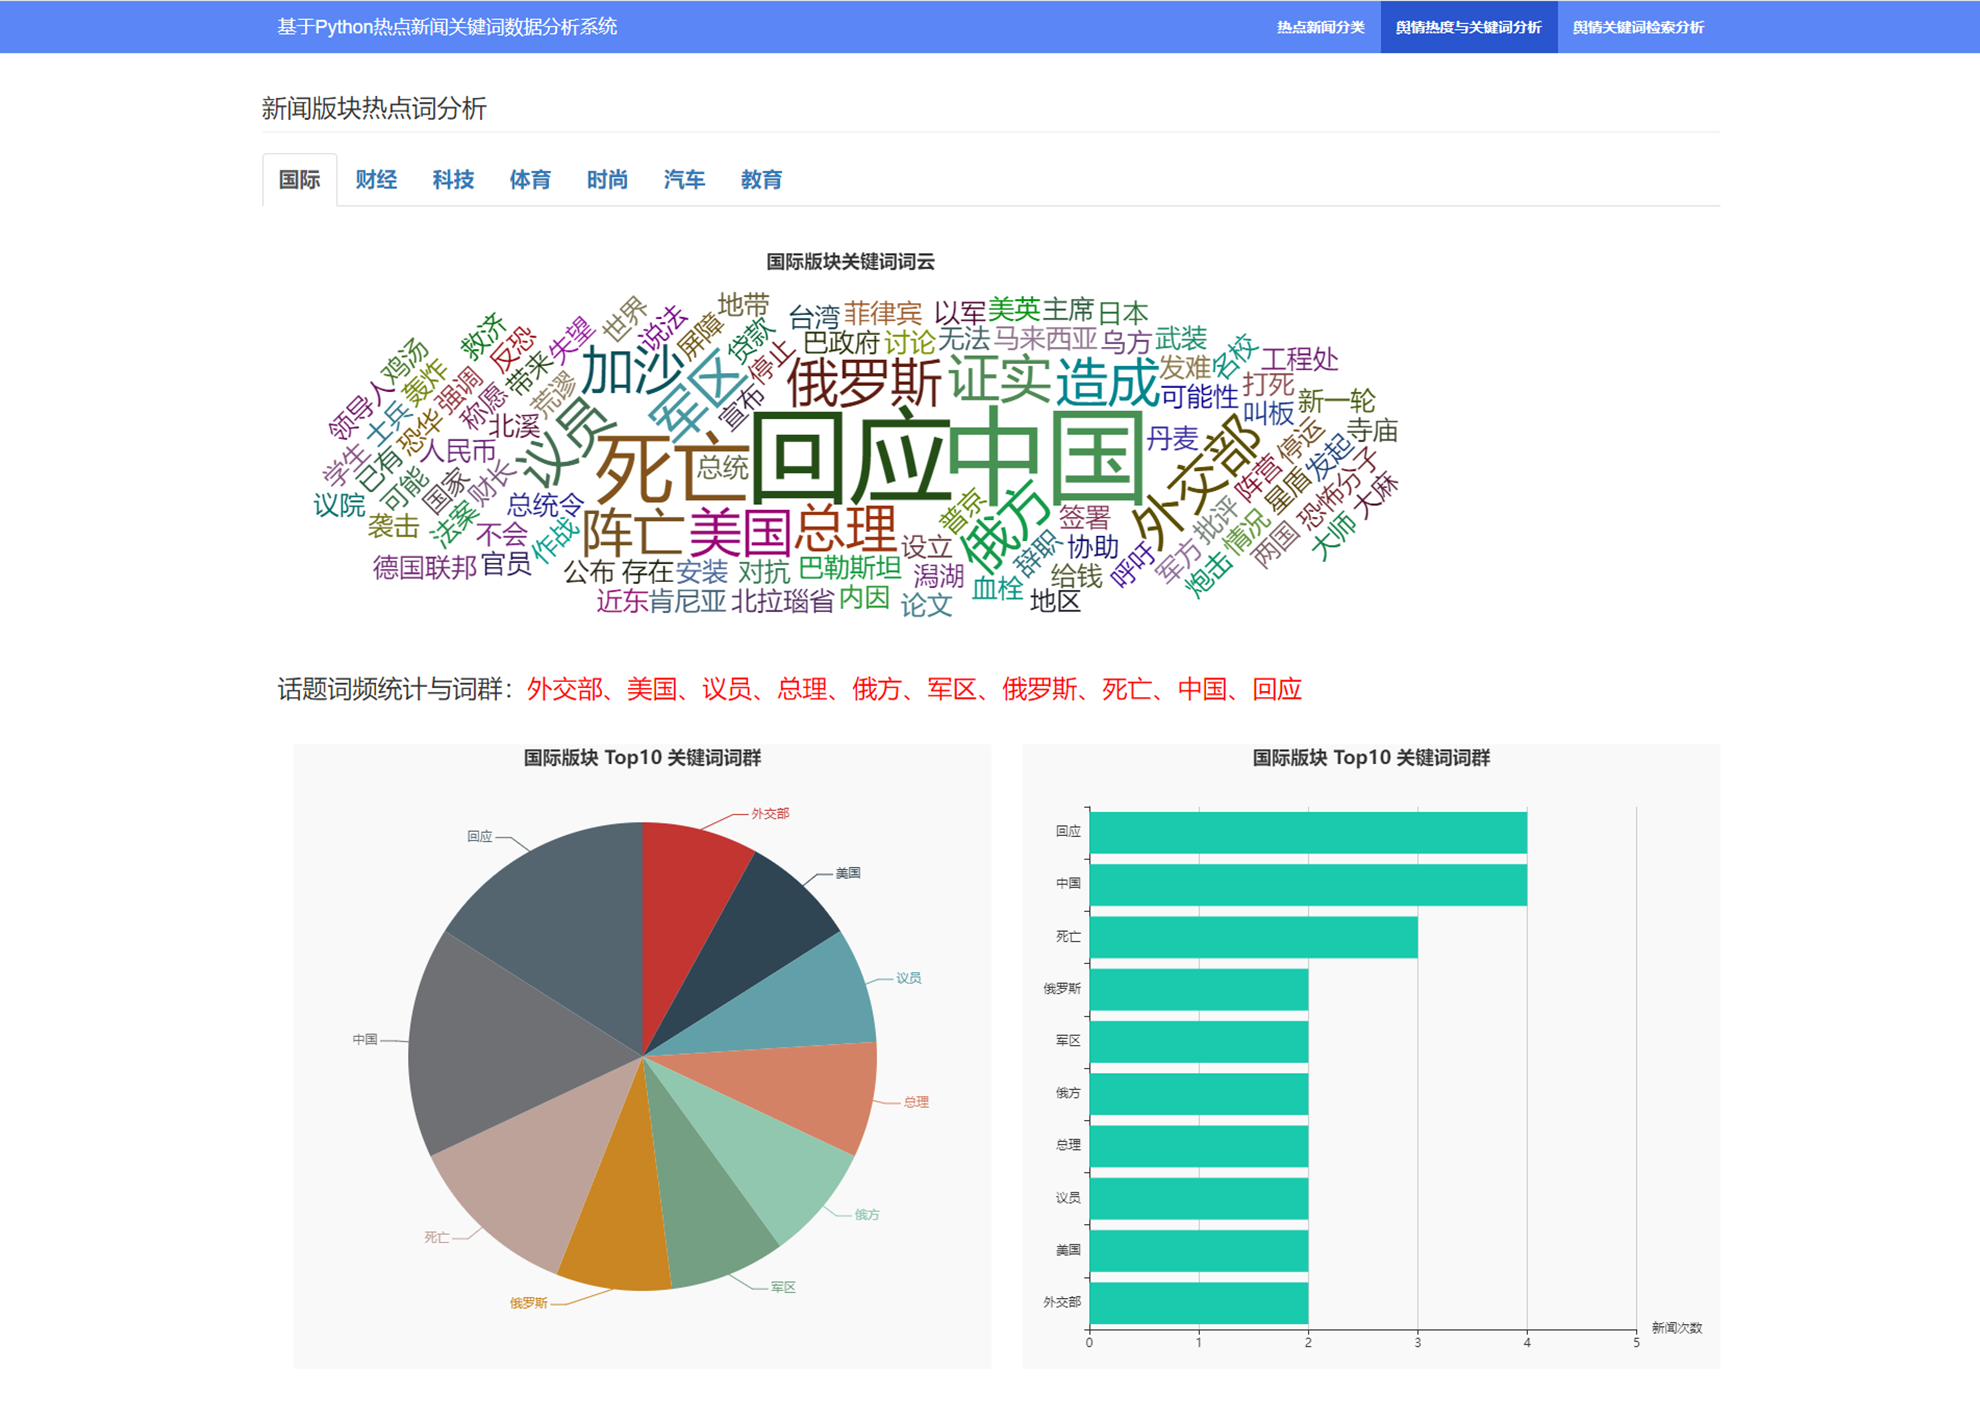
4.3 话题词频统计与词群分析
通过对新闻关键词抽取、词频统计,并对多个关键词进行聚类形成词群:
def news_words_analysis(category):
    ......

    word_count = {}
    for key_words in cate_df['title_cut']:
        for word in key_words:
            if word in word_count:
                word_count[word] += 1
            else:
                word_count[word] = 1

    wordclout_dict = sorted(word_count.items(), key=lambda d: d[1], reverse=True)
    wordclout_dict = [{"name": k[0], "value": k[1]} for k in wordclout_dict]

    # 选取 top10 的词作为话题词群
    top_keywords = [w['name'] for w in wordclout_dict[:10]][::-1]
    top_keyword_counts = [w['value'] for w in wordclout_dict[:10]][::-1]

    ......
4.4 新闻热度分析
新闻热度主要依据每个版块的所有新闻的关注人数的分布情况,前端利用 echarts 和 ecStat 实现密度分布直方图的可视化:
var dom = document.getElementById("main1");
var myChart = echarts.init(dom);
var app = {};
option = null;
var girth = data['click_counts'];
var bins = ecStat.histogram(girth, 'scott');

var interval;
var min = Infinity;
var max = -Infinity;

var bins_data = echarts.util.map(bins.data, function (item, index) {
    var x0 = bins.bins[index].x0;
    var x1 = bins.bins[index].x1;
    interval = x1 - x0;
    min = Math.min(min, x0);
    max = Math.max(max, x1);
    return [x0, x1, item[1]];
});

function renderItem(params, api) {
    var yValue = api.value(2);
    var start = api.coord([api.value(0), yValue]);
    var size = api.size([api.value(1) - api.value(0), yValue]);
    var style = api.style();

    return {
        type: 'rect',
        shape: {
            x: start[0] + 1,
            y: start[1],
            width: size[0] - 2,
            height: size[1]
        },
        style: style
    };
}

option = {
    backgroundColor: '#F9F9F9',
    title: {
        text: key + '版块关注热度分布直方图(关注次数最大值' + data['max_click_count'] + ',最小值' + data['min_click_count'] + ')',
        left: 'center',
        top: 10
    },
    color: ['rgb(25, 183, 207)'],
    grid: {
        top: 80,
        containLabel: true
    },
    tooltip: {
        trigger: 'axis',
        axisPointer: {
            type: 'shadow'
        }
    },
    xAxis: [{
        type: 'value',
        min: min,
        max: max,
        interval: interval
    }],
    yAxis: [{
        type: 'value',
    }],
    series: [{
        name: '新闻个数',
        type: 'custom',
        renderItem: renderItem,
        label: {
            show: true,
            position: 'insideTop'
        },
        encode: {
            x: [0, 1],
            y: 2,
            tooltip: 2,
            label: 2
        },
        data: bins_data
    }]
};
if (option && typeof option === "object") {
    myChart.setOption(option, true);
}
5. 总结
5. 总结
本项目利用网络爬虫技术从某新闻网站爬取最新的新闻数据,并进行版块分类,对某篇版块下的所有新闻进行中文分词,保留表征能力强名词和动词作为关键词,并进行关键词词频统计,同时对新闻进行词云统计和词群分析。对不同版块的新闻热度进行统计分析。利用 flask 搭建后台,构建标准的 restful 接口,前端利用 bootstrap + echarts + jquery 调用后台接口,并进行前端的渲染可视化。
欢迎大家点赞、收藏、关注、评论啦 ,由于篇幅有限,只展示了部分核心代码。技术交流、源码获取认准下方 CSDN 官方提供的学长 QQ 名片 :)
精彩专栏推荐订阅:


 617
617

 被折叠的 条评论
为什么被折叠?
被折叠的 条评论
为什么被折叠?
 到【灌水乐园】发言


