


一.部署环境
* InfluxDB集群节点数:mate服务至少3个节点,节点数越多,集群性能越高。
* 操作系统:支持的操作系统包括Linux、Windows和MacOS。
* CPU:至少2核4线程,主频越高越好。
* 内存:至少8GB内存,推荐16GB或以上。
* 存储:至少100GB的磁盘空间,推荐使用SSD或NVMe SSD存储
二.集群文件配置修改
| ip地址 | 服务名称 |
| 192.168.110.1x0 | influxdb,meta |
| 192.168.110.1x1 | influxdb,meta |
| 192.168.110.1x8 | meta |
1.influxdb-meta.conf配置文件修改
meta至少三个节点修改配置比较简单
hostname = "192.168.110.1x0"
dir = "/data/var/lib/influxdb/meta"
hostname = "192.168.110.1x1"
dir = "/data/var/lib/influxdb/meta"
hostname = "192.168.110.1x8"
dir = "/data/var/lib/influxdb/meta"
2.influxdb.conf配置修改:红色为修改参数
influxdb-mate.conf每台只需要修改下面参数
hostname = "192.168.110.1x0"
[meta].
dir = "/data/var/lib/influxdb/meta"
第一个influx的配置influxdb.conf修改
hostname = "192.168.110.1x0"
[meta]
# Directory where the cluster metadata is stored.
dir = "/data/var/lib/influxdb/meta"
[data]
dir = "/data/var/lib/influxdb/data"
wal-dir = "/data/var/lib/influxdb/wal"
wal-fsync-delay = "1ms"
index-version = "tsi1"
cache-max-memory-size = "48g"
cache-snapshot-memory-size = "4096m"
max-concurrent-compactions = 12
series-id-set-cache-size = 100[coordinator]
max-select-point = 1000000
max-select-series = 1000000[hinted-handoff]
# The directory where the hinted handoff queues are stored.
dir = "/data/var/lib/influxdb/hh"
第二个influx的配置influxdb.conf修改
hostname = "192.168.110.1x1"
[meta]
# Directory where the cluster metadata is stored.
dir = "/data/var/lib/influxdb/meta"
[data]
dir = "/data/var/lib/influxdb/data"
wal-dir = "/data/var/lib/influxdb/wal"
wal-fsync-delay = "1ms"
index-version = "tsi1"
cache-max-memory-size = "48g"
cache-snapshot-memory-size = "4096m"
max-concurrent-compactions = 12
series-id-set-cache-size = 100[coordinator]
max-select-point = 1000000
max-select-series = 1000000[hinted-handoff]
# The directory where the hinted handoff queues are stored.
dir = "/data/var/lib/influxdb/hh"
三.集群构建启动
1.meta元数据集群的构建
启动meta集群(所有的mate节点上执行)
nohup influxd-meta -config /data/influxdb/etc/influxdb/influxdb-meta.conf > nohup.out 2>&1 &
在其中一个节点上执行
influxd-ctl add-meta 192.168.110.1x0:8091 influxd-ctl add-meta 192.168.110.1x1:8091 influxd-ctl add-meta 192.168.110.1x8:8091

2.influxdb集群服务
启动data服务(所有influx的数据节点上执行)
nohup influxd -config /data/influxdb/etc/influxdb/influxdb.conf > nohup.out 2>&1 &
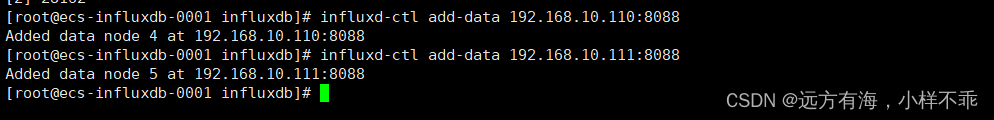
将data节点加入集群(其中一个data节点上)
influxd-ctl add-data 192.168.10.1x0:8088 influxd-ctl add-data 192.168.10.1x1:8088
四.配置负载均衡
nginx配置参数如下
#user nobody;
worker_processes 1;#error_log logs/error.log;
#error_log logs/error.log notice;
#error_log logs/error.log info;#pid logs/nginx.pid;
events {
worker_connections 1024;
}
http {
include mime.types;
default_type application/octet-stream;#log_format main '$remote_addr - $remote_user [$time_local] "$request" '
# '$status $body_bytes_sent "$http_referer" '
# '"$http_user_agent" "$http_x_forwarded_for"';#access_log logs/access.log main;
sendfile on;
#tcp_nopush on;#keepalive_timeout 0;
keepalive_timeout 65;#gzip on;
upstream influxdb {
server 192.168.110.1x0:8086;
server 192.168.110.1x1:8086;
}
server {
listen 8181;
server_name localhost;#charset koi8-r;
#access_log logs/host.access.log main;
location / {
proxy_set_header Host $proxy_host;
proxy_pass http://influxdb/;
}
error_page 500 502 503 504 /50x.html;
location = /50x.html {
root html;
}}
}
负载均衡测试
数据测试写入
curl -i -XPOST 'http://192.168.110.1x0:8181/influx/write?db=test' --data-binary 'mymeasurement,mytag=1 myfield=90'
数据查询
curl -XPOST "http://192.168.10.1x0:8181/influx/query?db=test" --data-urlencode "q=Select * from mymeasurement" --header "Authorization: Bearer eyJhbGciOiJIUzI1NiIsInR5cCI6IkpXVCJ9.eyJ1c2VybmFtZSI6ImFkbWluIiwiZXhwIjoxNjc5NjQyNTEyfQ.7mIPMjB60kFGFQuTSyf7KvYF921MkMmL662_icTfvRQ"
五.命令手册
influxd-meta config 显示所有meta的配置
influxd config 显示所有influxdata的配置
influx-ctl show 显示集群节点
create database iot_env_data
创建用户设置密码
create user iot_admin with password 'xxx1' with all privileges


 4341
4341


 被折叠的 条评论
为什么被折叠?
被折叠的 条评论
为什么被折叠?
 到【灌水乐园】发言


