


"""
Python海龟数据分析,第七次全国人口普查历年数据图表.py
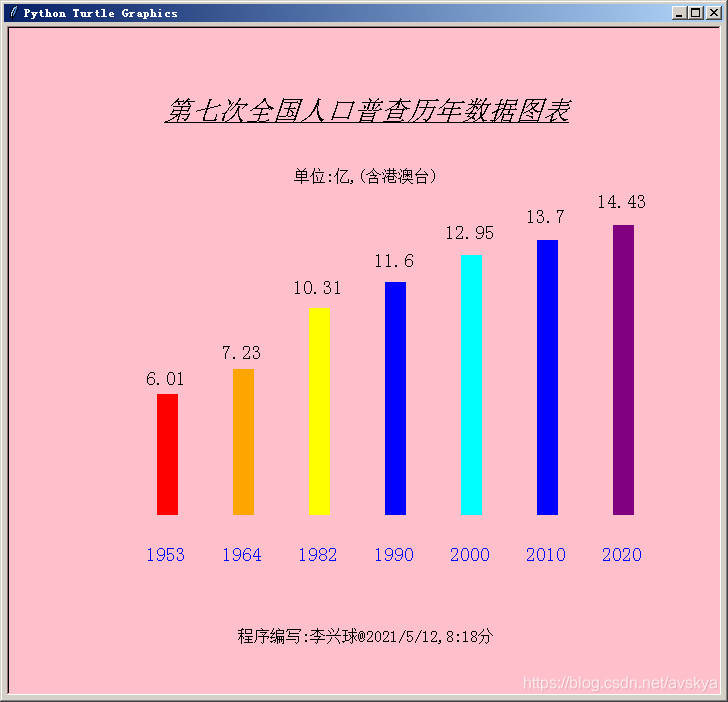
使用Python的海龟模块能进行数据分析,显示统计图标,画柱状图吗?
答案是肯定的。下面的程序主要使用了变形shapesize和图章功能。
把每一年人口数据以柱状图的形式显示出来。
本程序网址: http://www.lixingqiu.com/2021/05/12/python%e6%b5%b7%e9%be%9f%e6%95%b0%e6%8d%ae%e5%88%86%e6%9e%90%ef%bc%8c%e7%ac%ac%e4%b8%83%e6%ac%a1%e5%85%a8%e5%9b%bd%e4%ba%ba%e5%8f%a3%e6%99%ae%e6%9f%a5%e5%8e%86%e5%b9%b4%e6%95%b0%e6%8d%ae%e5%9b%be/
更多用turtle模块, pygame模块创造的创意程序,请上萍乡李兴球博客 www.lixingqiu.com
"""
import turtle
years = [1953,1964,1982,1990,2000,2010,2020] # 年份表
datas = [6.01,7.23,10.31,11.60,12.95,13.70,14.43] # 数据含港澳台,单位:亿
cs = ['red','orange','yellow','blue','cyan','blue','purple'] # 颜色表
points =((0,0),(0,10),(-20,10),(-20,-10),(0,-10))
turtle.addshape('csquare',points)
turtle.shape('csquare')
turtle.bgcolor("pink") # 背景色为粉红色
turtle.penup() # 抬起笔来
turtle.goto(-200,-150) # 定位到此开始盖图章
turtle.hideturtle()
ft = ('',14,'normal')
for i in range(7):
c = cs[i]
year = years[i]
人口数量 = datas[i] # 使用中文更好理解
turtle.color(c)
turtle.shapesize(人口数量,1) # 变形
turtle.stamp() # 盖图章(柱状图)
# 下面这4行代码是写年份,需要先调整y坐标
turtle.color('blue')
turtle.sety(turtle.ycor()-50)
turtle.write(year,align='center',font=ft)
turtle.sety(turtle.ycor()+50)
# 下面这4行代码是写人口数量。
turtle.color('black')
turtle.sety(turtle.ycor()+人口数量*21)
turtle.write(人口数量,align='center',font=ft)
turtle.sety(turtle.ycor()-人口数量*21)
turtle.setx(turtle.xcor()+76) # 海龟往右移76个单位
turtle.goto(0,240)
ft = ('',20,'underline italic')
s = '第七次全国人口普查历年数据图表'
turtle.write(s,align='center',font=ft)
turtle.goto(0,180)
ft = ('',12,'normal')
s = '单位:亿,(含港澳台)'
turtle.write(s,align='center',font=ft)
turtle.goto(0,-280)
ft = ('',12,'normal')
s = '程序编写:李兴球@2021/5/12,8:18分'
turtle.write(s,align='center',font=ft)
本程序已经记录在要人博客里,需要的联系本人!


 1975
1975


 被折叠的 条评论
为什么被折叠?
被折叠的 条评论
为什么被折叠?
 到【灌水乐园】发言


